

Although currency bears took AUD/USD to the lowest level since the beginning of 2017 in recent days, the combination of two support lines managed to stop them. Does this mean that the bulls get a green light and we can expect a bigger move to the north in the coming days?
- EUR/USD: short (a stop-loss order at 1.1466; an initial downside target at 1.1196)
- GBP/USD: none
- USD/JPY: none
- USD/CAD: none
- USD/CHF: none
- AUD/USD: none
EUR/USD
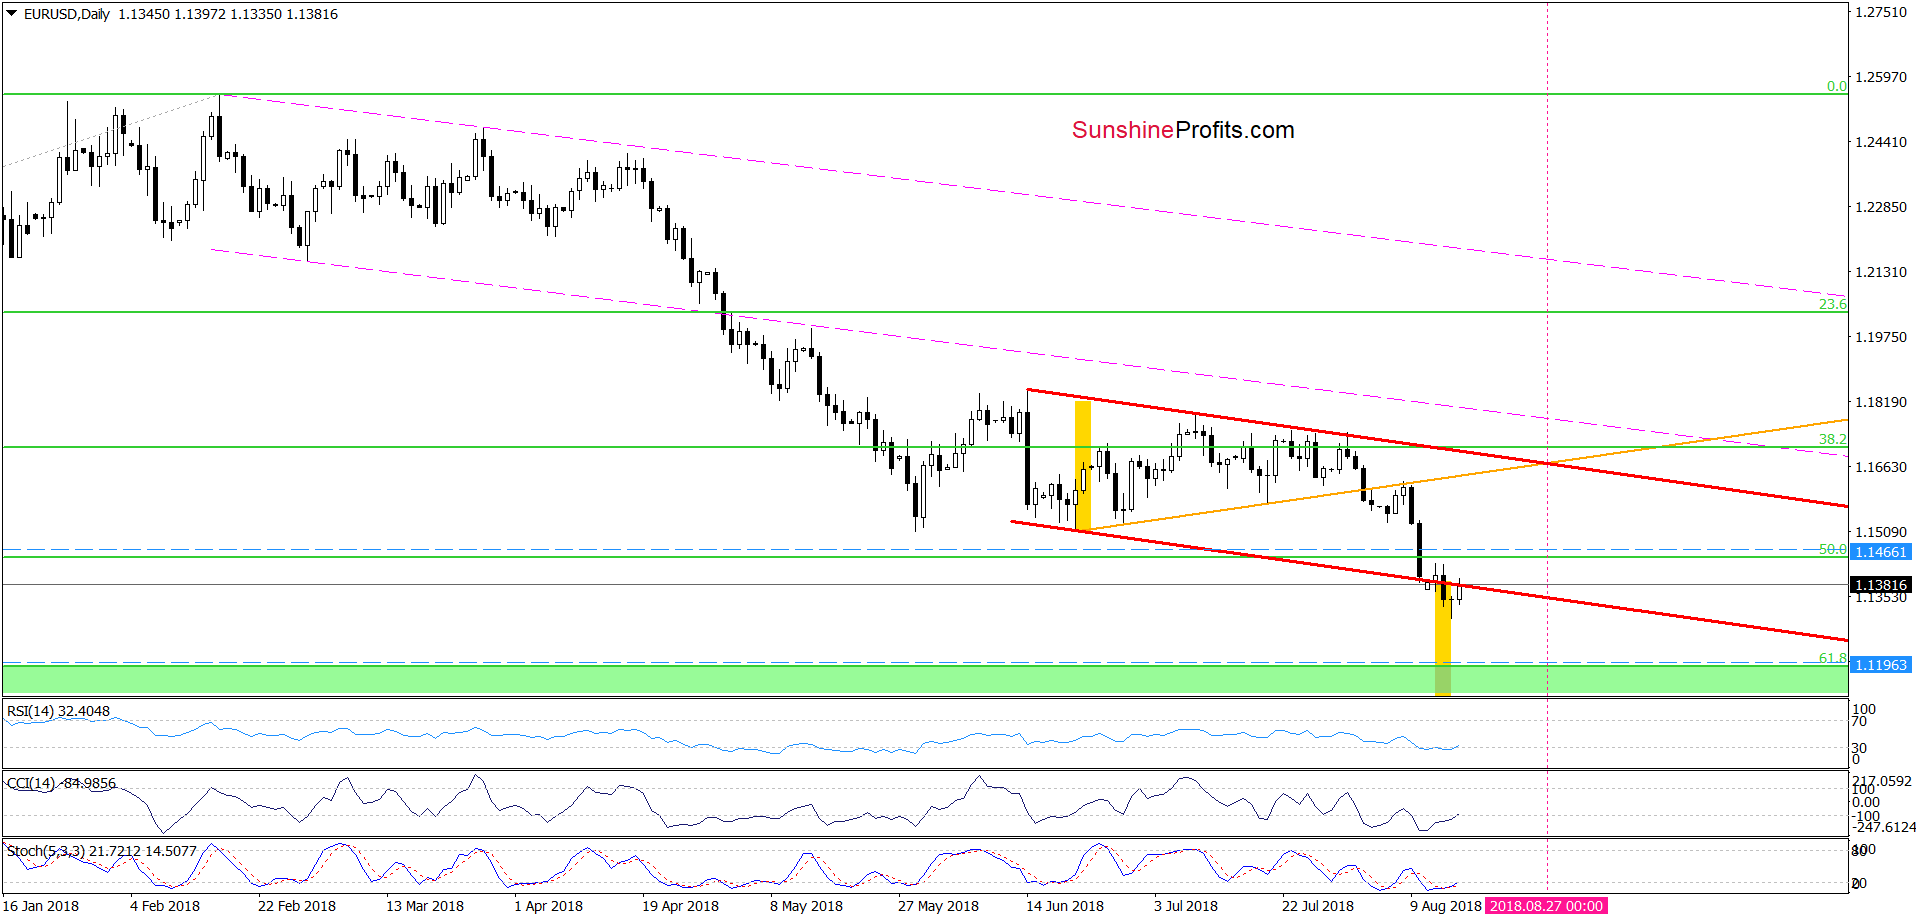
Looking at the daily chart, we see that although EUR/USD rebounded slightly, the pair remains under the lower border of the red declining trend channel. Frankly speaking, today’s move to the upside looks like a verification of Tuesday’s breakdown.
If this is the case, the pair will turn north once again, and we’ll see a realization of the pro-bearish scenario from our yesterday’s alert:
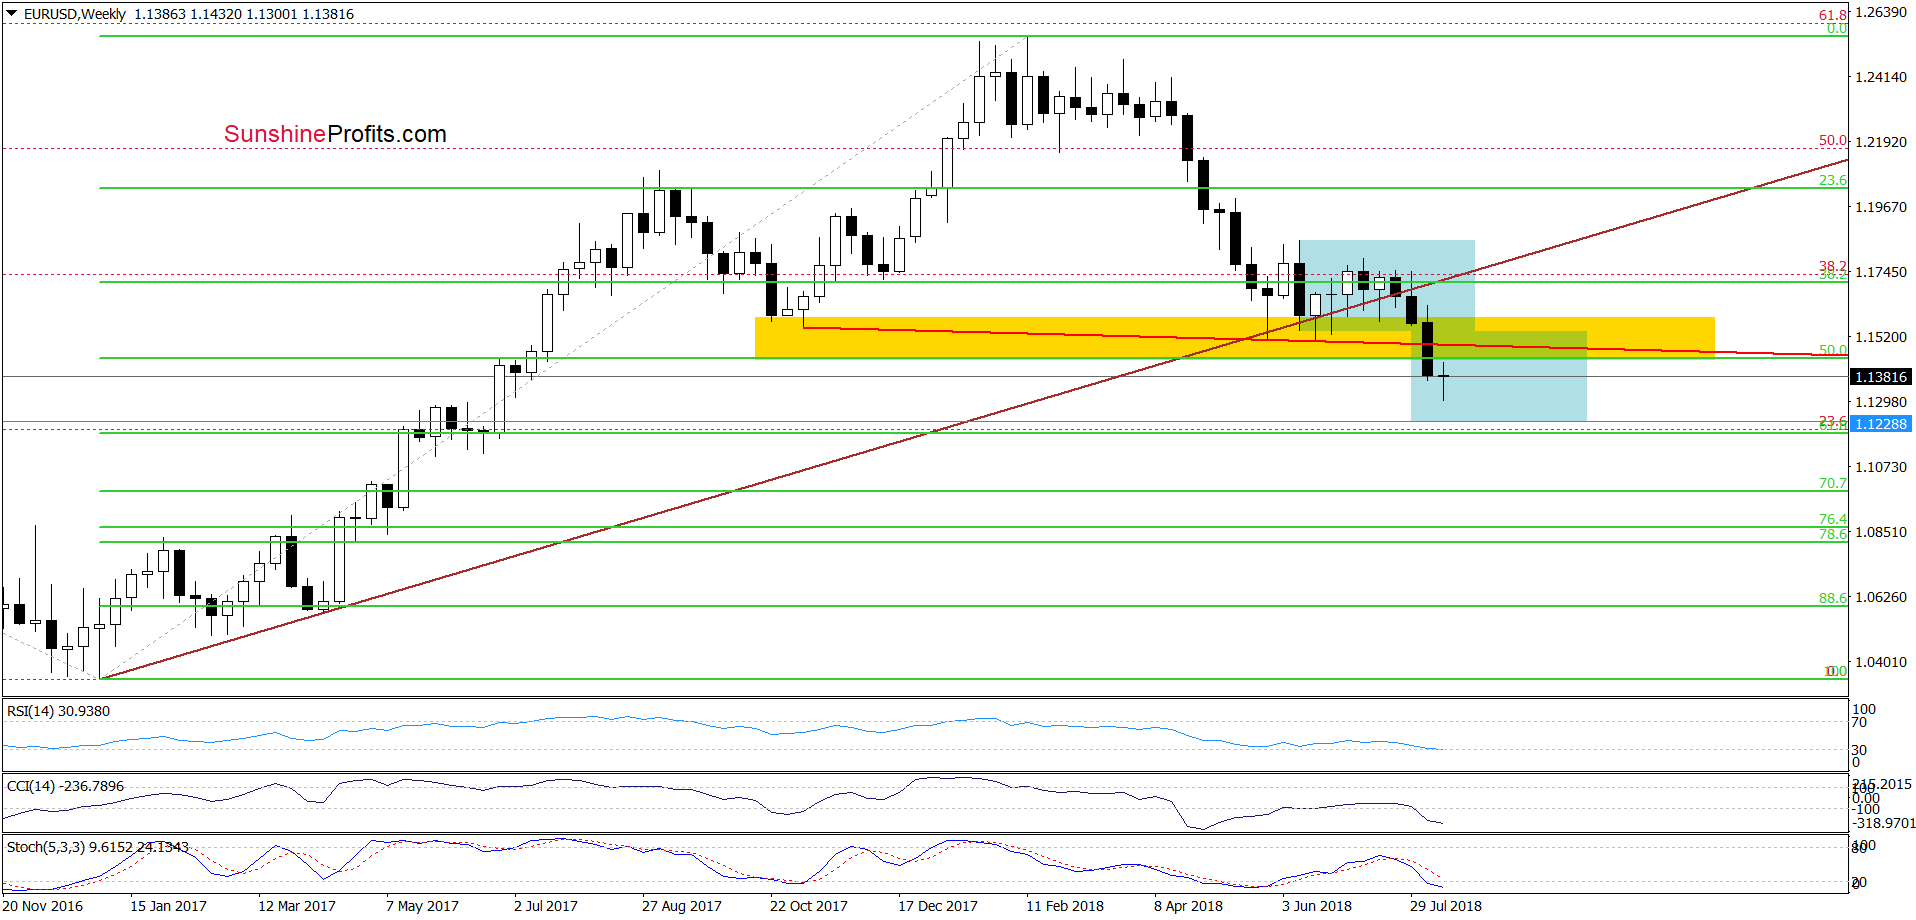
(…) a drop to (at least) the 61.8% Fibonacci retracement (based on the entire 2017-2018 upward move, which is seen more clearly on the weekly chart below).
(…) in this area the size of the downward move will correspond to the height of the blue consolidation, which increases the probability that currency bears will test this area in the following days.
Trading position (short-term; our opinion): Short positions with a stop-loss order at 1.1466 (we decided to move it a bit higher to avoid an unwanted closure of our short position, if currency bulls manage to hit a fresh intraday high later in the day) and an initial downside target at 1.1196 are justified from the risk/reward perspective. We will keep you informed should anything change, or should we see a confirmation/invalidation of the above.
GBP/USD
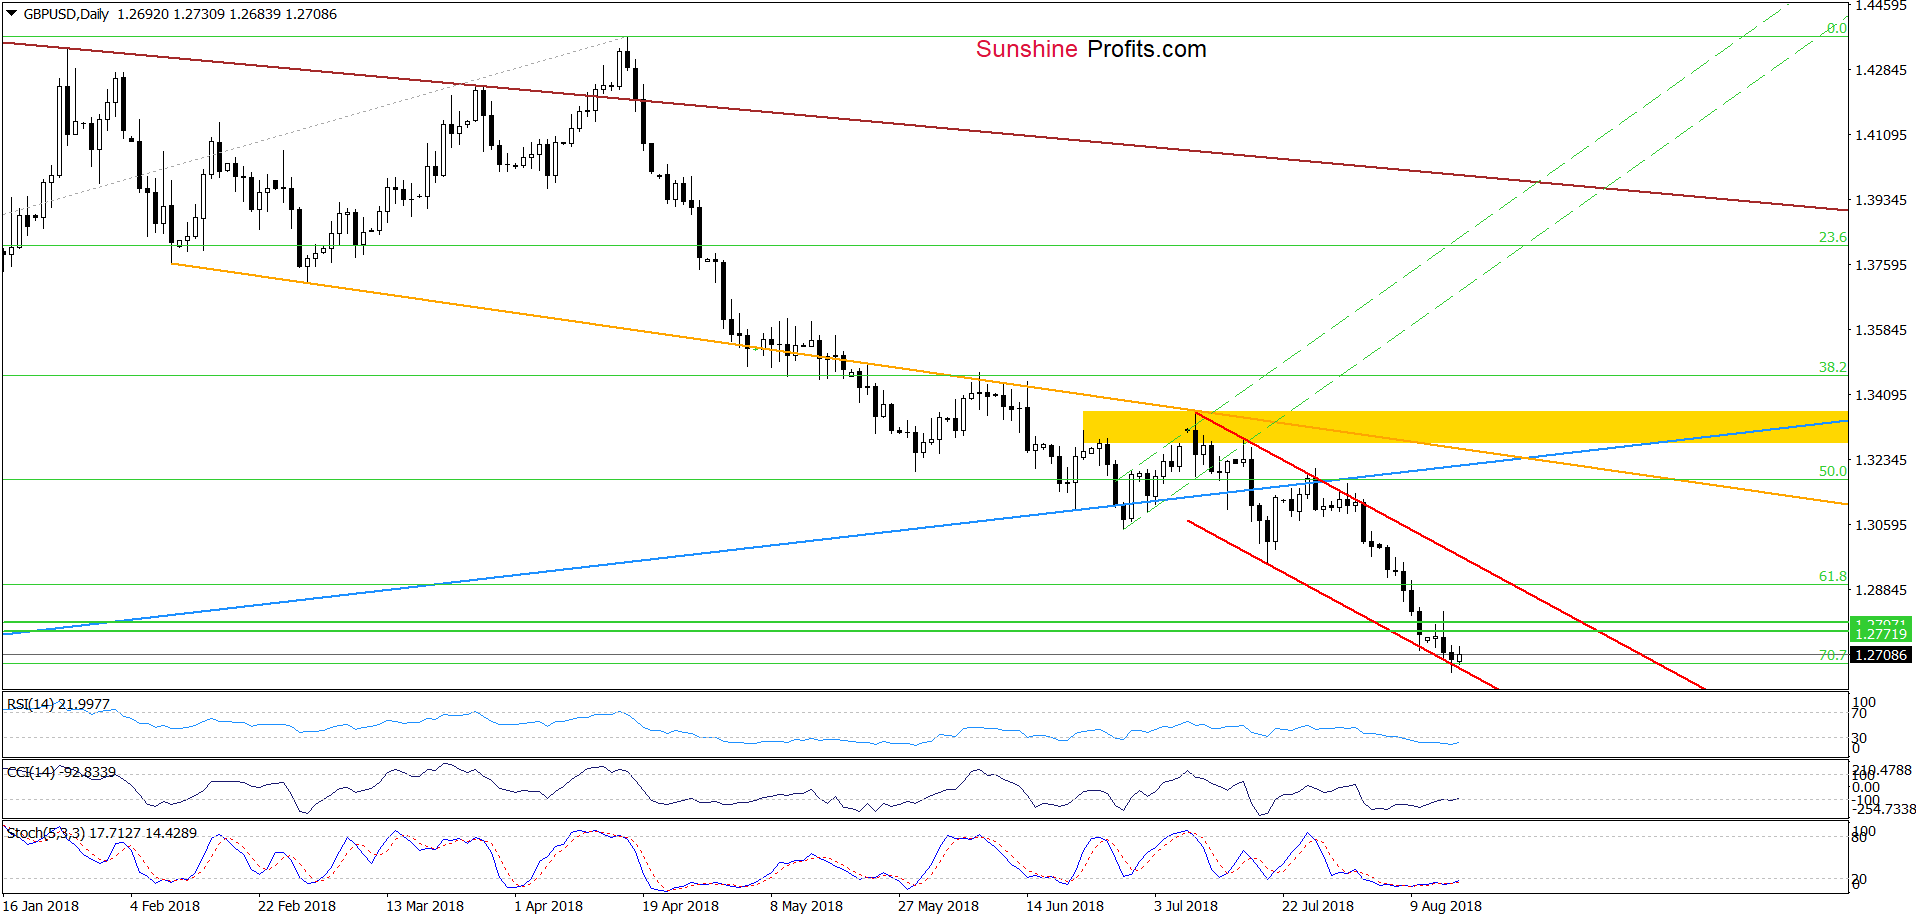
As you see on the above chart, although GBP/USD moved a bit lower during yesterday’s session, the lower border of the very short-term red declining trend channel withstood the selling pressure and continues to keep declines in check.
Therefore, in our opinion, as long as this support remains in the cards a bigger move to the downside is not likely to be seen.
Earlier today, the pair increased slightly, but the size of this move is too small (at the moment of writing this alert) to confirm currency bulls’ strength – especially when we factor in the fact that GBP/USD is still trading under the previously-broken August 2017 lows (marked with both green horizontal lines).
This suggests that a bigger move to the upside will be more likely and reliable only if the exchange rate invalidates the earlier breakdown bellow both green lines and daily indicators generate buy signals. Until this time, waiting at the sidelines is justified from the risk/reward perspective.
Trading position (short-term; our opinion): No positions are justified from the risk/reward perspective. We will keep you informed should anything change, or should we see a confirmation/invalidation of the above.
USD/JPY
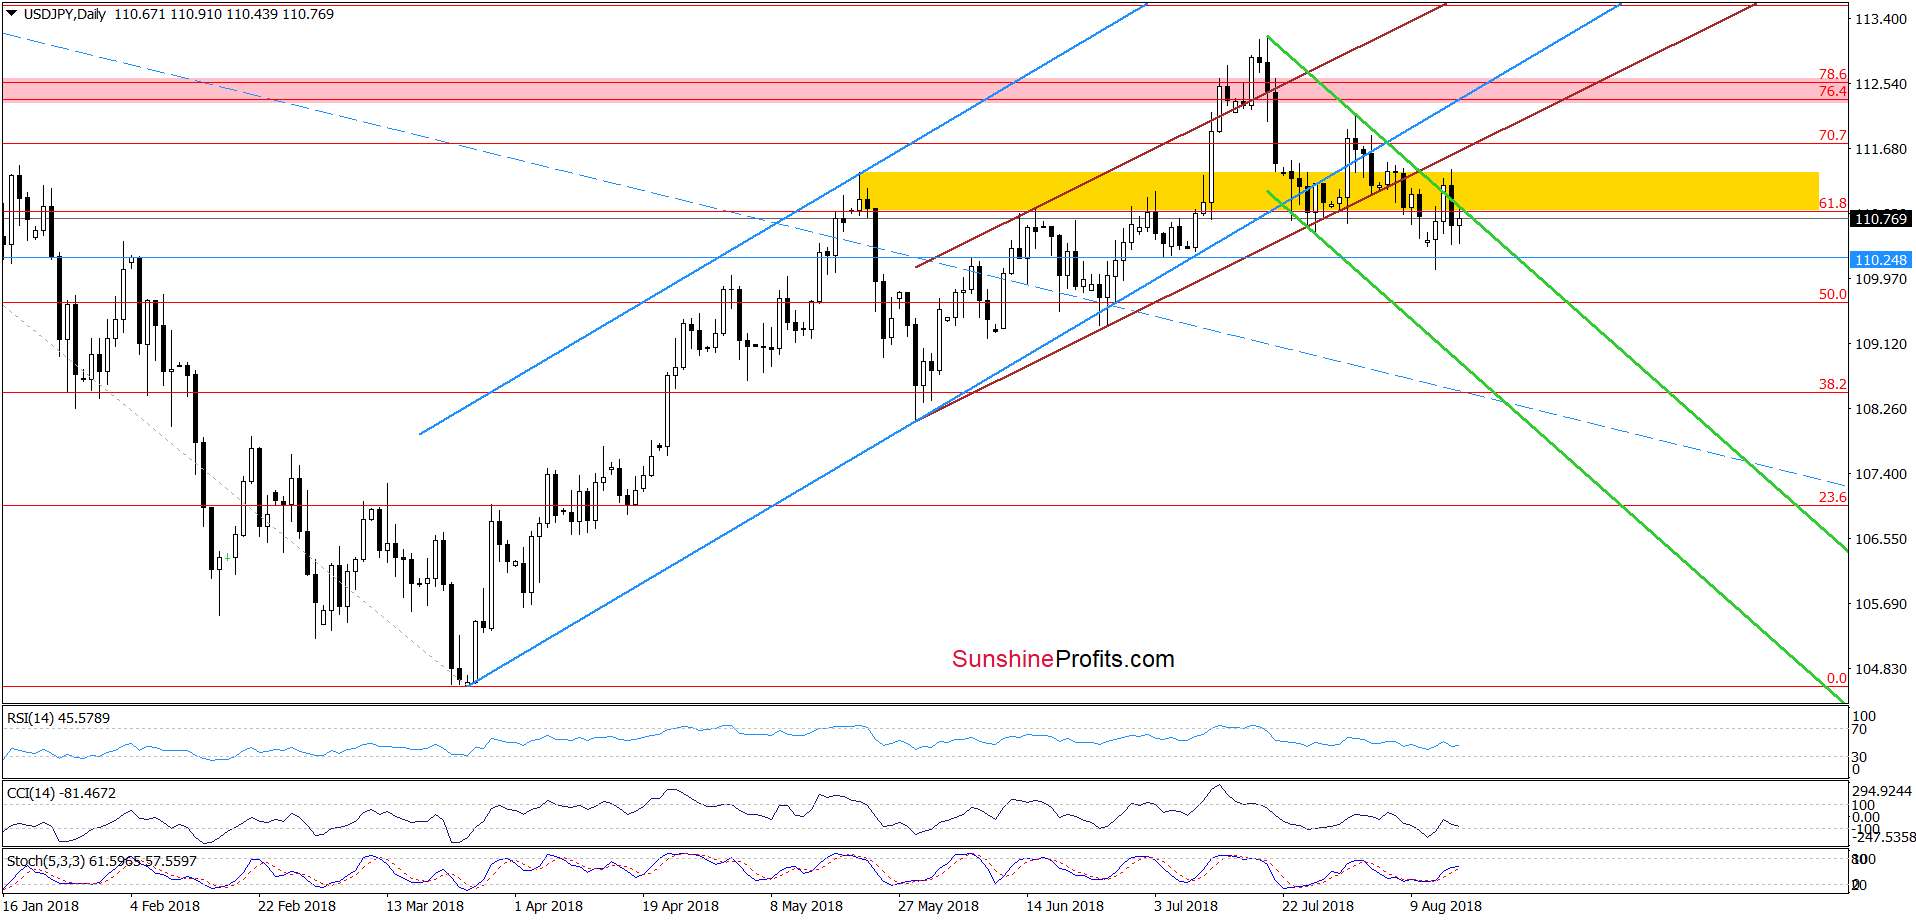
The first thing that catches the eye on the daily chart is an invalidation of the small breakout above the upper border of the very short-term green declining trend channel. At this point it is also worth noting that currency bulls didn’t even reach the previously-broken lower borders of the brown rising trend channels, which suggests that as long as they do not more strength higher values of USD/JPY are doubtful and waiting at the sidelines is justified from the risk/reward perspective.
On the other hand, however, we should keep in mind the buyers still have a strong and solid ally on their side – the long-term orange support line (seen more clearly on the weekly chart below), which continues to keep declines in check from almost a month.
Therefore, we think that this week’s price action looks like another verification of the earlier breakout, which means that as long as there is no weekly closure under this line lower values of the exchange are not likely to be seen and one more reversal from here should not surprise us.
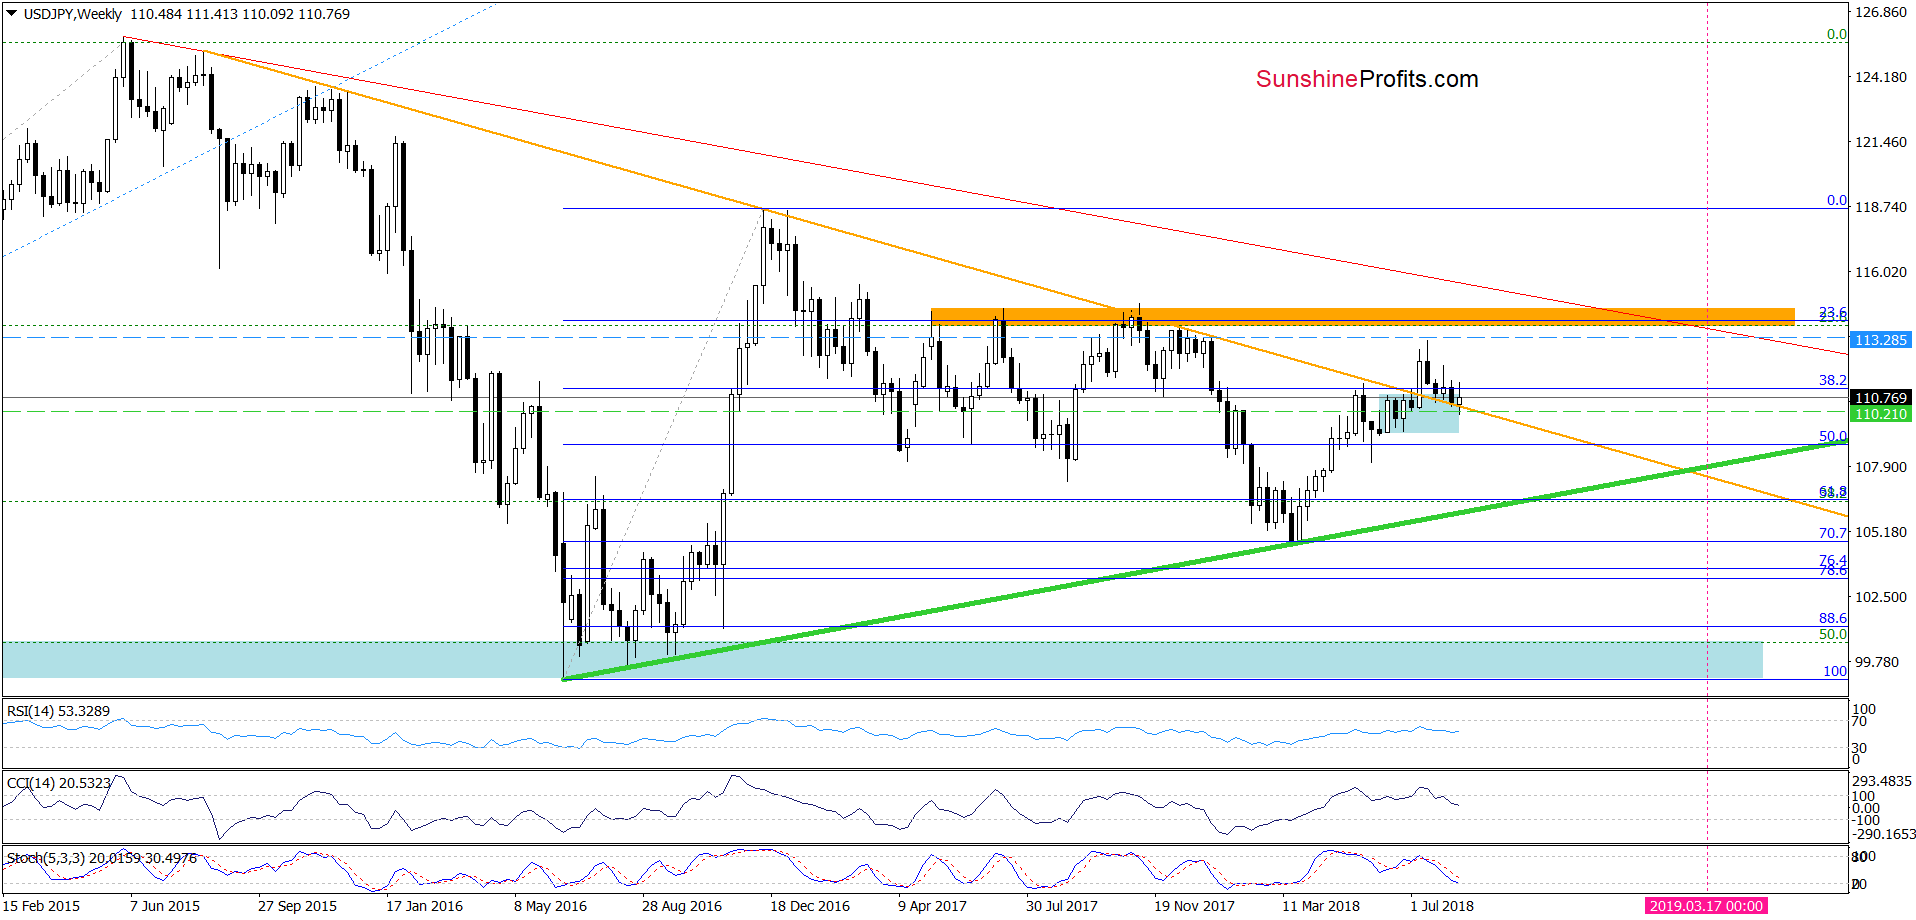
Trading position (short-term; our opinion): No positions are justified from the risk/reward perspective. We will keep you informed should anything change, or should we see a confirmation/invalidation of the above.
AUD/USD
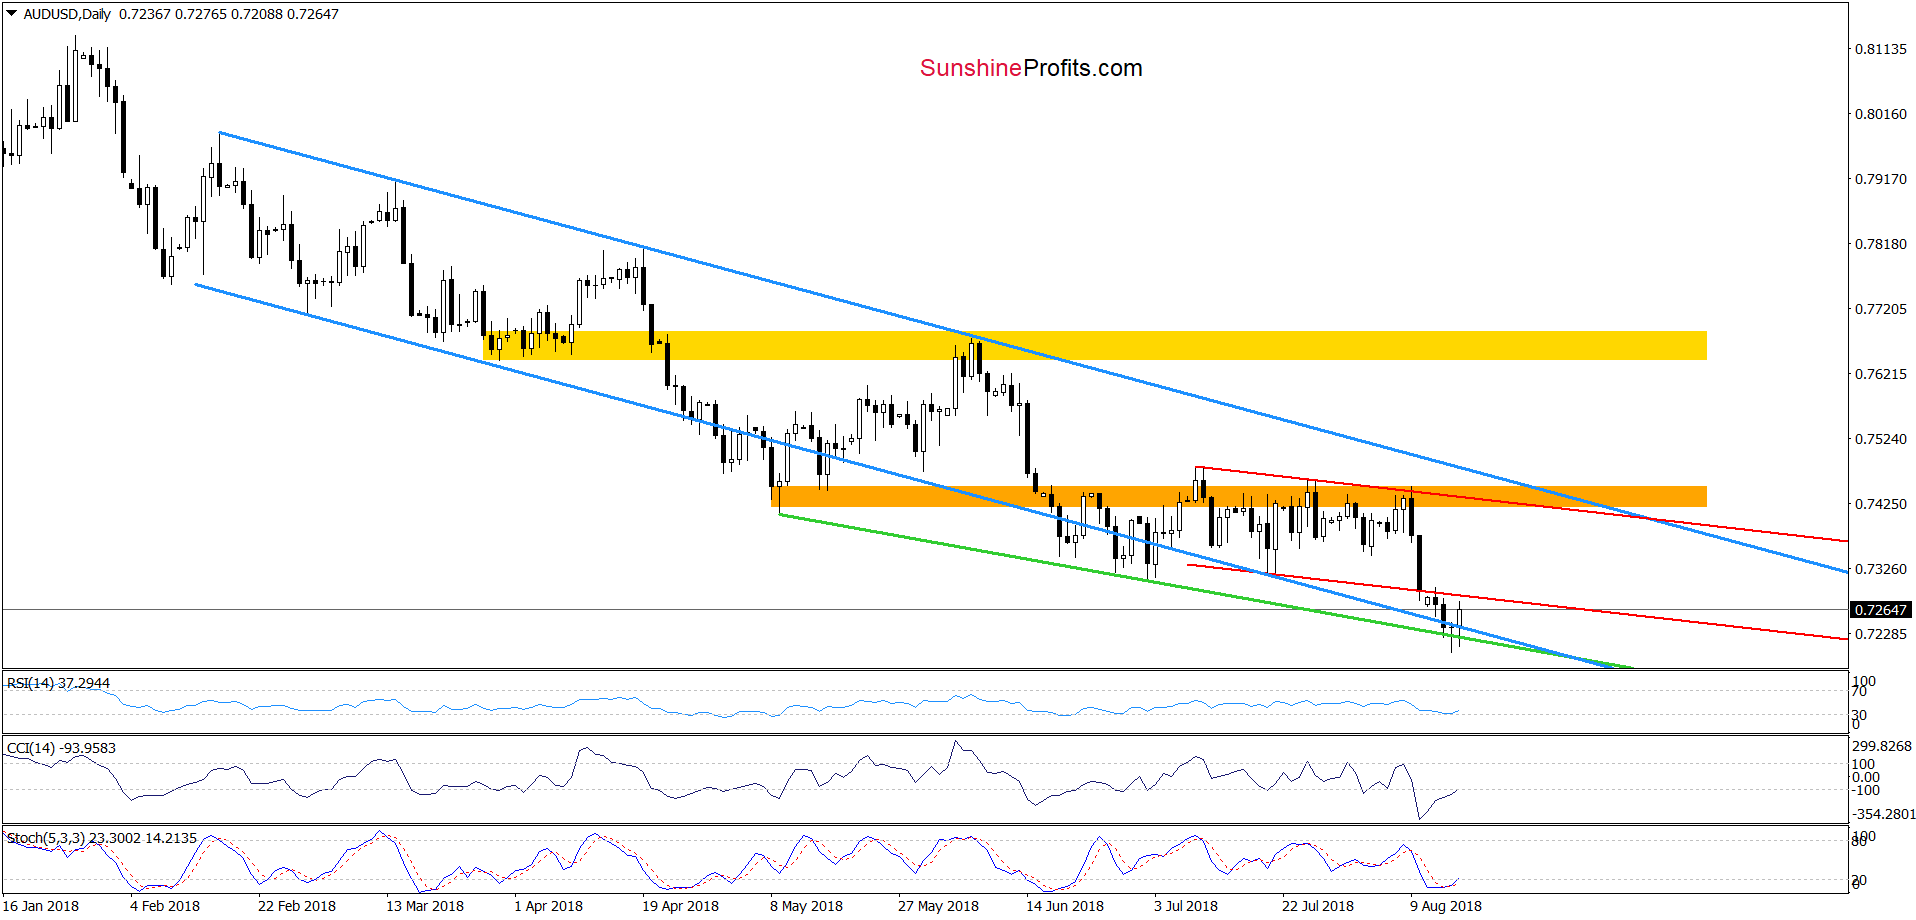
From the daily perspective, we see that the combination of the lower border of the blue declining trend channel and the green support line based on the previous lows managed to stop currency bears.
Earlier today, their opponents extended rebound, which resulted in an invalidation of a small breakdown under these lines. Although this is a positive development, it will turn into bullish only if we see a daily closure above both lines.
If we see such price action, buy signals generated by the daily indicators and an invalidation of the earlier breakdown below the lower border of the red declining trend channel, we’ll consider opening long positions.
Trading position (short-term; our opinion): No positions are justified from the risk/reward perspective. We will keep you informed should anything change, or should we see a confirmation/invalidation of the above.
Thank you.
Nadia Simmons
Forex & Oil Trading Strategist
Przemyslaw Radomski, CFA
Founder, Editor-in-chief, Gold & Silver Fund Manager
Gold & Silver Trading Alerts
Forex Trading Alerts
Oil Investment Updates
Oil Trading Alerts

