

The recent days were not very favorable for AUD/USD. If you are wondering how recent price action influenced the technical picture of the currency pair, check out our today’s alert and find the answer to this question.
In our opinion the following forex trading positions are justified - summary:
- EUR/USD: short (a stop-loss order at 1.2806; the initial downside target at 1.2186)
- GBP/USD: short (a stop-loss order at 1.4548; the initial downside target at 1.3820)
- USD/JPY: long (a stop-loss order at 107.82; the initial upside target at 111.33)
- USD/CAD: none
- USD/CHF: none
- AUD/USD: short (a stop-loss order at 0.8222; the initial downside target at 0.7730)
EUR/USD
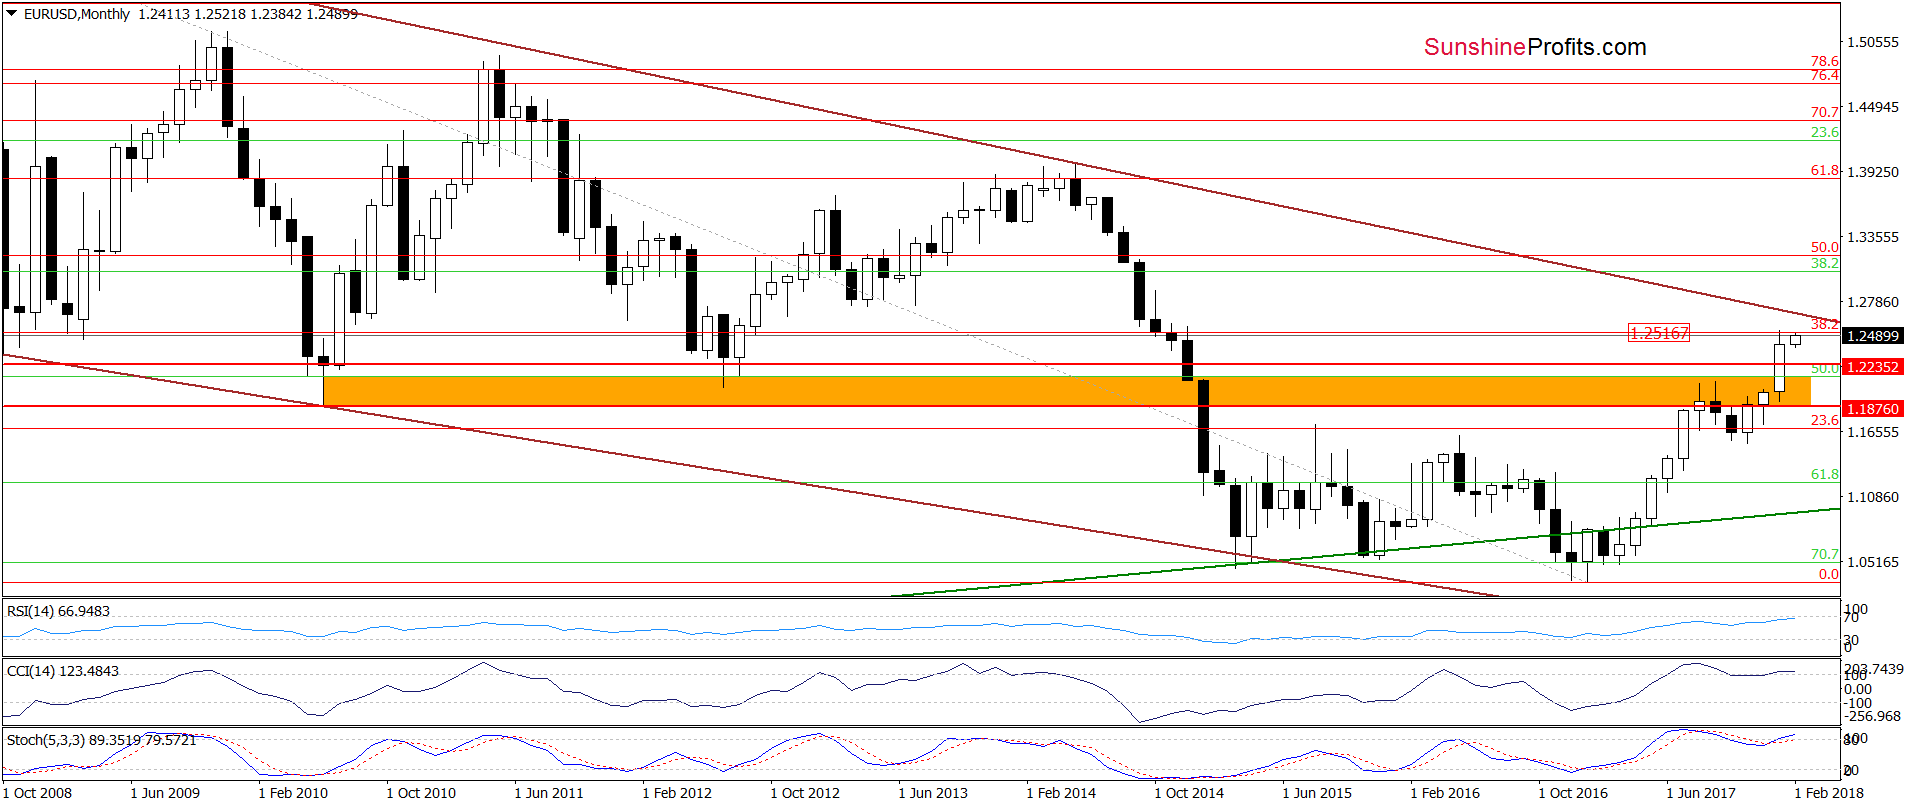
Looking at the monthly chart, we see that the overall situation hasn’t changed much as EUR/USD is still trading below the previously-broken 38.2% Fibonacci retracement. This means that what we wrote yesterday is valid also today:
(…) EUR/USD officially closed the first month of 2018 under the 38.2% Fibonacci retracement based on the entire 2008-2017 downward move. In this way, the exchange rate invalidated the earlier tiny breakout, which suggests further deterioration in the coming month.
What impact did this fact have on today’s session so far?
Not big, because EUR/USD is still trading in the blue consolidation under the above-mentioned retracement.
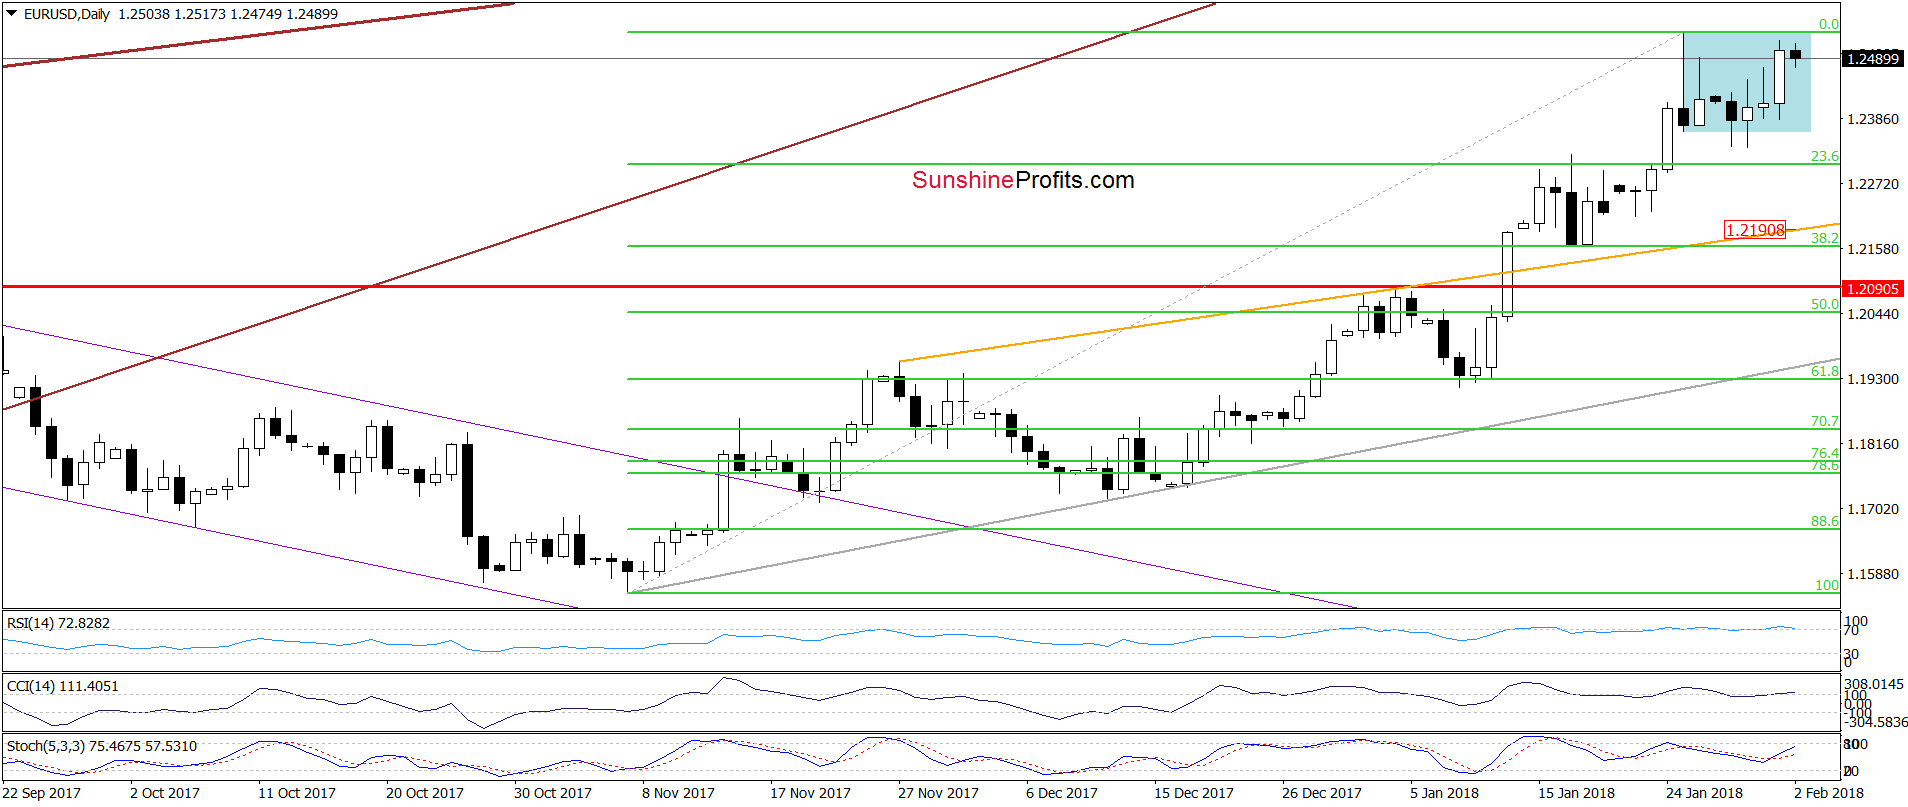
Nevertheless, (…) we think that it would be wise to consider the worst possible scenario for currency bears. So, what could happen if EUR/USD extends increases (…)?
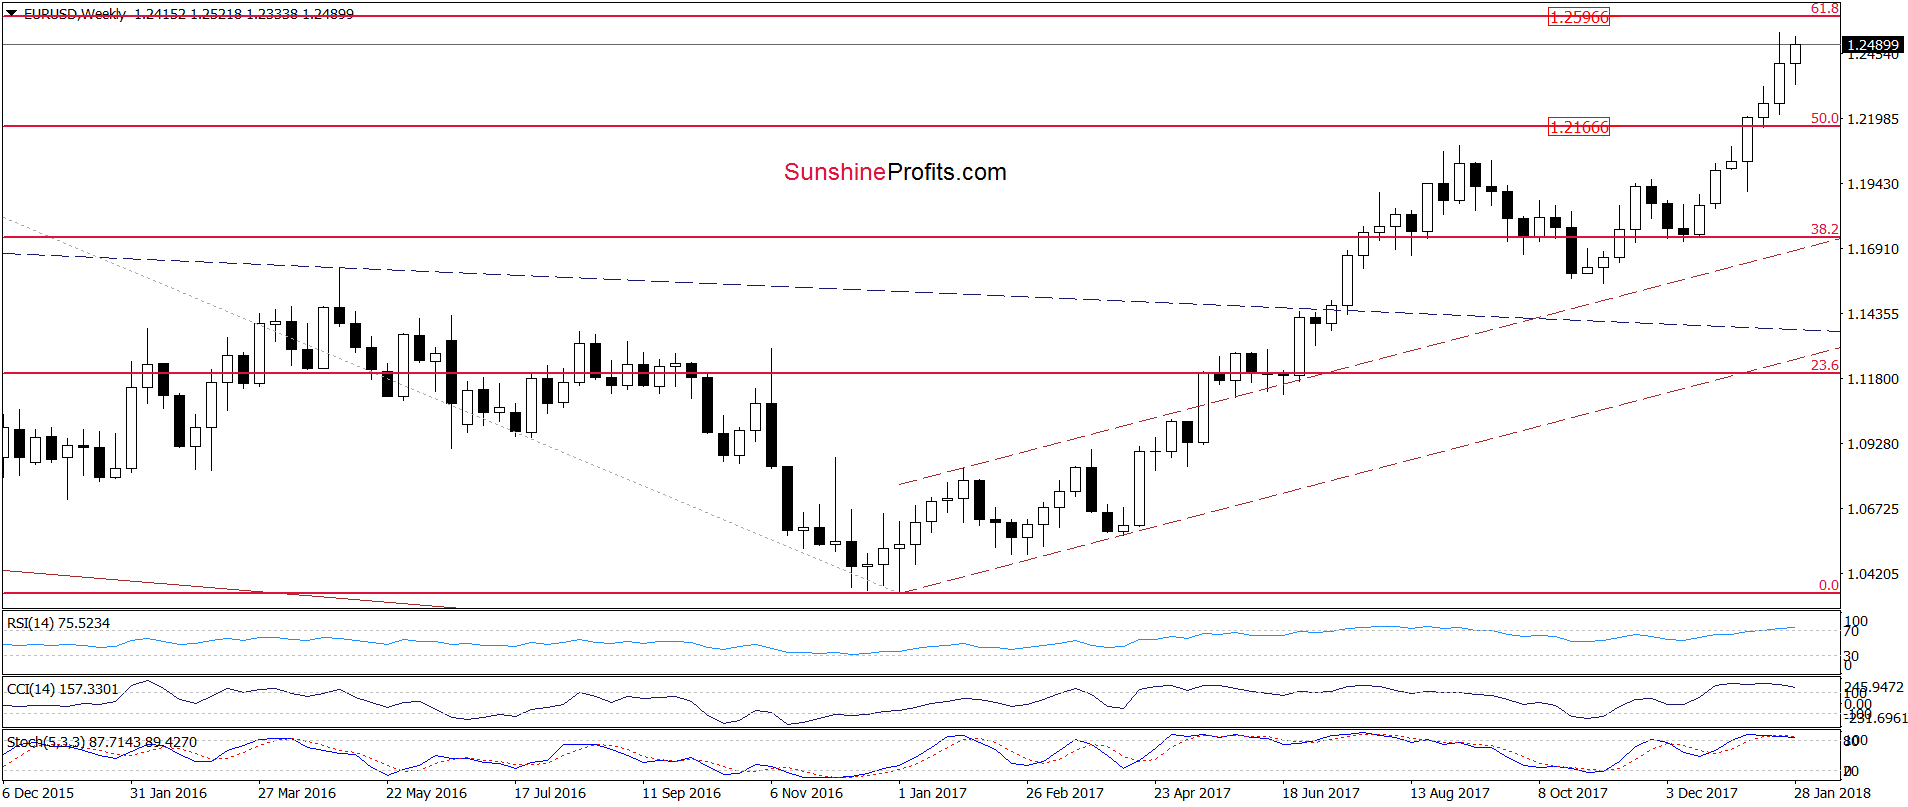
In our opinion, even if we see such price action, the space for gains seems limited as the 61.8% Fibonacci retracement marked on the weekly chart above is quite close from current levels.
Trading position (short-term; our opinion): Short positions (with a stop-loss order at 1.2806 and the initial downside target at 1.2186) are justified from the risk/reward perspective. We will keep you informed should anything change, or should we see a confirmation/invalidation of the above.
USD/JPY
In our last commentary on this currency pair, we wrote the following:
(…) the current position of the weekly and daily indicators (the latter generated the buy signals) suggests higher values of the exchange rate.
When can we expect a bigger move to the upside? In our opinion, it will be more likely and reliable if the pair invalidates the breakdown under the lower border of the blue declining trend channel. If we see such price action, we will likely open long positions.
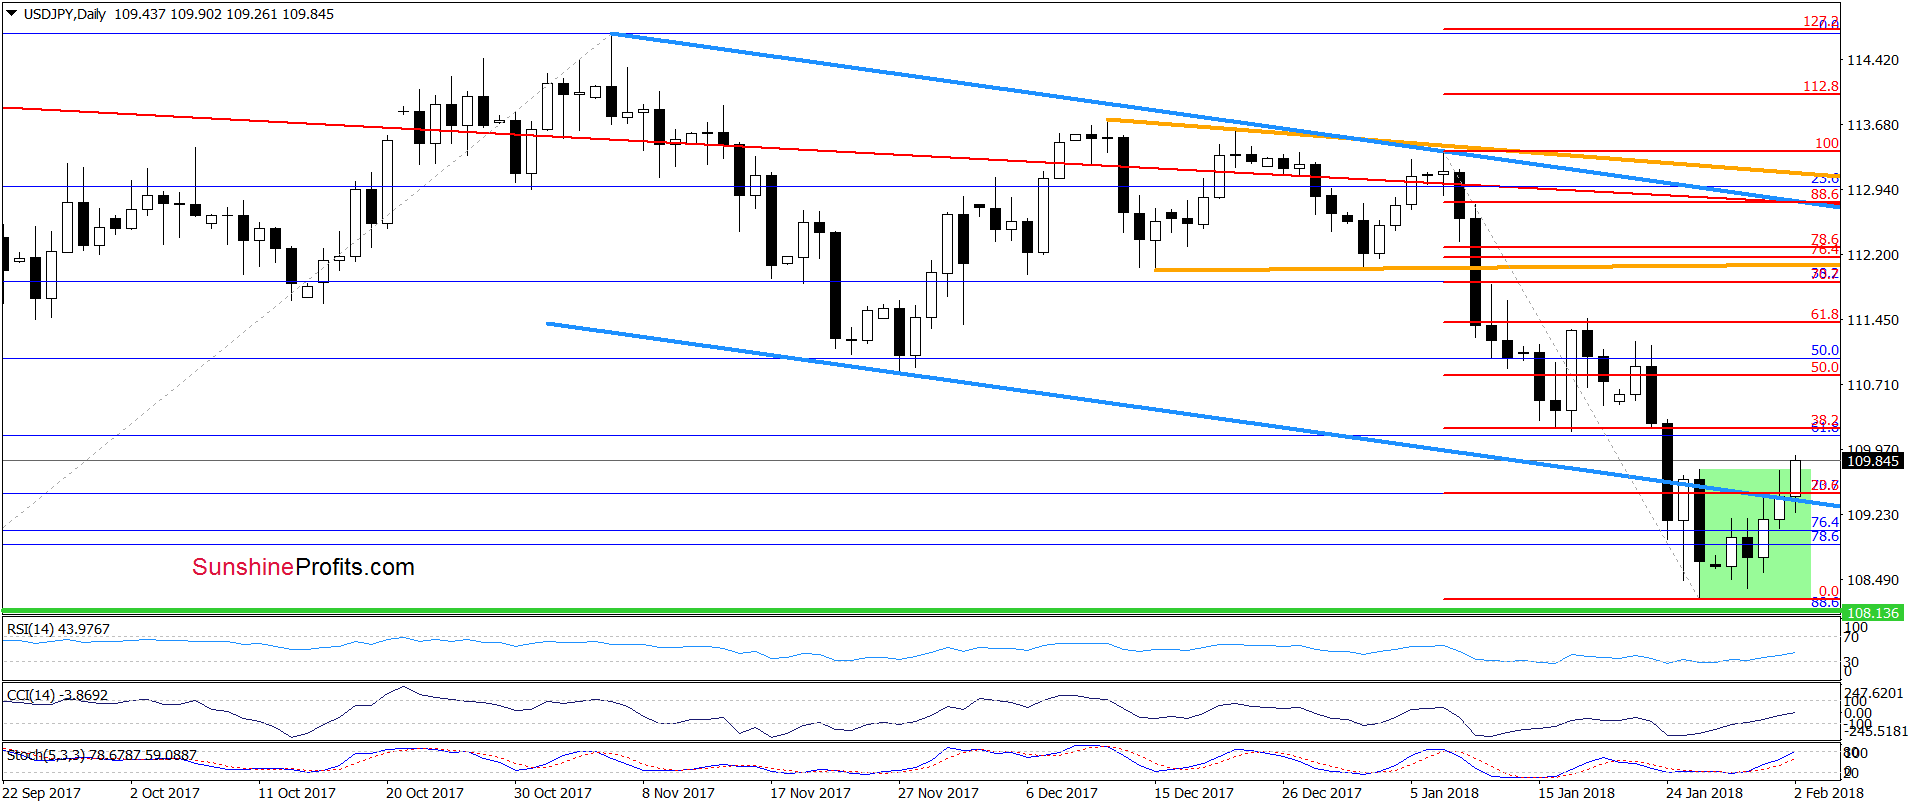
From today’s point of view, we see that the situation developed in line with the above scenario and USD/JPY moved visibly higher above the lower border of the blue declining trend channel earlier today.
Thanks to this move, the pair invalidated the earlier breakdown, which together with the buy signals generated by the indicators suggest further improvement in the coming days. Therefore, we think that opening long positions is justified from the risk/reward perspective now.
How high could the exchange rate go? In our opinion, the first upside target will be around 110.21, where the 38.2% Fibonacci retracement is. However, if this resistance is broken, we could see an increase even to around 111.33-111.43, where the mid-January highs and the 61.8% Fibonacci retracement are.
Trading position (short-term; our opinion): Long positions (with a stop-loss order at 107.82 and the initial upside target at 111.33) are justified from the risk/reward perspective now. We will keep you informed should anything change, or should we see a confirmation/invalidation of the above.
AUD/USD
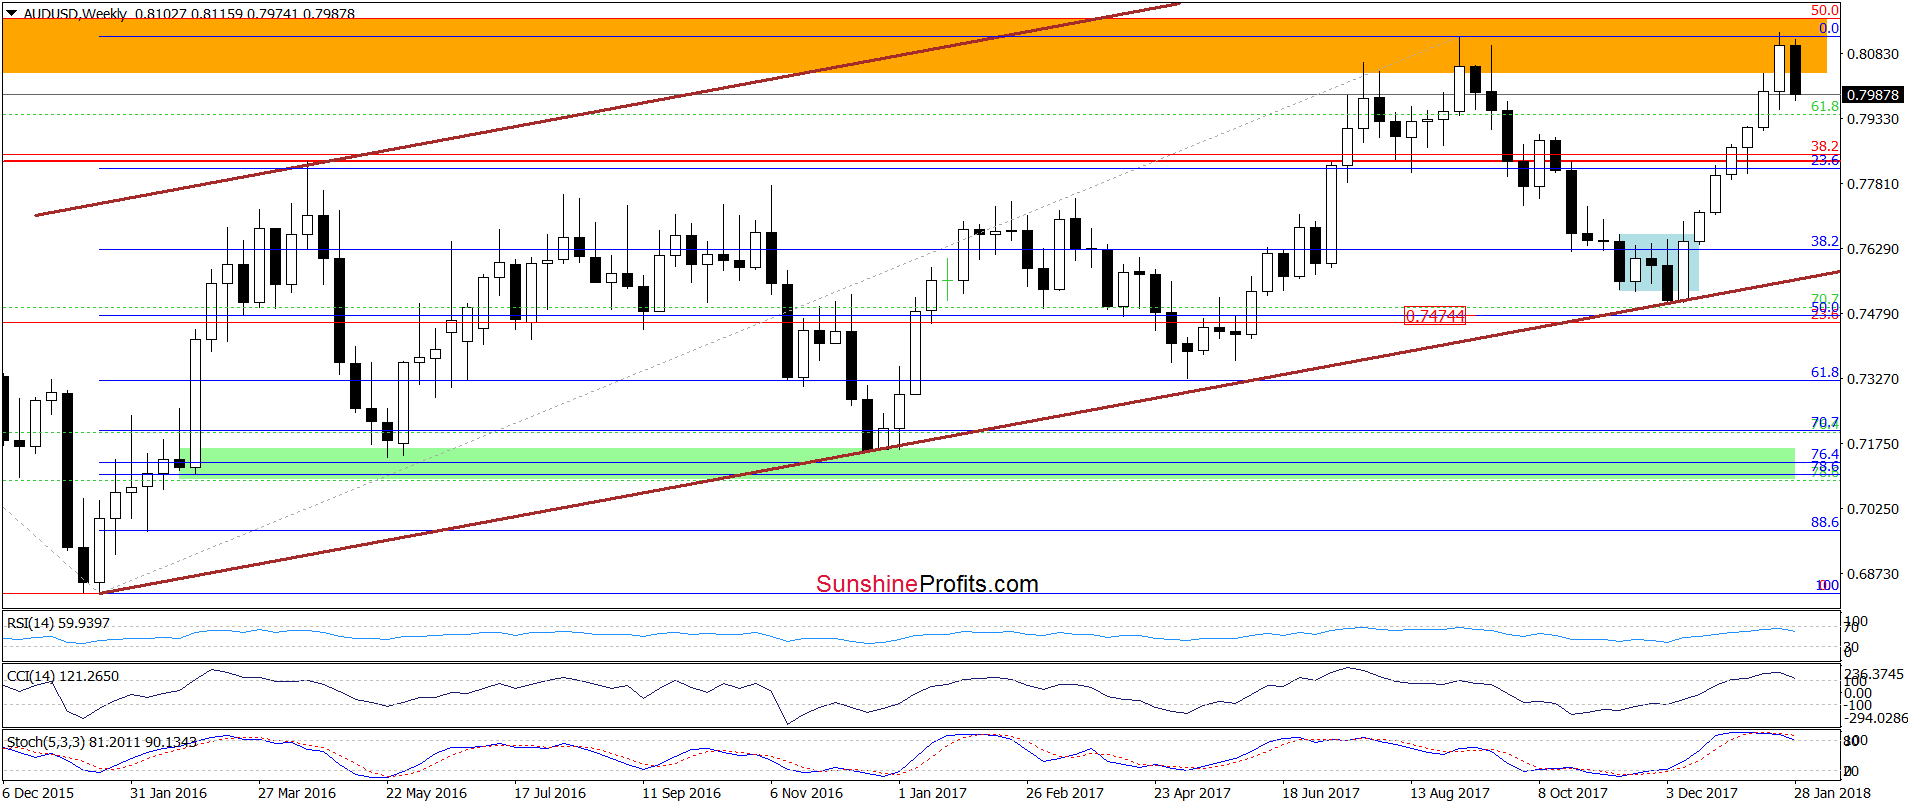
Looking at the weekly chart, we see that the orange resistance zone was strong enough to stop currency bulls once again earlier this week.
What impact did it have on the daily chart? Let’s check.
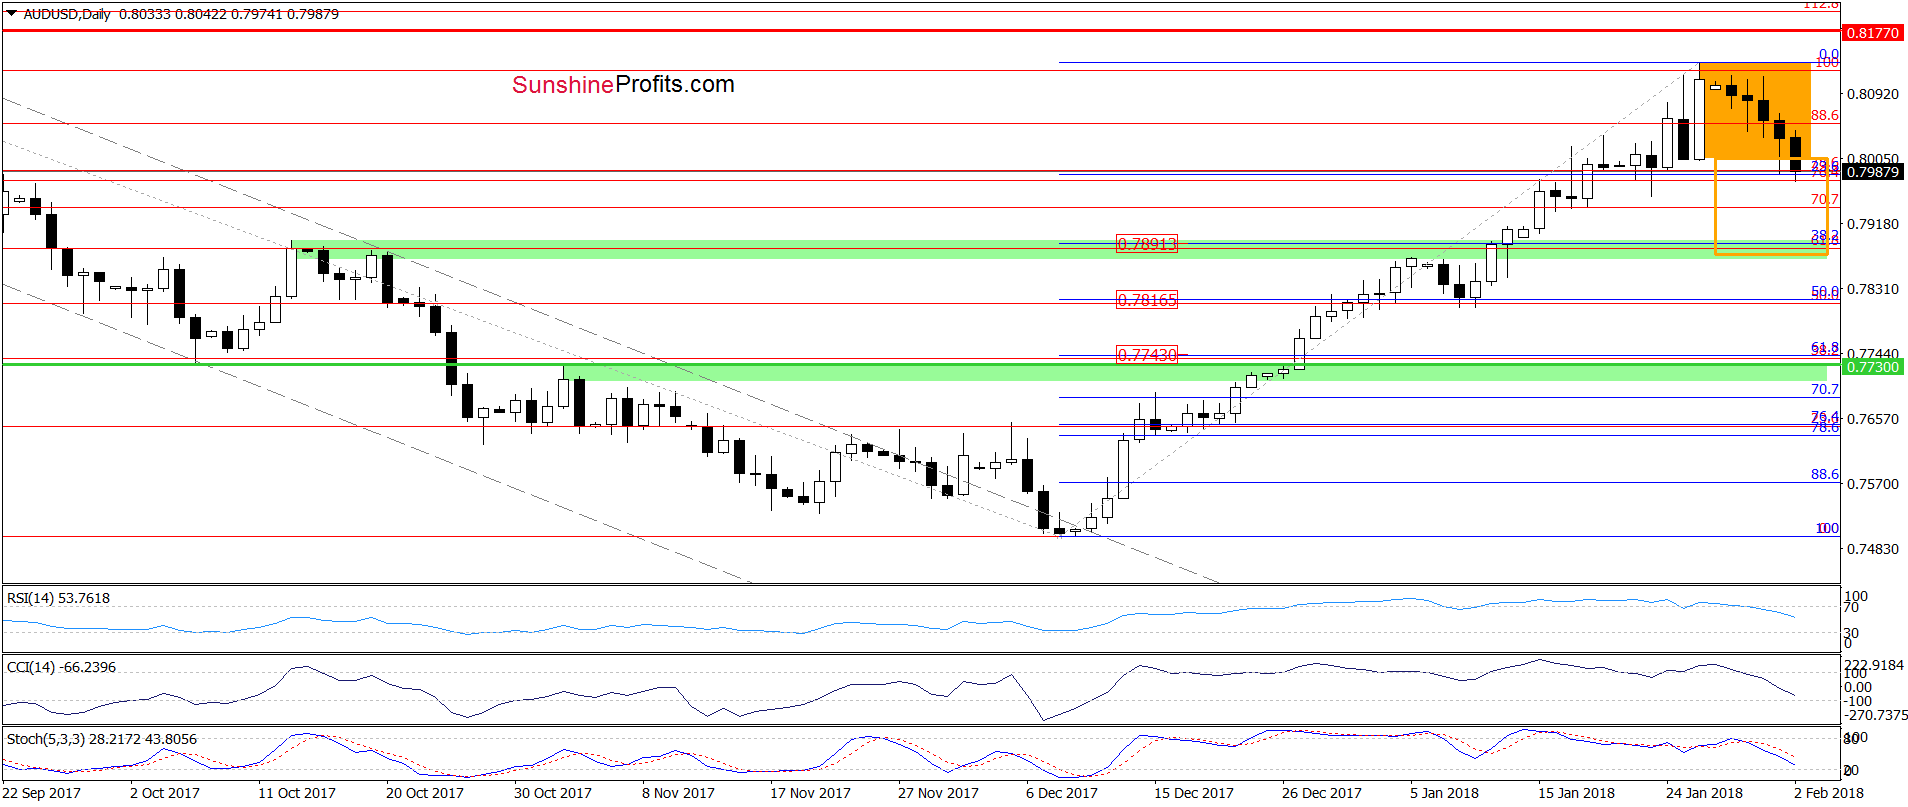
The first thing that catches the eye on the daily chart is the breakdown under the lower border of the orange consolidation. What does such price action mean for currency bears? In our opinion, further deterioration and a decline to (at least) around 0.7891, where the 38.2% Fibonacci retracement (based on the entire December-January upward move) is.
However, at this point, it is worth noting that slightly below this area the size of the downward move will correspond to the height of the above-mentioned consolidation, which could pause currency bears.
Trading position (short-term; our opinion): Short positions (with a stop-loss order at 0.8222 and the downside target at 0.7730) are justified from the risk/reward perspective now. We will keep you informed should anything change, or should we see a confirmation/invalidation of the above.
Thank you.
Nadia Simmons
Forex & Oil Trading Strategist
Przemyslaw Radomski, CFA
Founder, Editor-in-chief, Gold & Silver Fund Manager
Gold & Silver Trading Alerts
Forex Trading Alerts
Oil Investment Updates
Oil Trading Alerts

