

Mirror, mirror on the wall tell us what to looking for… Why do we start today's alert this way? Because on the one hand the Australian dollar hit a fresh low against its U.S. counterpart and tested the support area created by Fibonacci supports. On the other hand, sell signals generated by the indicators remain in the cards. What to do about it? We know.
In our opinion the following forex trading positions are justified - summary:
- EUR/USD: short (the stop-loss level at 1.186; the initial target price at 1.1203)
- GBP/USD: none
- USD/JPY: long (the stop-loss level at 107.78; the initial target price at 113.88)
- USD/CAD: none
- USD/CHF: none
- AUD/USD: none
EUR/USD
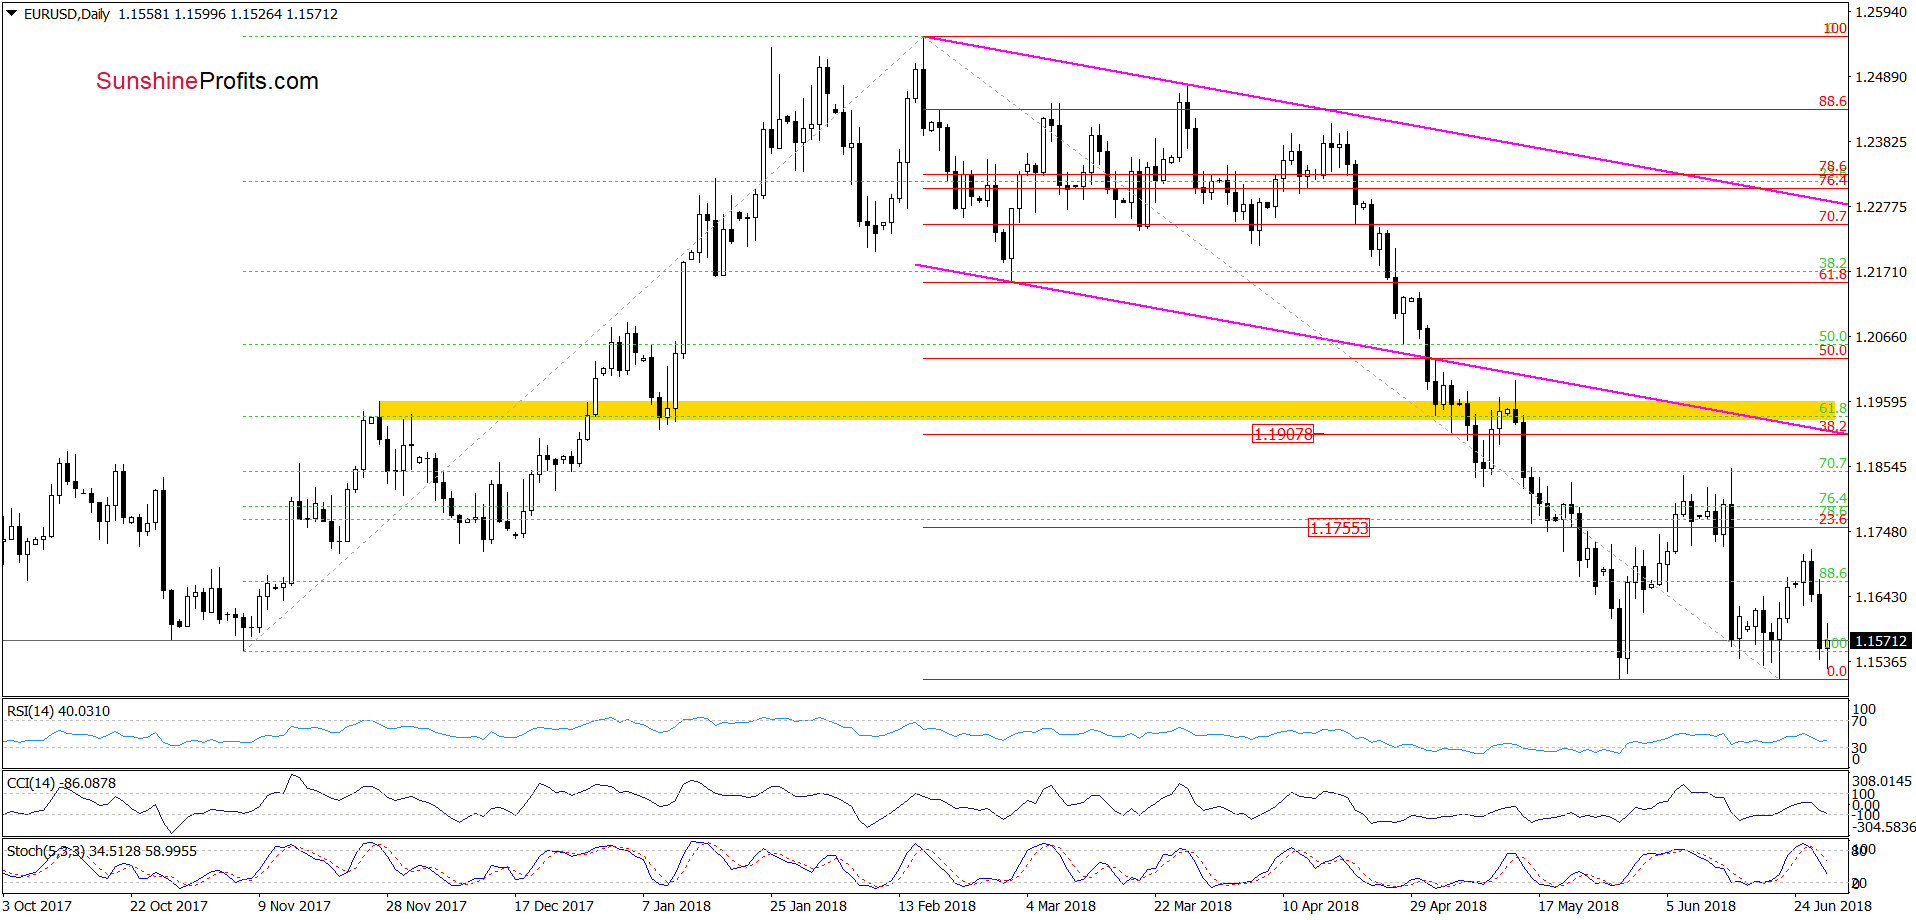
Earlier today, EUR/USD moved lower, but the support area created by the previous lows encouraged buyers to act, which resulted in a rebound in the following hours.
Does it change anything in the short term?
In our opinion, absolutely not. Why? Firstly, the sell signals generated by the indicators remain in the cards, supporting currency bears. Secondly, the size of the upswing is tiny compared to the downward move that we saw in the previous days, which doesn’t confirm currency bulls’ strength at the moment of writing this alert.
On top of that, there is one more very important factor, which favors the sellers. What do we mean by that? Let’s take a closer look at the weekly chart below.
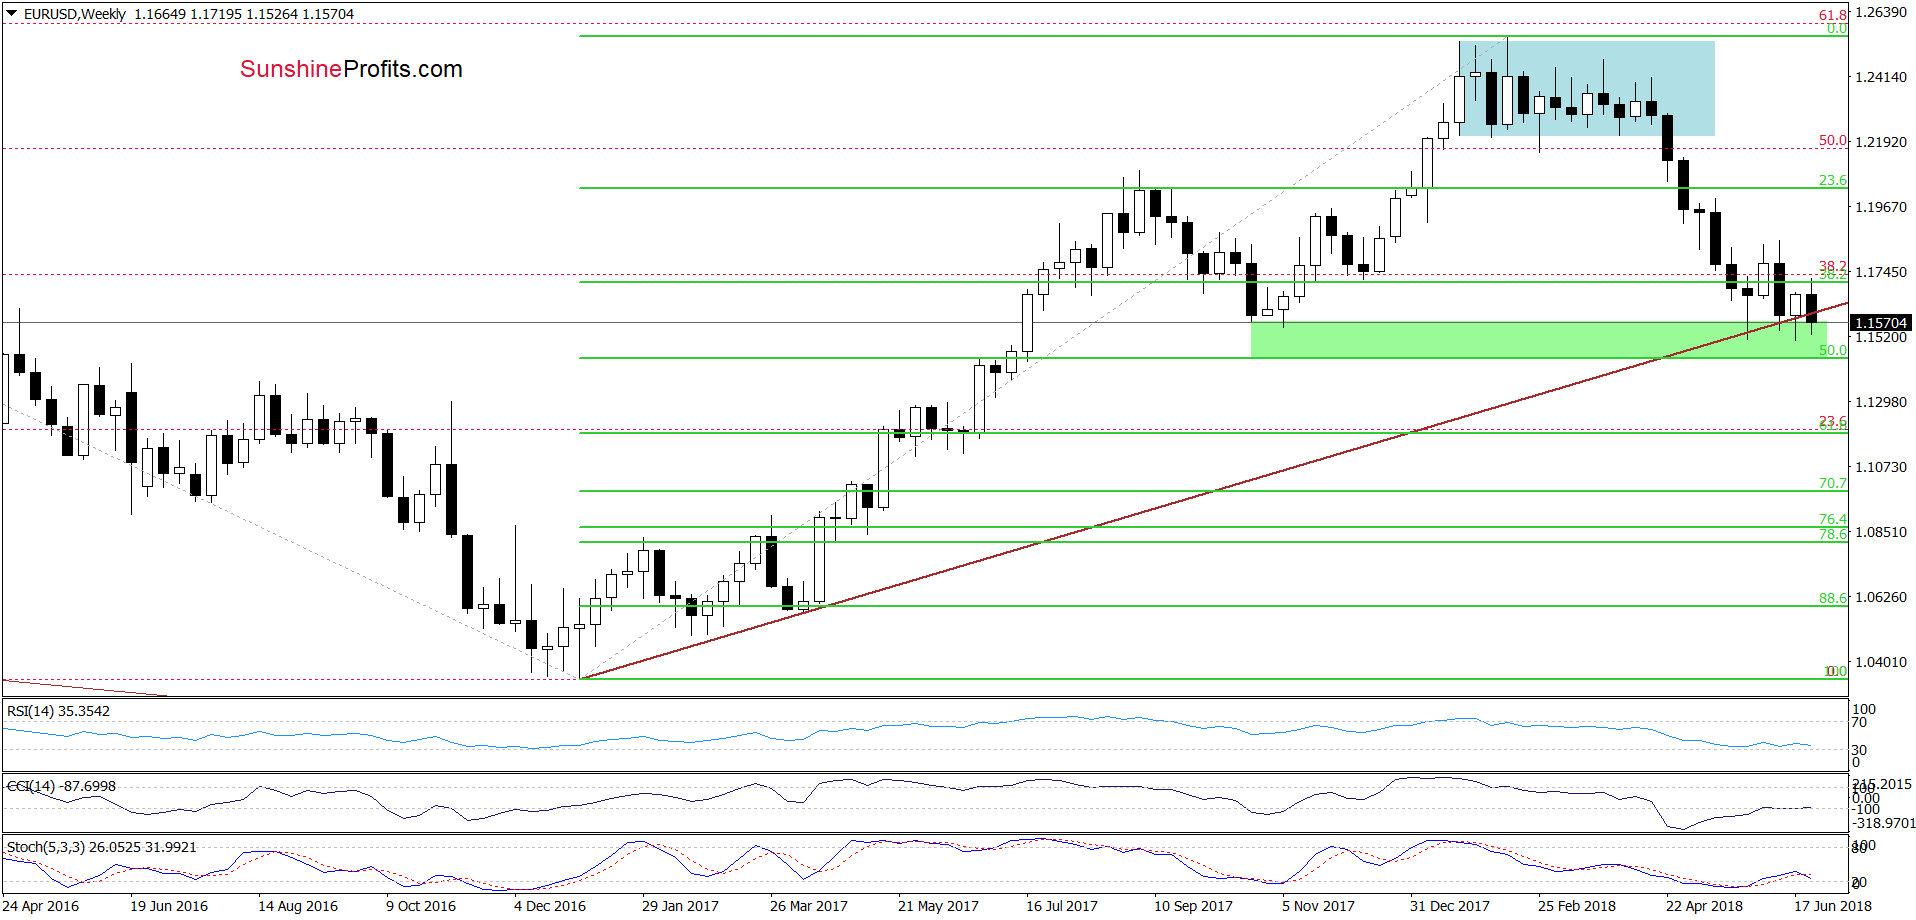
Before we analyze the medium-term picture, let’s recall what we wrote on Tuesday:
(…) the pair didn’t even manage to climb to the first Fibonacci retracement. Additionally, the Stochastic Oscillator is very close to generating a sell signal, which increases the probability that we’ll see a re-test of the long-term brown rising line seen on the weekly chart below (it serves as the nearest support at the moment of writing these words) in the coming day(s).
From today’s point of view, we see that the situation developed in line with the above scenario and EUR/USD extended losses. Nevertheless, as you see it became even more than this what we preliminarily assumed on Tuesday - the currency pair fell below the long-term brown line, which does not bode well for the demand side - especially if currency bears manage to close a week below this line.
What could happen if we see such price action? We think that the best answer to this question will be the quote from our yesterday’s alert:
(…) it is also worth noting that if we see a successful breakdown under this line (a weekly closure below it), the exchange rate will likely not only test the recent lows, but also move to the 50% Fibonacci retracement (around 1.1443) or even lower in the following days/weeks.
Trading position (short-term; our opinion): Short positions (with the stop-loss level at 1.186 and the initial target price at 1.1203) are justified from the risk/reward perspective. We will keep you informed should anything change, or should we see a confirmation/invalidation of the above.
USD/JPY
In our last commentary on this currency pair, we wrote the following:
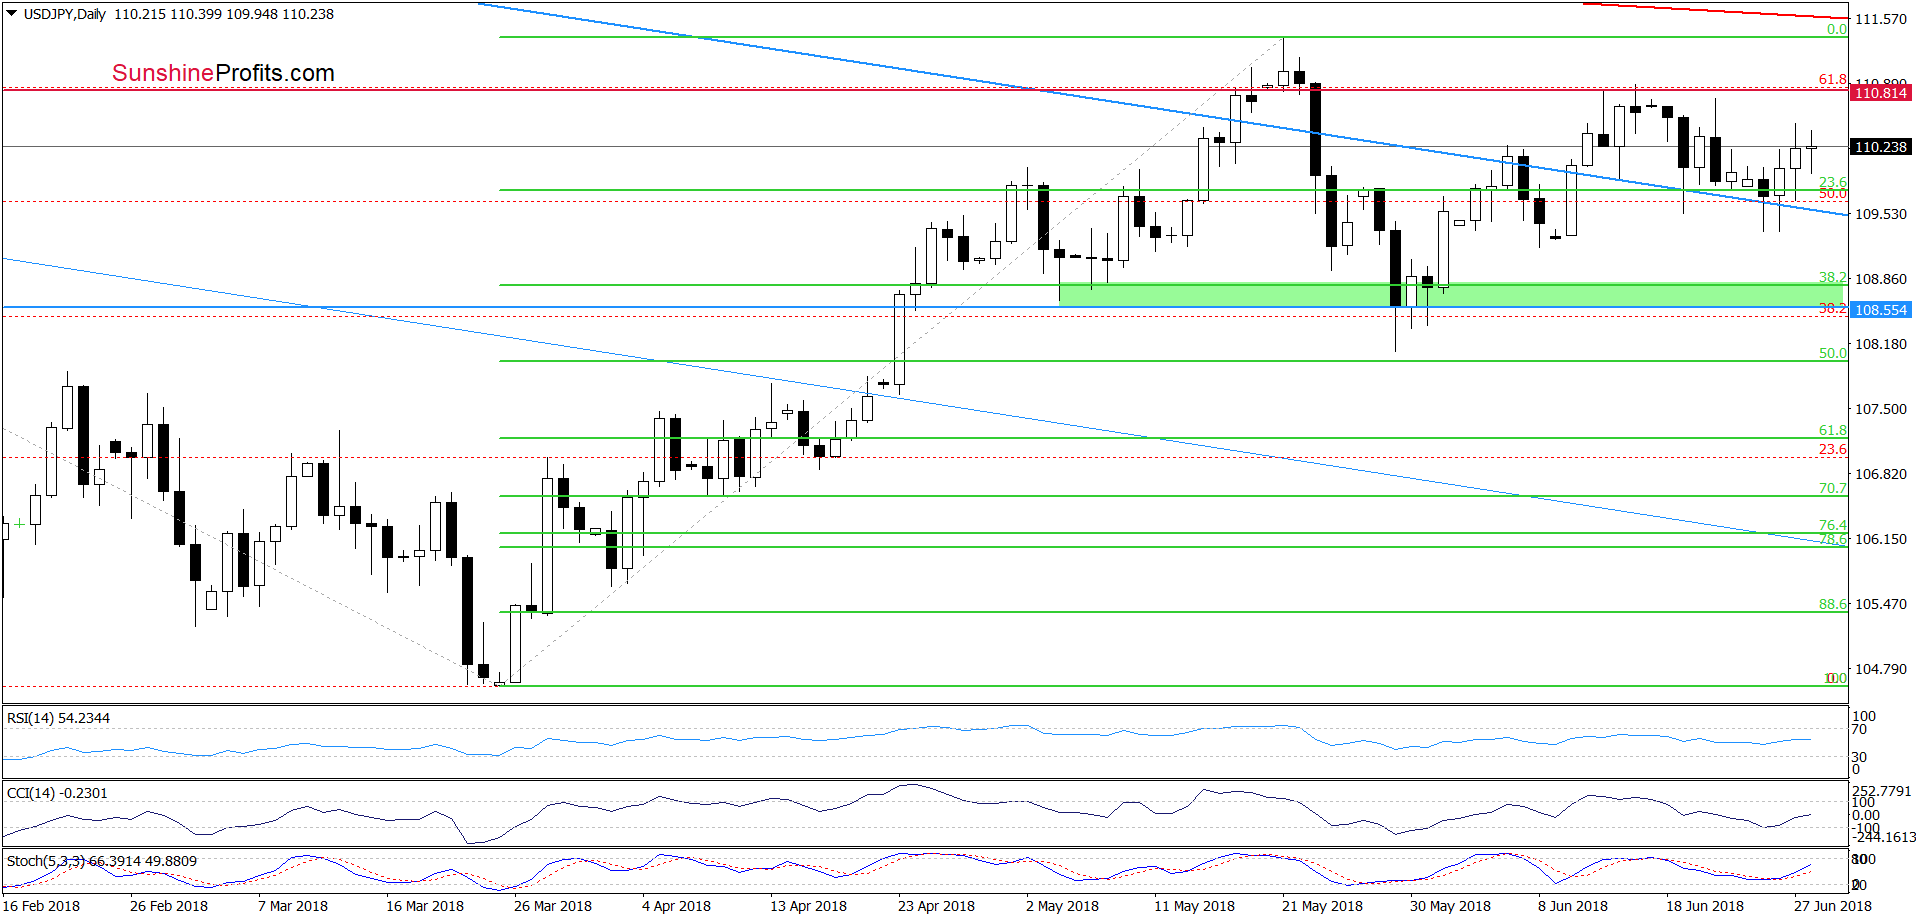
(…) currency bears pushed USD/JPY below the previously-broken upper border of the blue declining trend channel during yesterday’s session. Nevertheless (…) their opponents managed to stop them and trigger a rebound before the session closure. As a result, the exchange rate came back above this line, invalidating the breakdown.
Earlier today, we saw similar price action, but currency bulls didn’t fail once again and pushed the pair higher, which suggests that the buyers are quite active in this area. Additionally, the CCI and the Stochastic Oscillator dropped to their oversold zones, which increases the probability that we’ll see buy signals and higher values of USD/JPY in the following days.
Looking at the daily chart, we see that currency bulls pushed USD/JPY higher in recent days as we had expected. Additionally, the buy signals generated by the indicators continue to support the buyers, which suggests that we’ll see a realization of our Tuesday’s scenario in the coming days:
(…) the first upside target will be around 110.65-110.81, where the June peaks (in terms of daily closures and intraday highs) are.
Trading position (short-term; our opinion): Long positions (with the stop-loss level at 107.78; the initial target price at 113.88) are justified from the risk/reward perspective. We will keep you informed should anything change, or should we see a confirmation/invalidation of the above.
AUD/USD
Quoting our Tuesday’s Forex Trading Alert:
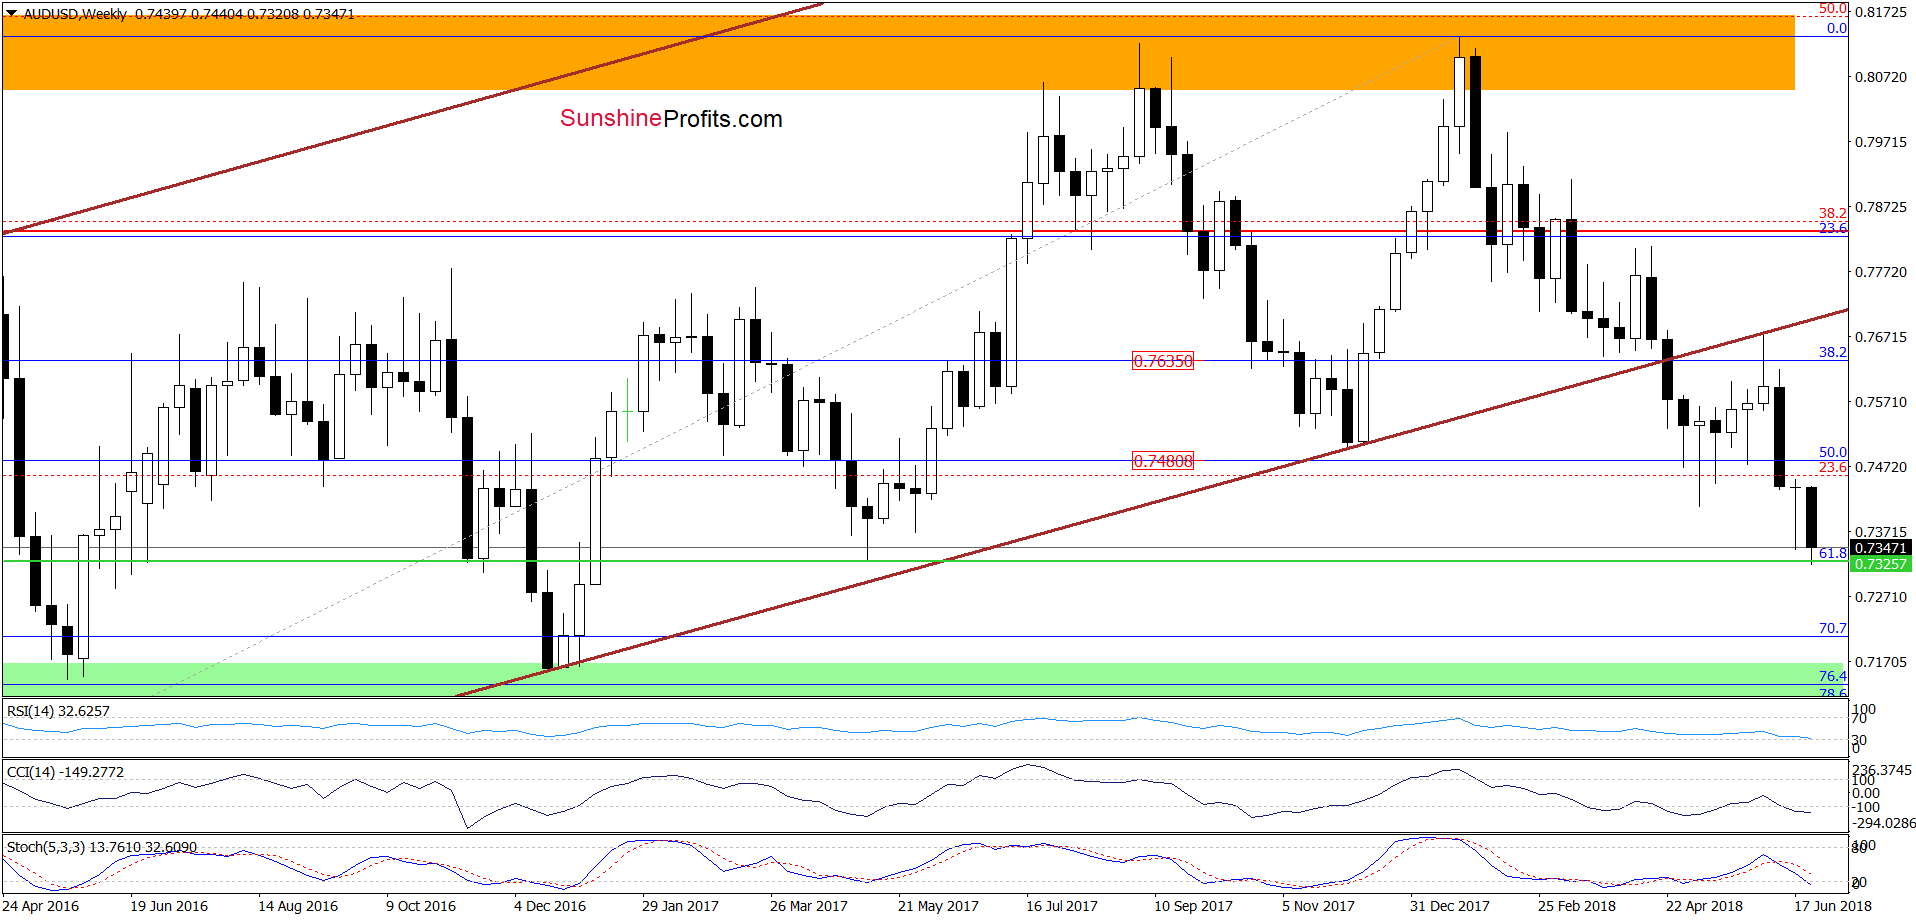
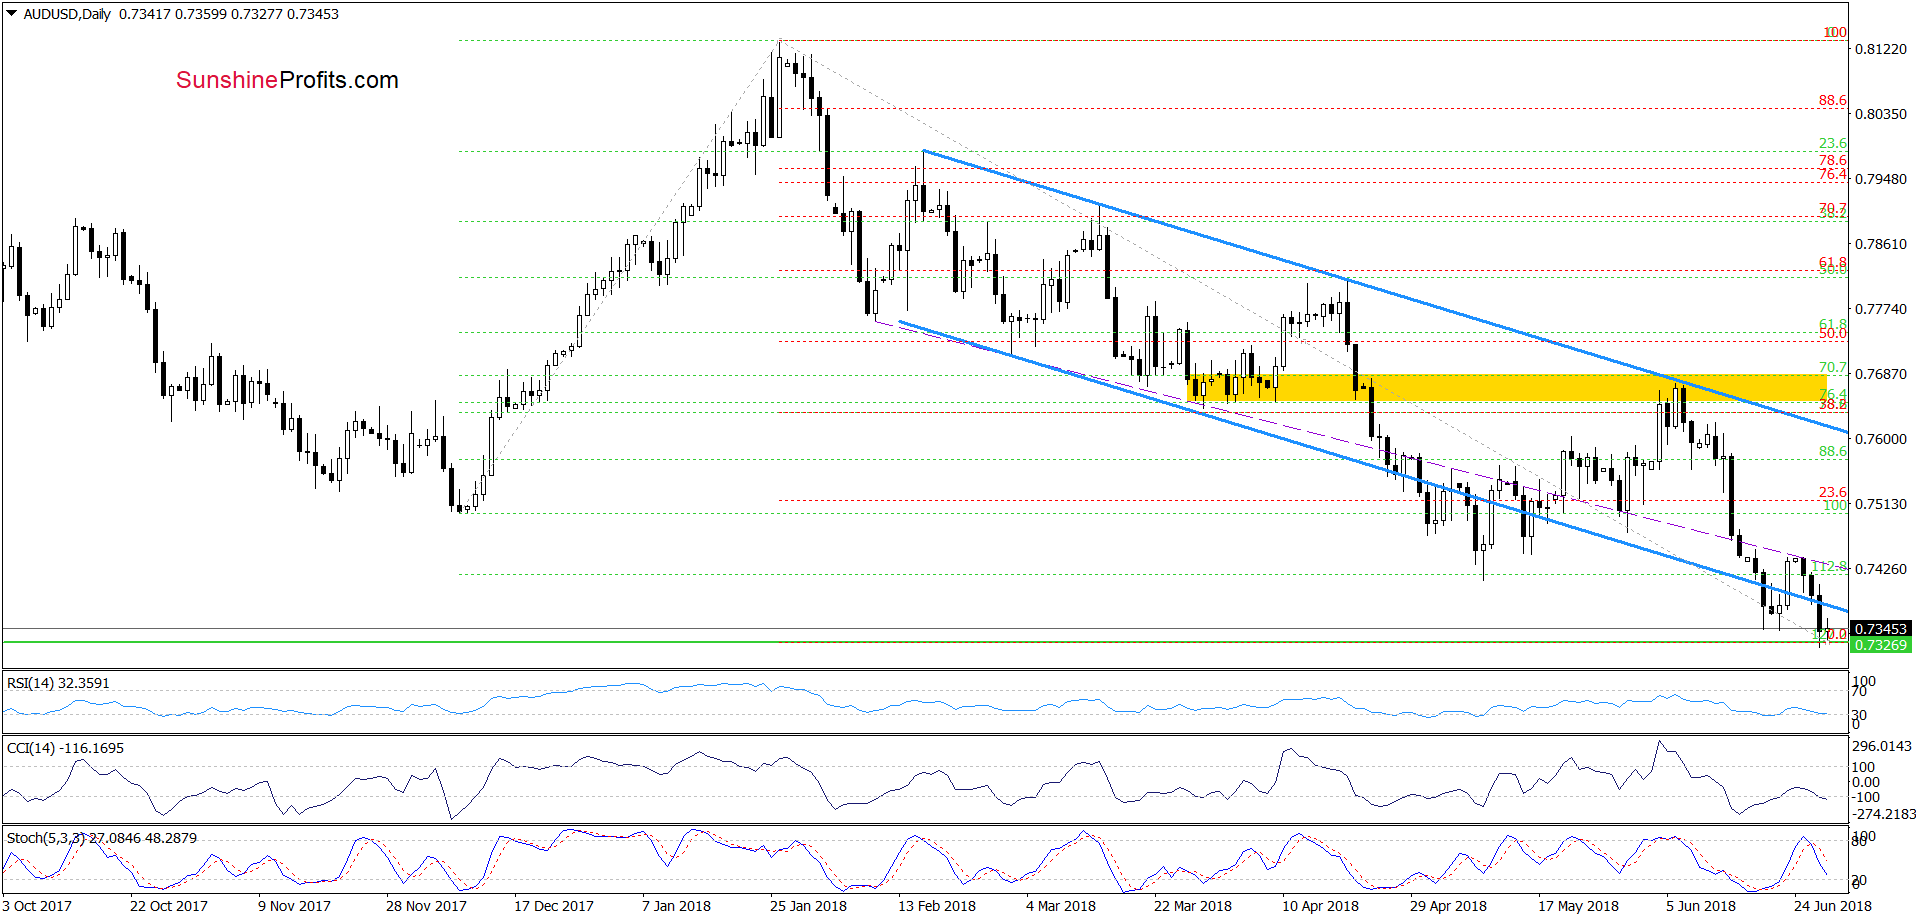
(…) the mid-June highs managed to stop currency bulls and further increases. Thanks to this price action the exchange rate came back to the previously-broken lower border of the blue declining trend channel.
Will we see a rebound from it? Well, in our opinion it’s quite doubtful – especially when we factor in the current position of the Stochastic Oscillator (it is very close to generating the sell signal). So, what does it potentially mean for AUD/USD?
In our opinion, further deterioration and a test of the 127.2% Fibonacci extension (the green horizontal line) in the following days.
As you see on the above chart, AUD/USD extended losses and tested our downside target during yesterday’s session. Additionally, the pair slipped to the 61.8% Fibonacci retracement marked on the weekly chart, which suggests that rebound from this area is very likely. Nevertheless, the sell signals generated by the daily and weekly indicators continue to support the sellers, making the overall picture a bit unclear.
So, what is the wisest thing to do in this situation? Abstain from opening any positions and stay out of the market until clearer hints of the next move appear. What could it be? In our opinion, a breakdown under yesterday’s lows or a comeback and invalidation of the breakdown under the lower border of the blue declining trend channel. If we see any of these price actions, we will consider opening the position and we will inform you immediately. So, let's stay in touch.
Trading position (short-term; our opinion): No positions are justified from the risk/reward perspective. We will keep you informed should anything change, or should we see a confirmation/invalidation of the above.
Thank you.
Nadia Simmons
Forex & Oil Trading Strategist
Przemyslaw Radomski, CFA
Founder, Editor-in-chief, Gold & Silver Fund Manager
Gold & Silver Trading Alerts
Forex Trading Alerts
Oil Investment Updates
Oil Trading Alerts

