

Although currency bulls came back above the upper border of the long-term declining trend channel, this improvement was very temporary for the second time in a row. This time the sellers didn’t give them a chance for another rebound and attacked during today's session. What can be the consequences of this move for the bulls in the coming days?
In our opinion the following forex trading positions are justified - summary:
- EUR/USD: short (a stop-loss order at 1.1878; the initial downside target at 1.1343)
- GBP/USD: none
- USD/JPY: long (a stop-loss order at 111.60; the next upside target at 113.45)
- USD/CAD: none
- USD/CHF: none
- AUD/USD: none
EUR/USD
Yesterday, we wrote the following:
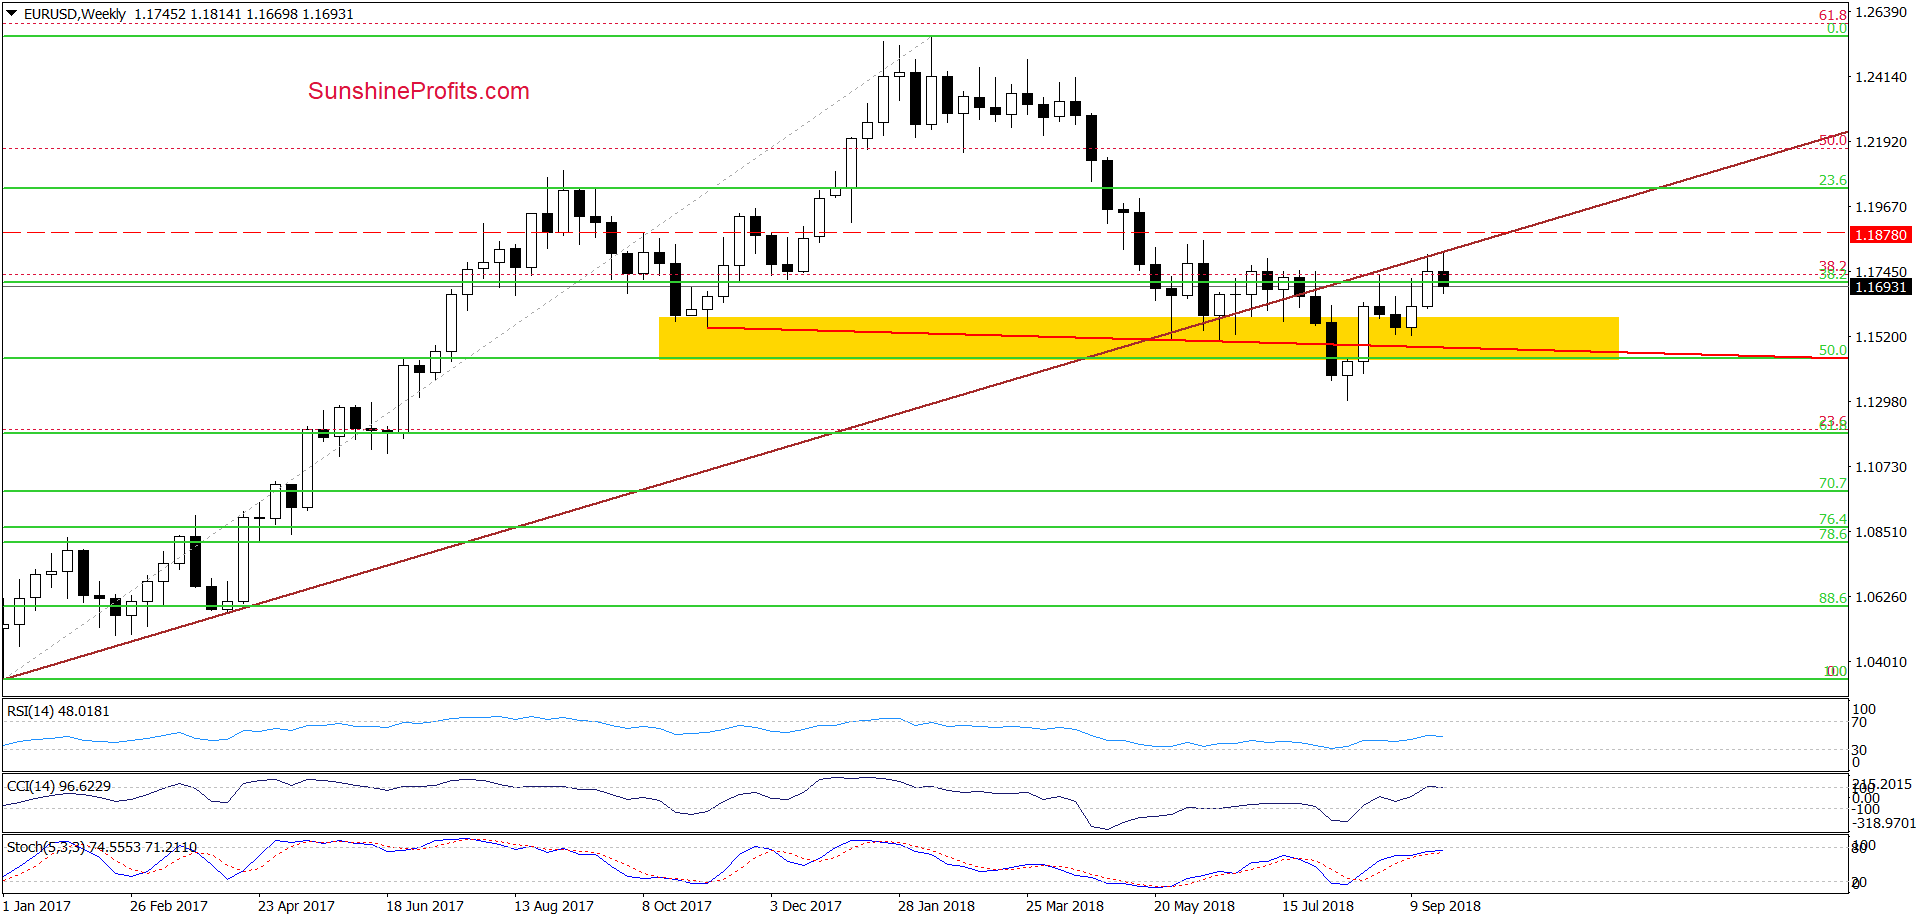
(…) although currency bulls tries to go higher since the beginning of the week, the combination of 4 important resistances (the previously-broken long-term brown line marked on the weekly chart, the 38.2% Fibonacci retracement based on the entire February-August downward move, the upper line of the pink resistance zone and the green resistance line based on the previous peaks) continues to keep gains in check.
Such price action increases the probability of a bigger move to the downside in the very near future – especially when we factor in the (…) current situation in the USD Index and the sell signals generated by the CCI and the Stochastic Oscillator before today’s U.S. market’s open.
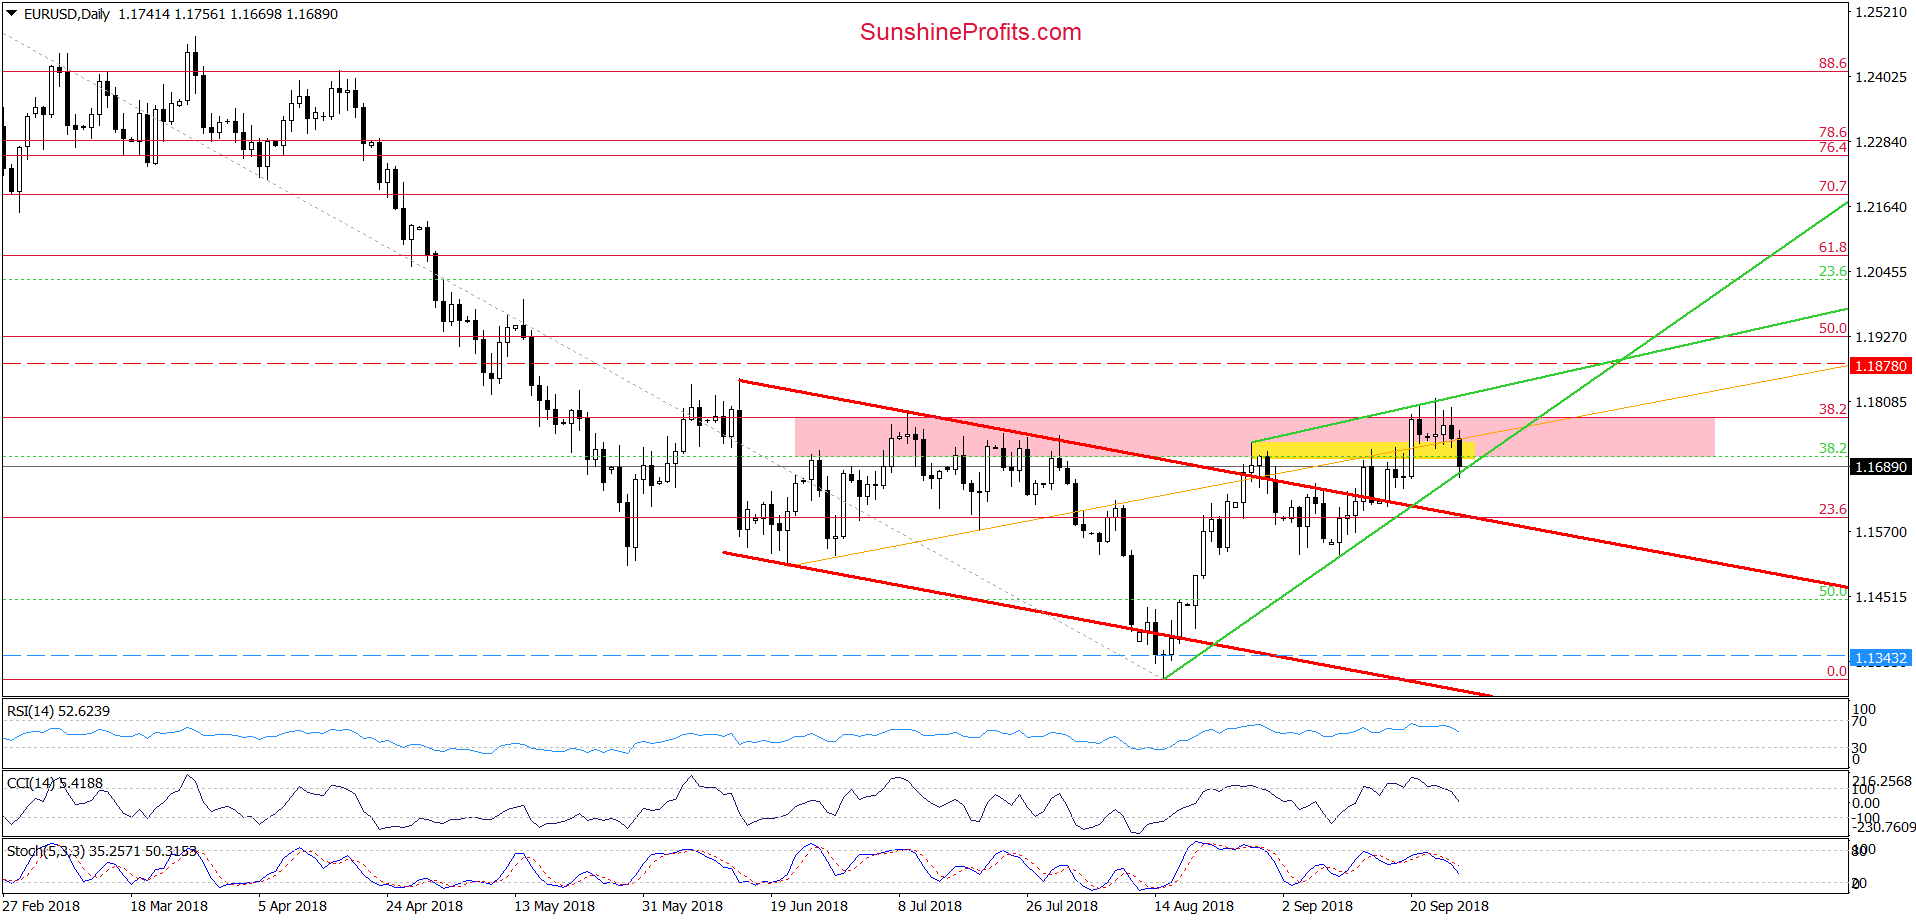
Earlier today, currency bears pushed EUR/USD quite sharply lower (as we had expected), which resulted in a drop to the first support – the green support line based on recent lows. Taking this fact into account, we believe that our yesterday’s comment remains up-to-date:
(…) we believe that lower values of the exchange rate are just around the corner and if the pair closes one of the upcoming sessions below the green support line based on previous lows, we’ll likely increase our short positions.
Trading position (short-term; our opinion): Short positions with a stop-loss order at 1.1878 and the initial downside target at 1.1343 are justified from the risk/reward perspective.
USD/CAD
In our last commentary on this currency pair, we wrote:
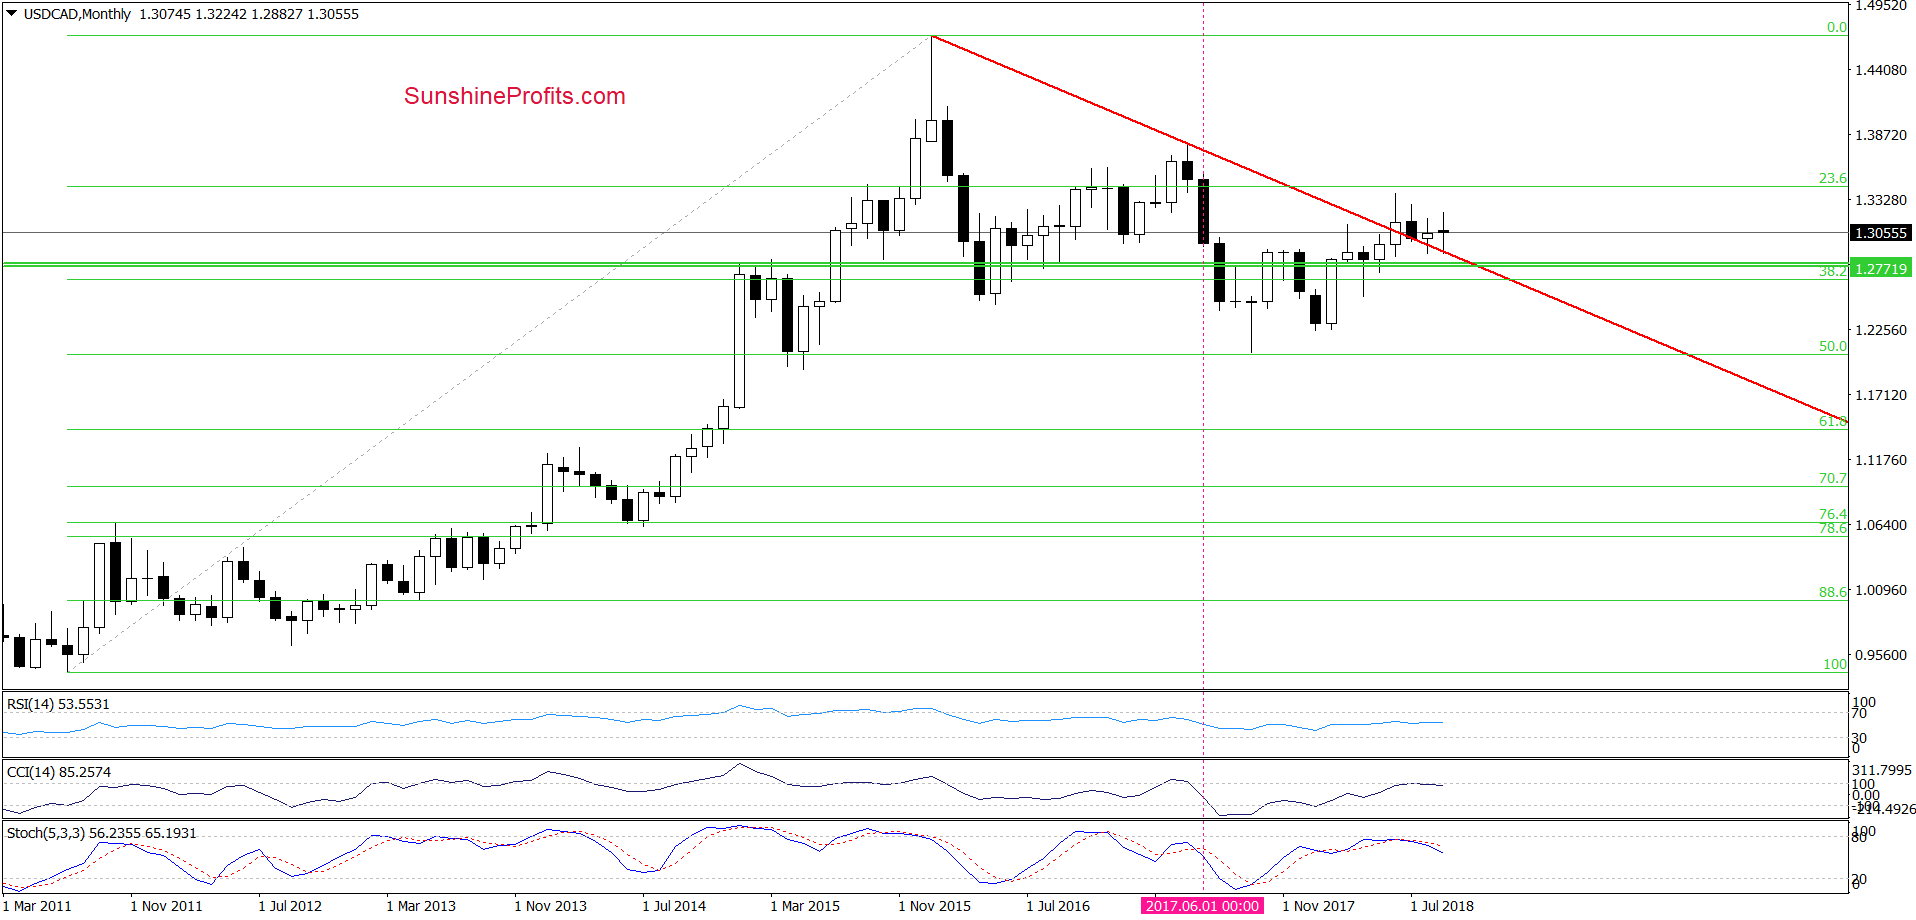
(…) Taking into account the current position of the daily indicators (the CCI and the Stochastic Oscillator), it seems that further improvement is just around the corner. Nevertheless, in our opinion, a pro-growth scenario (and a bigger move to the upside) will be more likely and reliable only if USD/CAD manage to break above the upper border of the red declining trend channel.
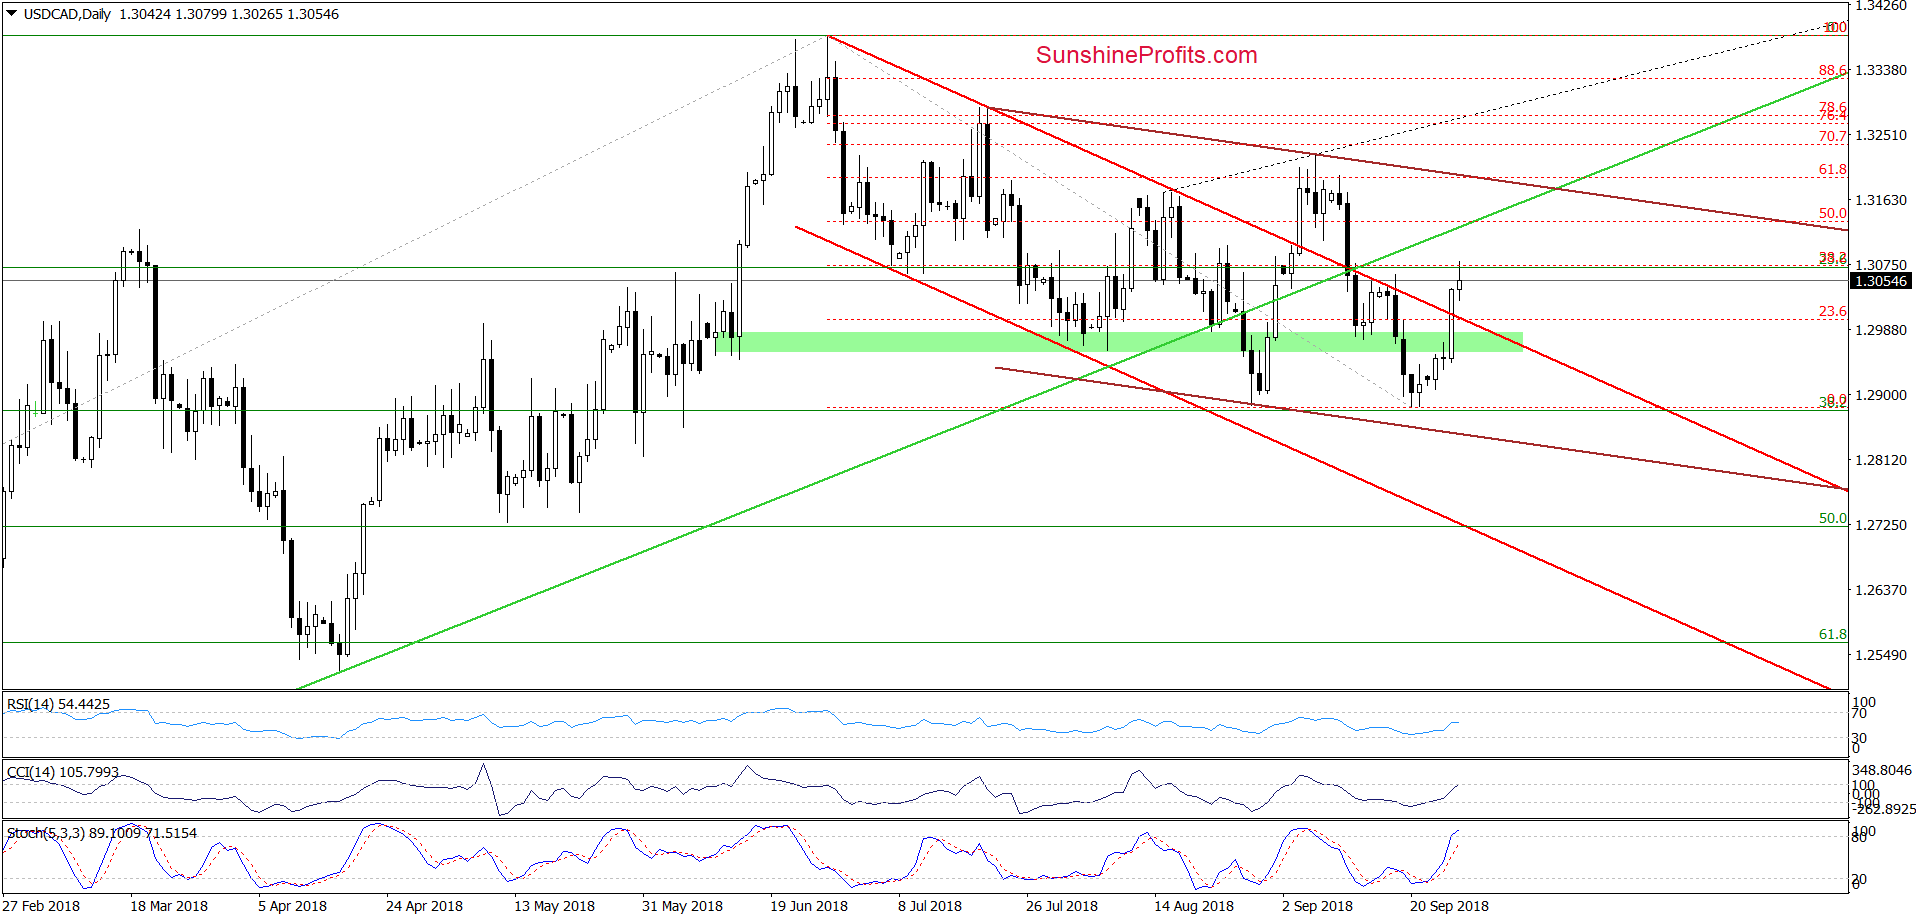
Looking at the daily chart, we see that currency bulls attacked during yesterday’s session, which resulted in a sharp upswing. As a result, the pair closed the day above the upper line of the red declining trend channel, invalidating the earlier breakdown.
Earlier today, we noticed further improvement and USD/CAD climbed to the 38.2% Fibonacci retracement based on the entire late-June-September declines, which could pause a bit currency bulls. Nevertheless, the buy signals generated by the daily indicators suggest that even if we see such price action, they will try to push higher once again in the following day(s).
If the situation develops in line with this assumption, the exchange rate will test the strength of the previously-broken long-term green line (based on the January and April lows) in the very near future.
Trading position (short-term; our opinion): No positions are justified from the risk/reward perspective. We will keep you informed should anything change, or should we see a confirmation/invalidation of the above.
AUD/USD
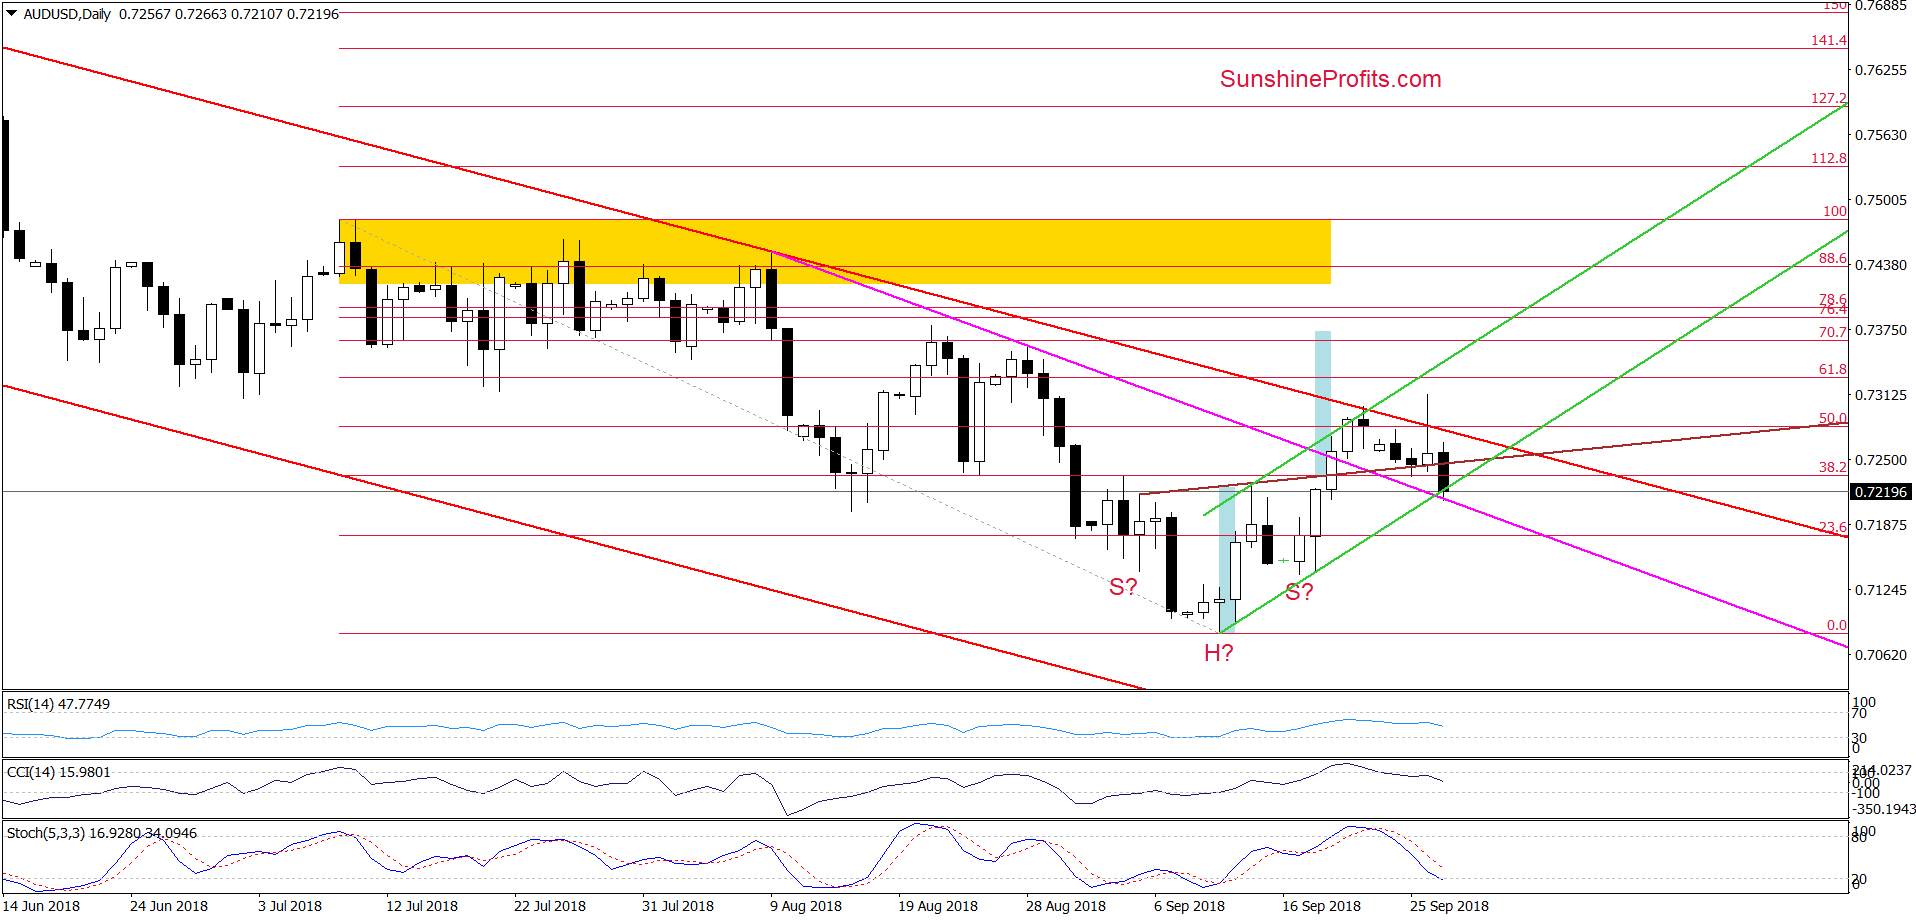
From today’s point of view, we see that although currency bulls bounced off the brown resistance line (a neck line of a reverse head and shoulders formation) and broke above the upper line of the red declining trend channel yesterday, this improvement was very temporary.
As a result, the exchange rate closed the day under the red line, invalidating the earlier small breakout. This negative development in combination with the sell signals generated by the daily indicators encouraged to act currency bears earlier today and AUD/USD slipped to the lower border of the very short-term green rising trend channel.
What’s next?
If the exchange rate closes today’s session under this line and the pink support line, the way to lower values of the exchange rate will be open. If we see such price action, we’ll consider opening short positions, because the pair will likely extend losses in the following days (maybe even test the green support zone marked on the weekly chart). We will keep you informed should anything change, or should we see a confirmation/invalidation of the above.
Trading position (short-term; our opinion): No positions are justified from the risk/reward perspective.
Thank you.
Nadia Simmons
Forex & Oil Trading Strategist
Przemyslaw Radomski, CFA
Founder, Editor-in-chief, Gold & Silver Fund Manager
Gold & Silver Trading Alerts
Forex Trading Alerts
Oil Investment Updates
Oil Trading Alerts

