

Earlier today, the Australian dollar increased against its U.S. counterpart, which pushed AUD/USD above the upper line of the declining trend channel. Will currency bulls fail as at the turn of November and December? Or maybe there are technical factors that they can use to win with their opponents this time….
In our opinion the following forex trading positions are justified - summary:
- EUR/USD: short (a stop-loss order at 1.2250; the initial downside target at 1.1510)
- GBP/USD: short (a stop-loss order at 1.3773; the next downside target at 1.3000)
- USD/JPY: none
- USD/CAD: none
- USD/CHF: none
- AUD/USD: none
EUR/USD
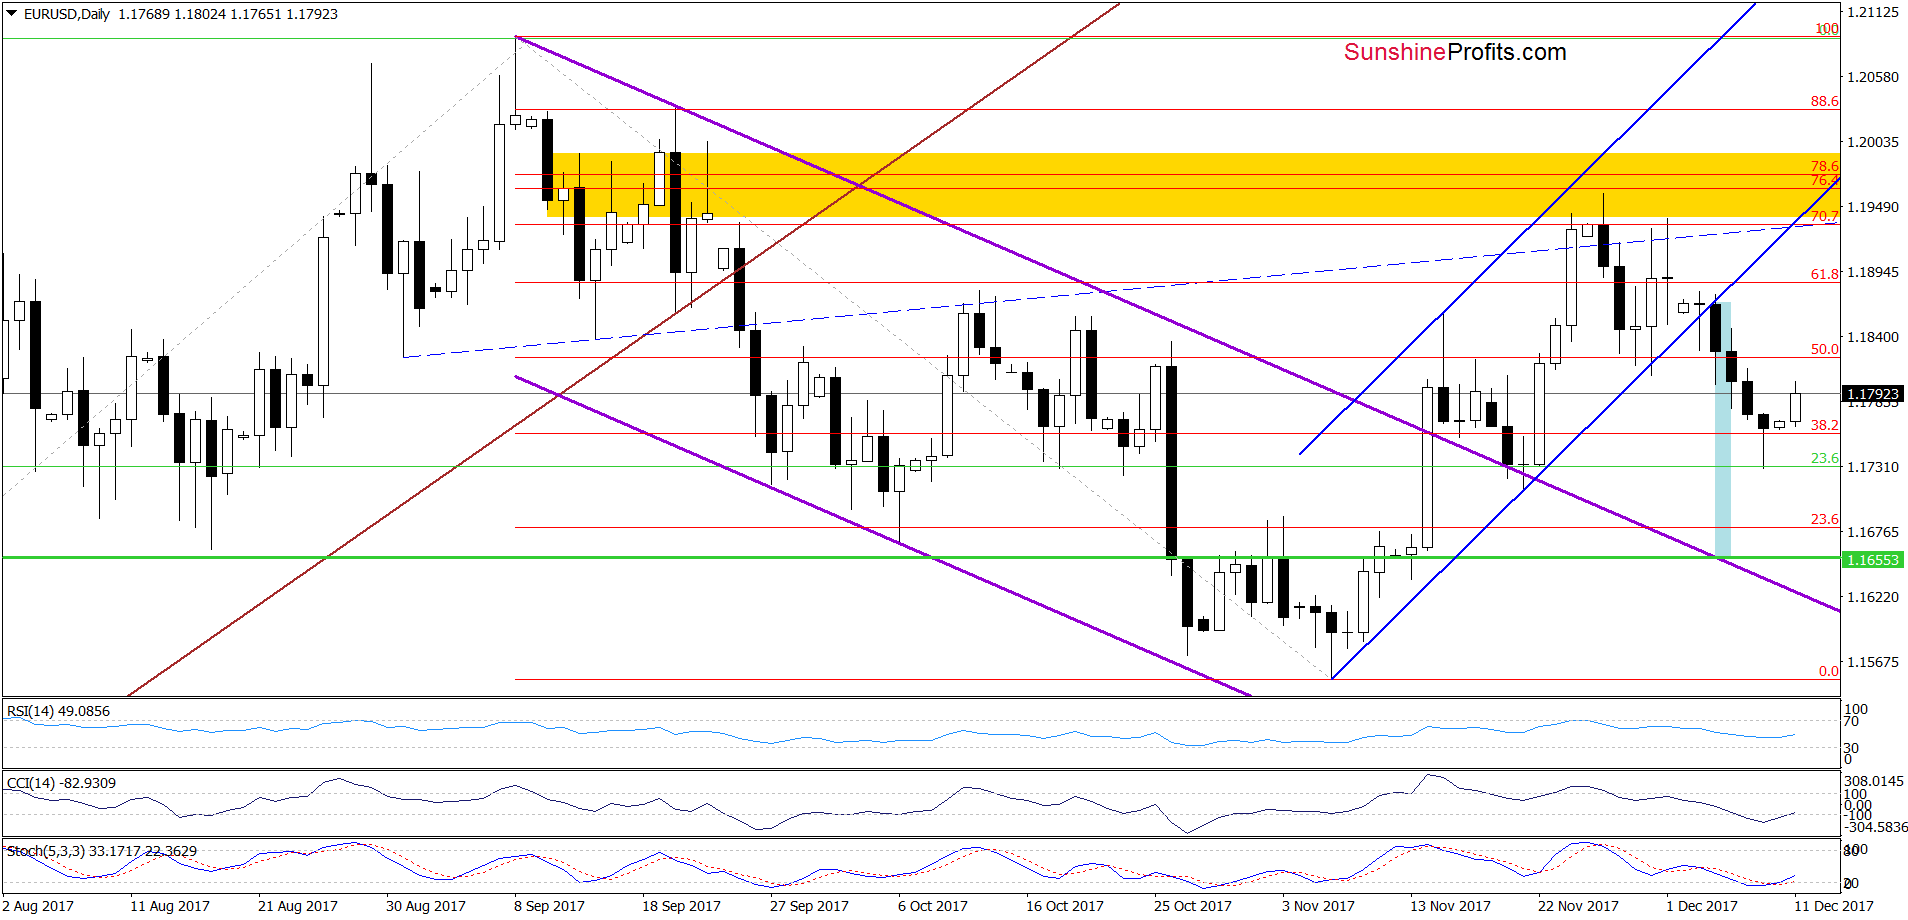
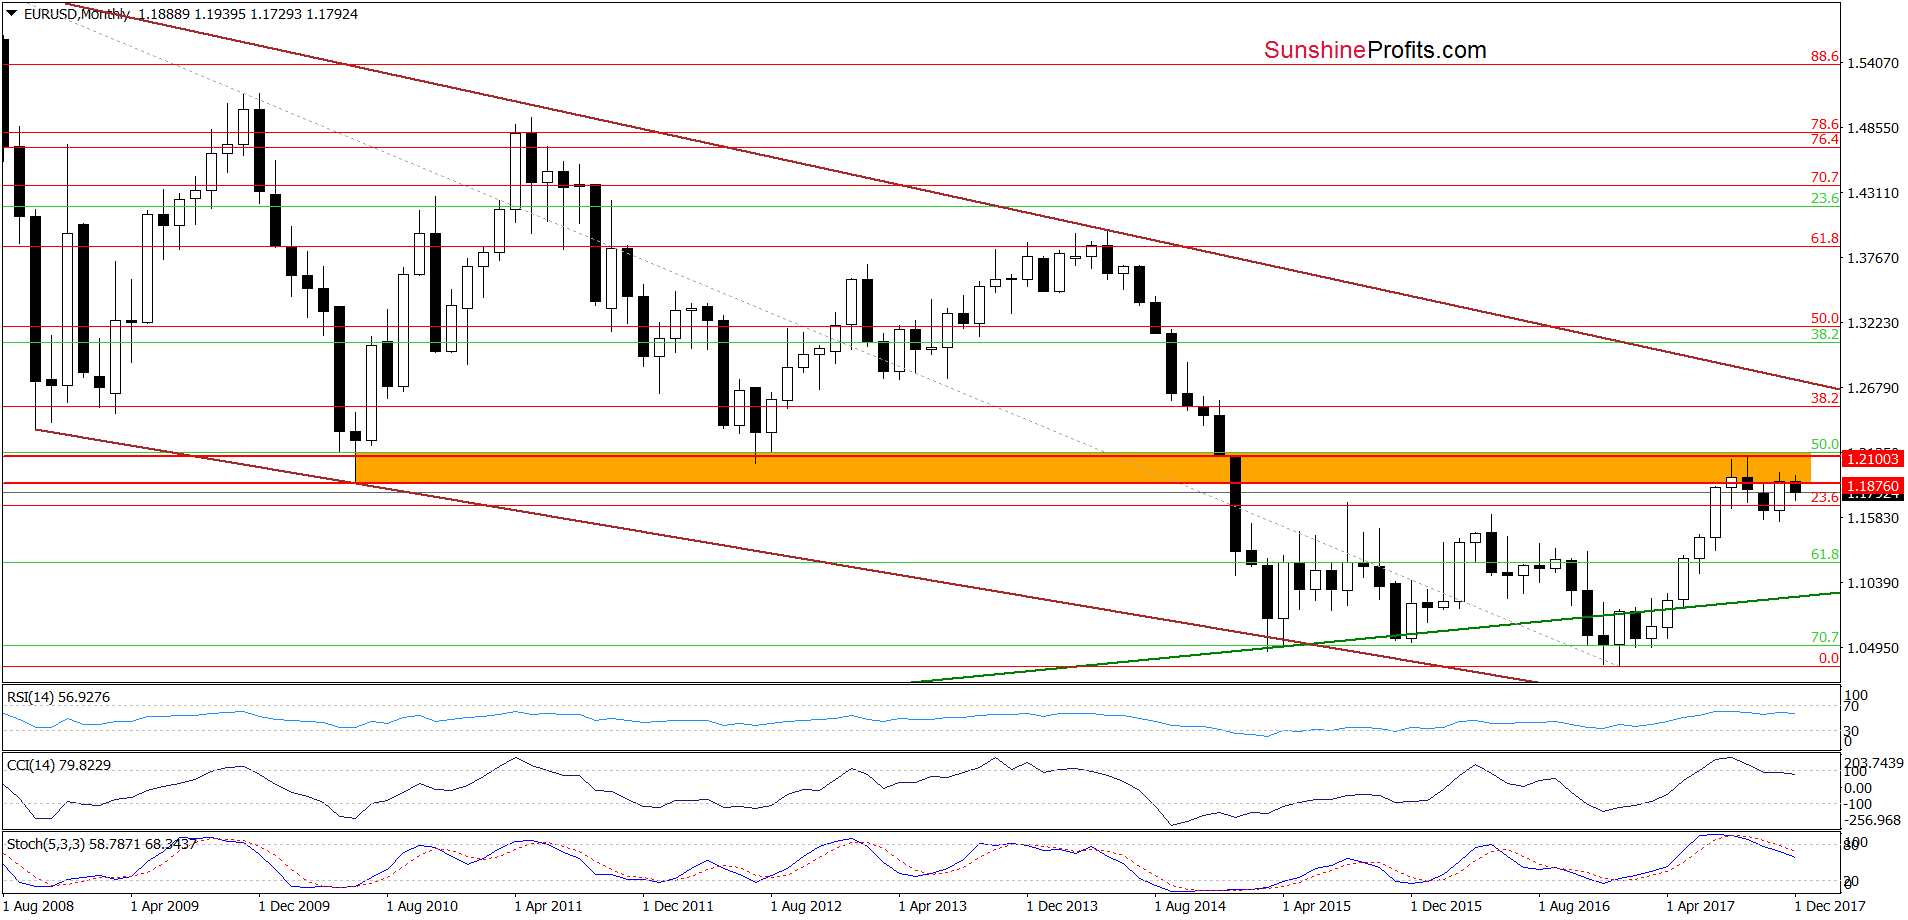
Looking at the daily chart, we see that although EUR/USD rebounded, it is still well below the previously-broken lower border of the blue rising trend channel. The current position of the daily indicators suggests that we may see further improvement in the short term, but the long-term indicators (seen on the monthly chart below) continue to support currency bears and indicate lower values of the exchange rate.
Additionally, the orange resistance zone is still blocking the way to higher levels.
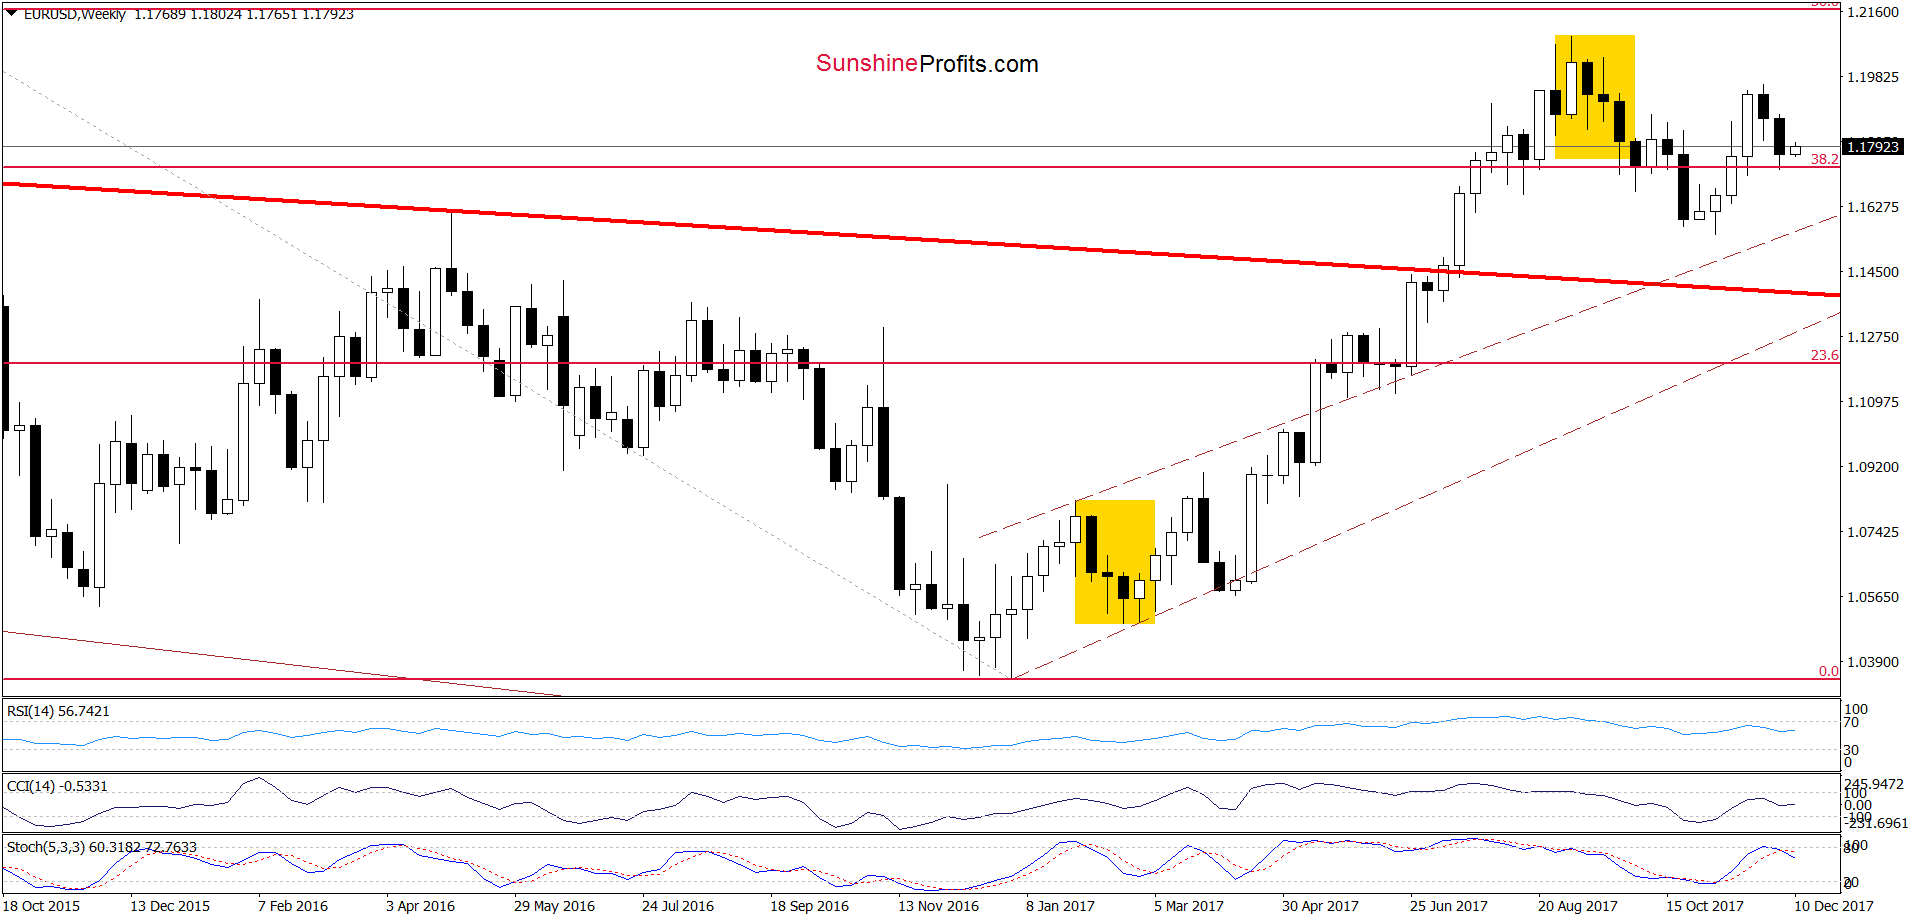
On top of that, the weekly Stochastic Oscillator generated the sell signals, increasing the probability of declines in the coming week. Therefore, in our opinion, as long as there is no invalidation of the breakdown under the lower border of the blur rising trend channel, a bigger move to the downside is very likely.
If this is the case and the exchange rate breaks under the last week’s low, the next target will be around 1.1660, where the size of the downward move will correspond to the height of the blue rising trend channel.
Trading position (short-term; our opinion): profitable short positions (with a stop-loss order at 1.2250 and the initial downside target at 1.1510) are justified from the risk/reward perspective. We will keep you informed should anything change, or should we see a confirmation/invalidation of the above.
GBP/USD
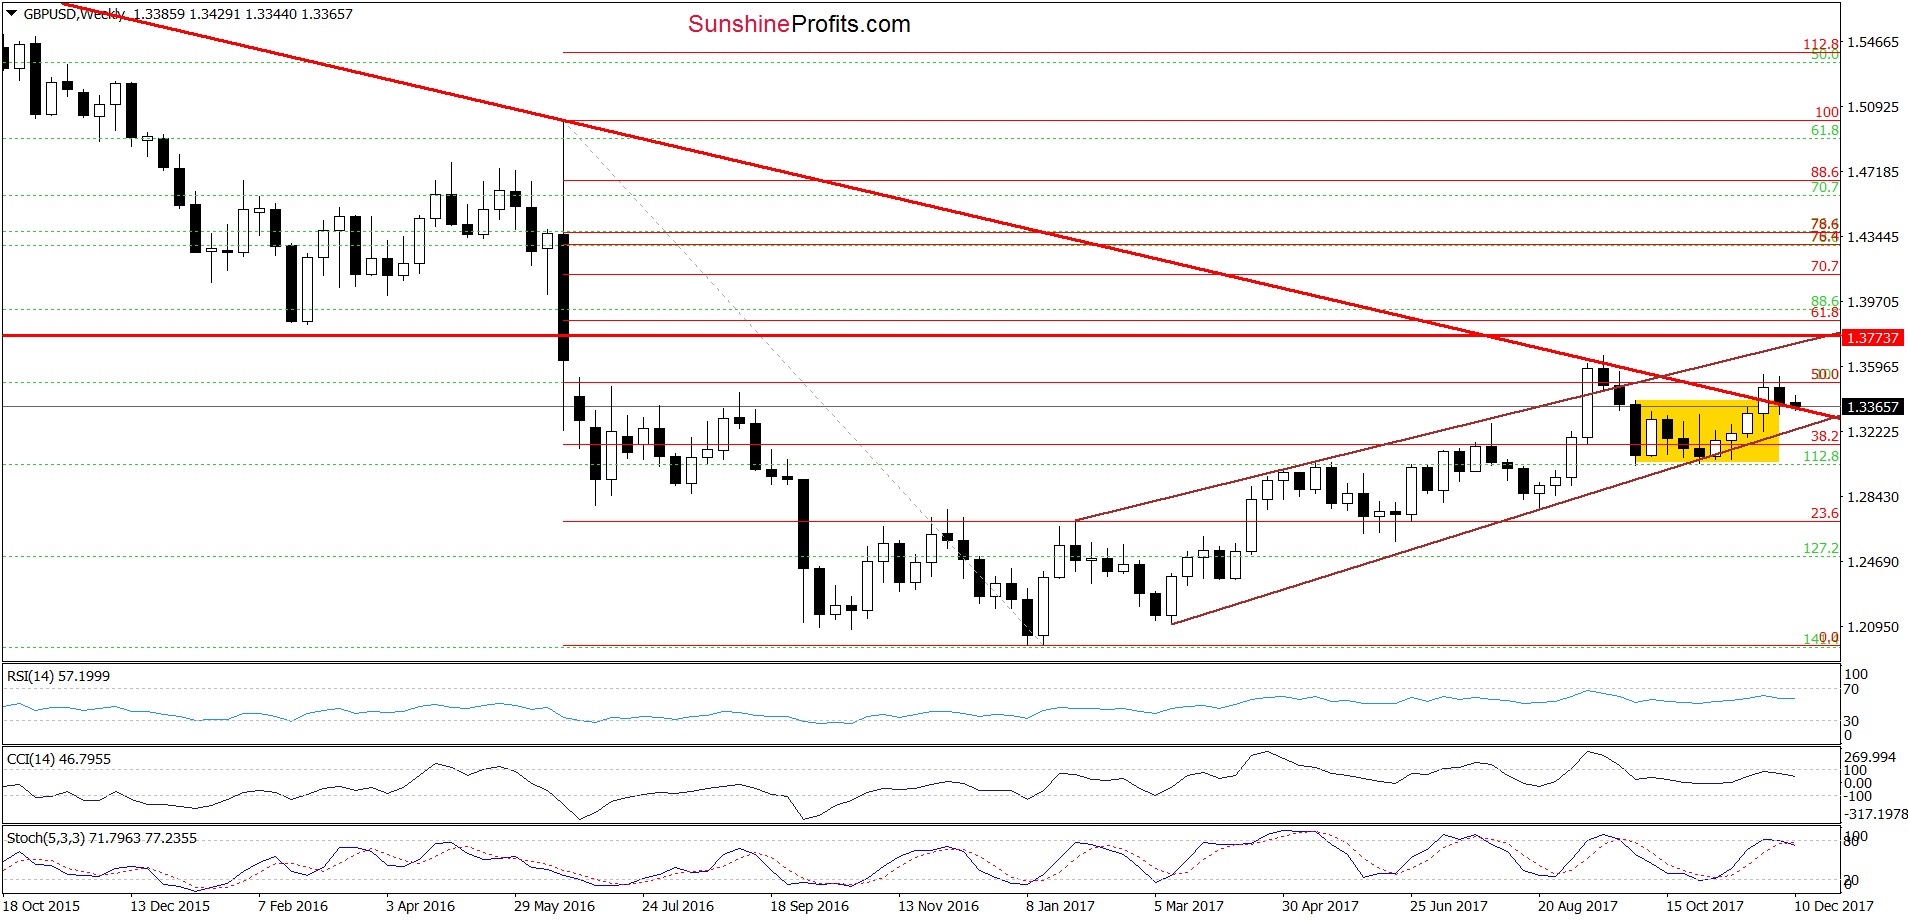
Looking at the medium-term chart, we see that GBP/USD rebounded slightly in the previous week, but currency bears didn’t give up and start the new week with another attempt to move lower. If they succeed and the exchange rate closes this week under the red declining line, the pair will invalidate the earlier breakout above this line, which will trigger further deteroration in the following week(s).
Will we see such price action? Taking into account the sell signals generated by the weekly indicators, the pro bearish scenario is very likely – especially when we factor in the fact that the daily indicators (senn on the chart below) also suport currency bears.
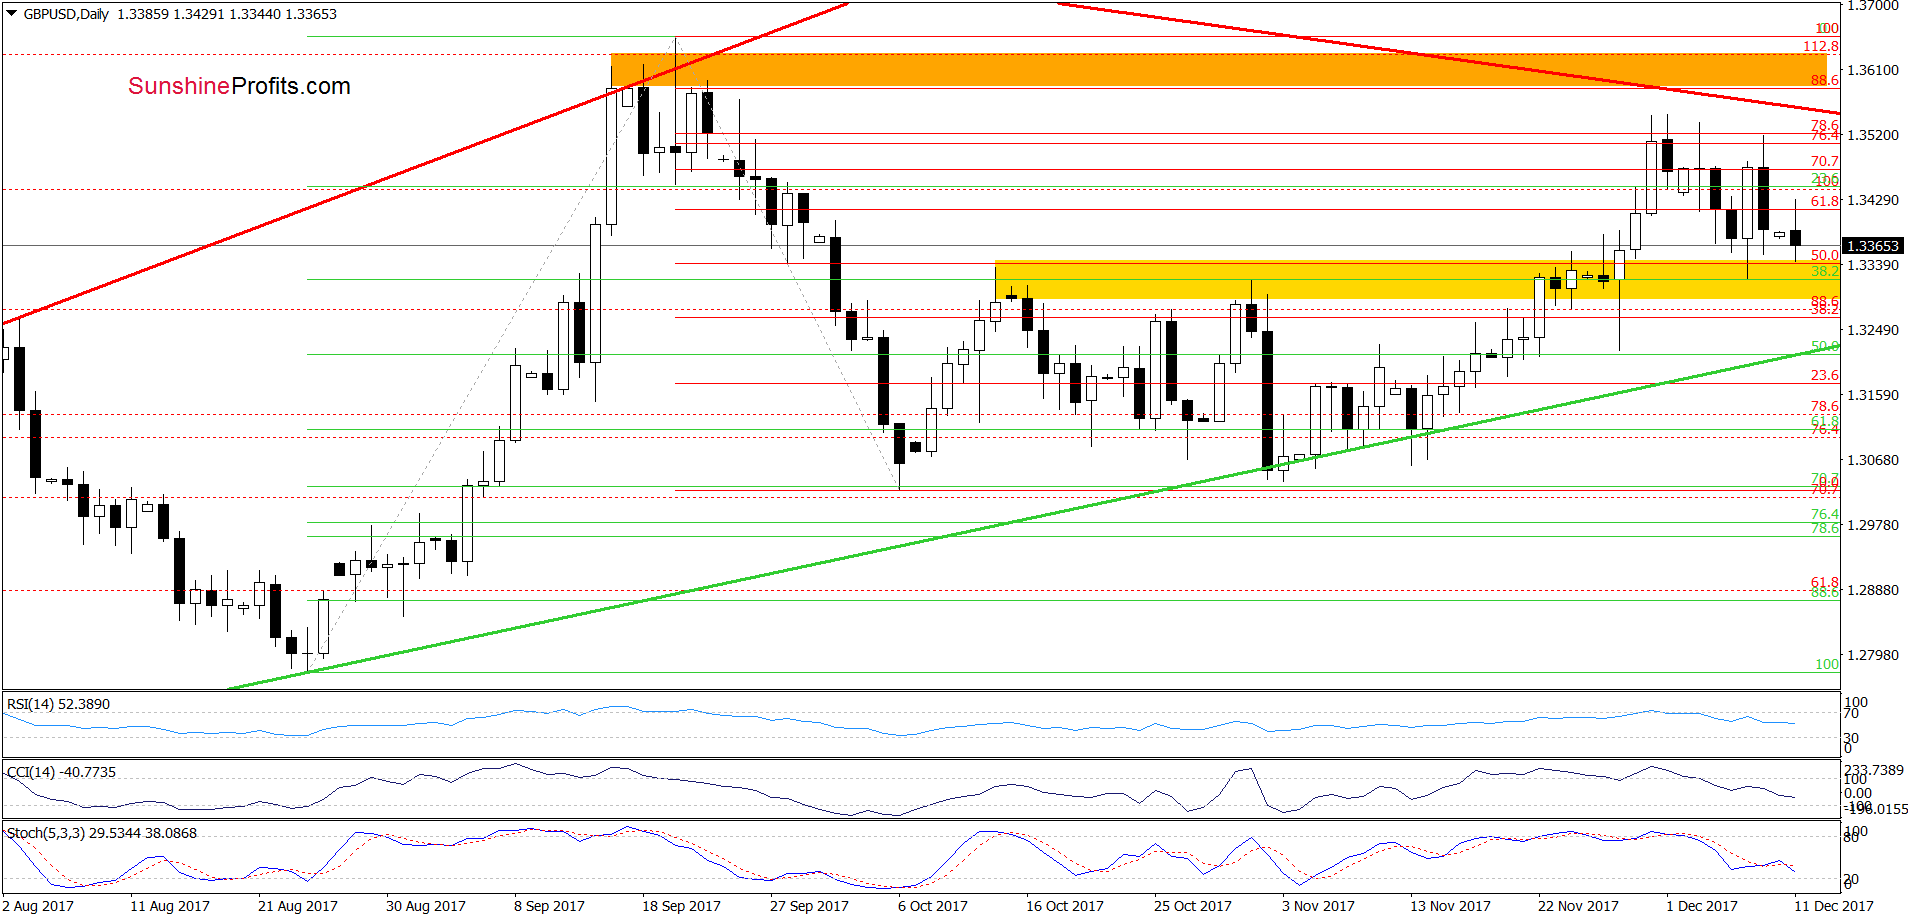
Nevertheless, before we see further deterioration, GBP/USD will have to break under the yellow zone based on the mid-October and the early November peaks.
If we see such price action and GBP/USD moves lower from current levels, we’ll likely see not only another test of the green support line seen on the above chart, but also a drop to the October and November lows in the following days.
Trading position (short-term; our opinion): profitable short positions (with a stop-loss order at 1.3773 and the next downside target at 1.3000) continue to be justified from the risk/reward perspective. We will keep you informed should anything change, or should we see a confirmation/invalidation of the above.
AUD/USD
On Thursday, we wrote the following:
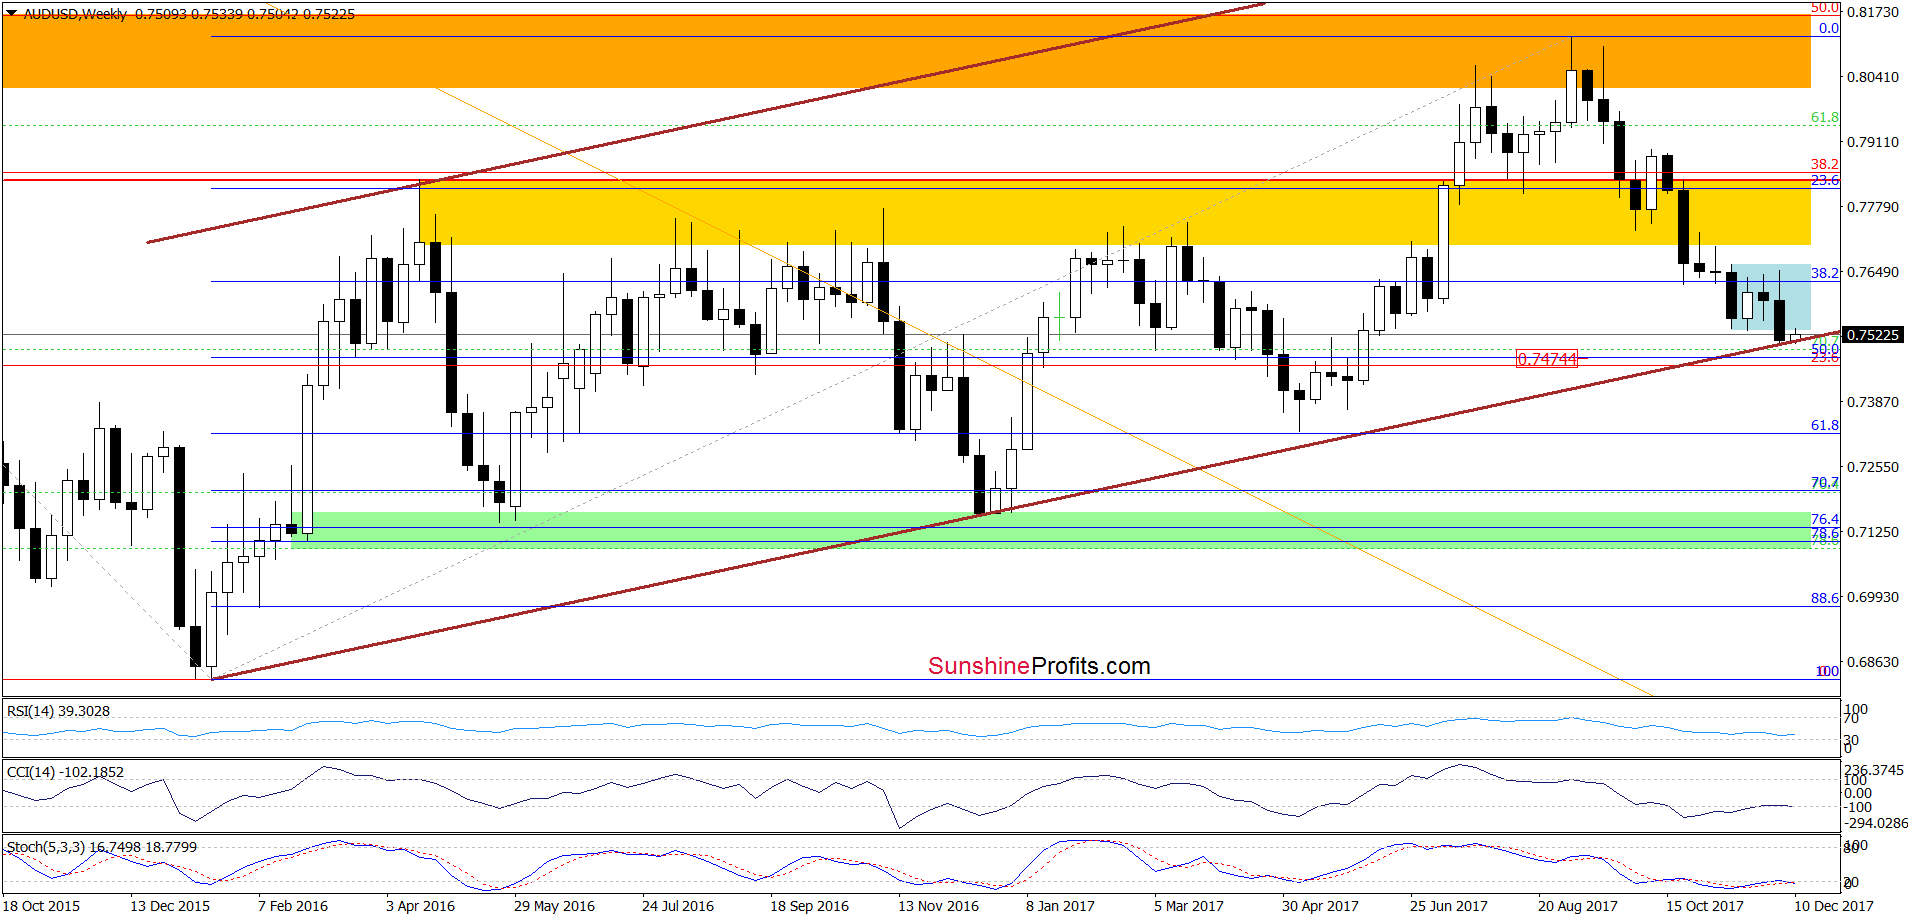
(…) What’s next? Taking into account the (…) breakdown and the sell signals generated by the indicators, we believe that the pair will test the lower border of the brown rising trend channel (seen on the chart below) in the very near future.
From today’s point of view, we see that the situation developed in line with the above scenario and AUD/USD slipped to our downside target. As you see the lower border of the brown rising trend channel triggered a tiny (so far) rebound, which together with the current position of the medium-term indicators suggest that further improvement is just around the corner.
How did this increase affect the very short-term chart? Let’s check.
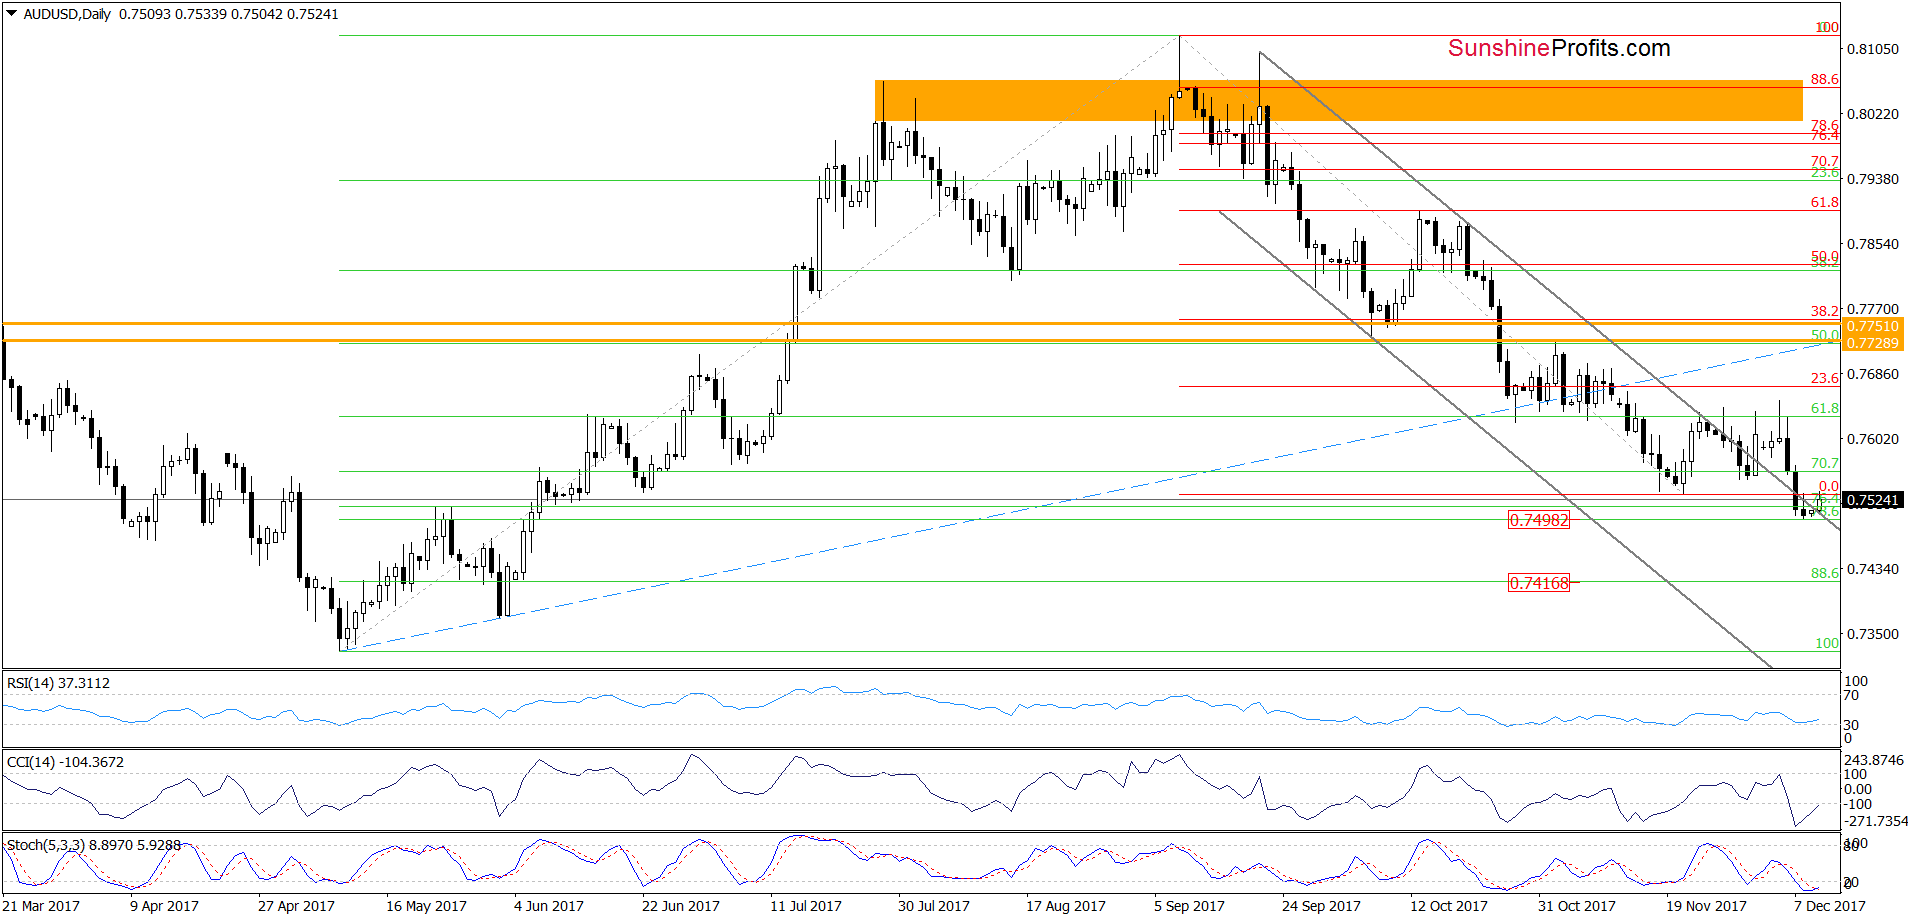
Looking at the daily chart, we see that AUD/USD broke above the upper border of the grey declining trend channel. Additionally, all indicators are very close to generating buy signals, which suggests higher values of the exchange rate in the coming week.
Nevertheless, such price action will be more likely and reliable if the pair closes today’s session (or one of the following sessions) above the upper line of the trend channel. If we see such improvement, we’ll consider opening long positions. As always, we’ll keep you - our subscribers - informed should anything change.
Trading position (short-term; our opinion): No positions are justified from the risk/reward perspective. We will keep you informed should anything change, or should we see a confirmation/invalidation of the above.
Thank you.
Nadia Simmons
Forex & Oil Trading Strategist
Przemyslaw Radomski, CFA
Founder, Editor-in-chief, Gold & Silver Fund Manager
Gold & Silver Trading Alerts
Forex Trading Alerts
Oil Investment Updates
Oil Trading Alerts

