
Based on the July 29th, 2011 Premium Update. Visit our archives for more gold & silver articles.
Here are two words that Americans and the rest of the world have not paid much attention to until now: DEBT CEILING. The debt ceiling drama has been keeping Americans on the edge of their seats and they better hold on tight as those seats could get repossessed on August 2. Its as if Americans national credit card, member since 1776, is valid only through 08/02/11. In a nutshell, the debt ceiling is Americas legal limit on borrowing, and the country is maxed out until Congress increases it.
As of the publication of this essay, there is still no compromise in this high-stake fiscal fracas of who will blink first, President Obama or the Republicans who argue that simply raising the ceiling over and over again is an unsustainable policy and are demanding budget cuts. Precious metals have been direct beneficiaries of the impasse. After a setting an all-time high on Wednesday of $1,628, spot gold took a breather on Thursday after hitting record highs for two sessions this week. Since the beginning of the year, the price of the precious metal is up 13.58 percent, closing at $1,614.40 an ounce on Monday. This includes an increase of $12.90 on Monday alone.
The stalemate may cost America its AAA rating, adding $100 billion a year to government costs while dragging down economic growth.
Under normal circumstances there is not a big brouhaha in raising the debt ceiling. After all, since March 1962, the debt ceiling has been raised 74 times, according to the Congressional Research Service. Ten of those times have occurred since 2001.
For more detail on the history of the debt ceiling in the U.S., please take a look at the chart below.

As you might see, gold has roughly followed the rises in the U.S. debt level since 2000. On the other hand, you will also surely notice that there were periods in golds history when the metal traded without visible correlation with the aforementioned debt. In short, the above chart confirms that growing uncertainty linked to the growing debt pile might fuel the price of gold, however it also confirms that markets cannot follow a given economic indicator with reasonable precision at all times and confirms what weve emphasized many times that fundamental factors can only point you the general direction in which a market is going, but they do not provide timing details.
Having outlined the current debt situation, let's begin the technical part of this essay with the analysis of the Euro Index. We will start with the short-term chart (charts courtesy by http://stockcharts.com.)
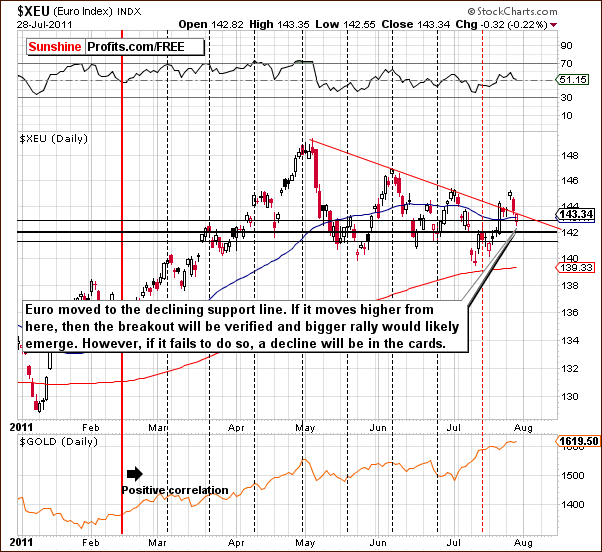
In the short-term Euro Index chart this week, we see that a recent breakout above the declining resistance line was quickly followed by a move back to it. At this point, it appears that we may be seeing an invalidation of this breakout as the index level moved below the support/resistance line and then back up to it. The situation is indeed tense, for if a rally is seen from here, we could have a confirmation of a breakout. On the other hand, a move lower would likely invalidate any breakout and would be a very strong bearish signal in and of itself.
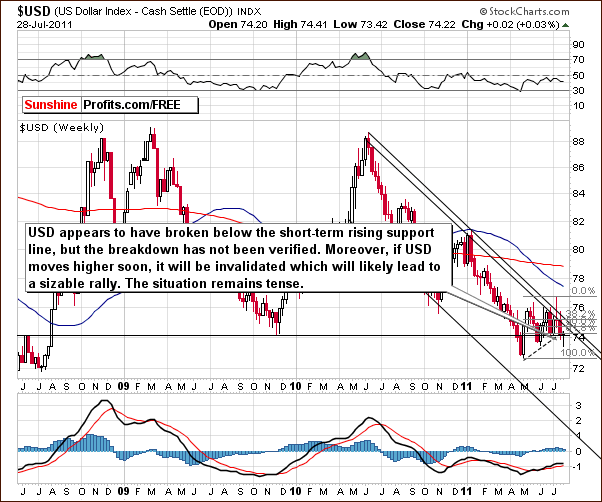
In this weeks long-term USD Index chart, we also have a tense situation. The index level is slightly below the short-term rising support line, the 61.8% Fibonacci retracement level, and the November 2010 low.
However, we saw a move back to the above-mentioned level. In the case of the USD Index, we are looking for the confirmation or invalidation of a breakdown. A confirmation would be bearish and an invalidation of the breakdown would be bullish. This causes the situation to be tense for the same reason we saw in the Euro Index. The only difference is that here we are dealing with a breakdown and the euro is dealing with a breakout.
Once we have highlighted the situation in the currency markets, lets check how the relationship between currencies and precious metals looks at the moment.
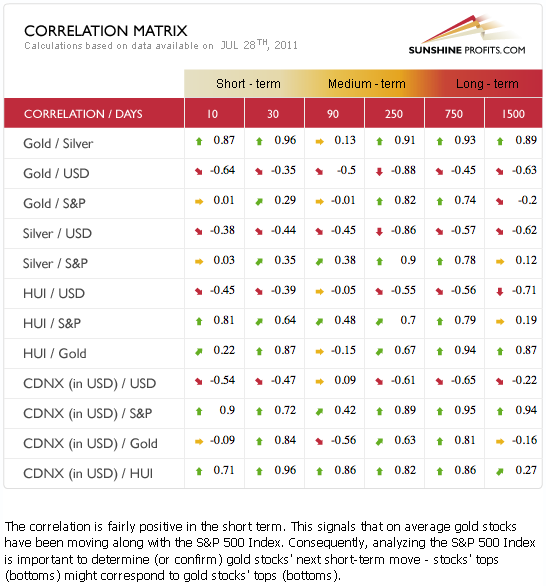
In this weeks Correlation Matrix, the coefficients from the short-term 30-day column appear to be more significant this week. A number of changes in this weeks matrix point to a possible return to normal. The negative correlation between gold and the USD Index in the 10-day column is fairly significant. This indicates that gold and the dollar have moved in opposite directions. However, ten days is not a long enough time from which to draw conclusions and make significant price predictions.
The most important implication here this week is the normalization of the relationship between gold and the dollar. These two have unnaturally moved in the same general direction recently (euro-weakness-driven) but this appears to no longer be the case. Higher values for the dollar normally result in lower gold prices and, conversely, when the USD Index declines, gold prices normally rise. It seems that we may see this type of relationship between the two once again.
The general stock market has shown some positive correlation with gold stocks in the 30-day column. The implication here is that if stocks decline, gold and silver mining stocks will likely decline as well and underperform the underlying metals.
In our previous essay we analyzed the situation of GLD ETF in light of a possible gold correction. We wrote the following:
The situation remains somewhat unclear on the ( ) GLD ETF chart with two possibilities on the table. GLD may either decline to the 50-day moving average ( ) or decline insignificantly and rally afterwards ( ). Either way, at least a short-term correction still appears likely but what we have seen to this point is not enough to allow for a valid comparison to any particular point in the past and thus the correction does not appear to be over. It is simply a tough call at this time to identify which previous pattern is most likely to be repeated. The jury remains out.
What has the jury ruled on? The short-term GLD ETF chart will answer to that.
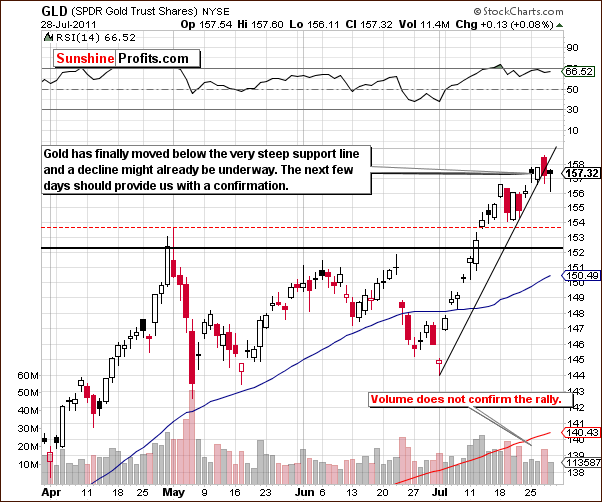
In this short-term GLD ETF chart, we see that gold declined visibly on Wednesday accompanied by strong volume. This was followed by sideways price movement on low volume. The signs appear bearish since moves accompanied by significant volume generally indicate the true direction of the market. In short, even though gold prices have moved higher recently, volume levels have not confirmed this move and there is no evidence to support a bullish outlook at this time. In short, the jury has not reached a unanimous decision yet, but bearish voices are becoming increasingly loud.
Summing up, important days appear to be ahead in the currency markets with the euros breakout and the dollars breakdown subject to being confirmed or invalidated soon. Whichever way things turn out will likely determine the trend in both markets for at least the short term. What is more, the action in currencies may have important impact on precious metals as the relationship between gold and the USD Index seems to come back to normal. Any possible action could add fuel to flame as the situation in gold remains mixed and tense this week with a slight bearish bias.
To make sure that you are notified once the new features are implemented, and get immediate access to my free thoughts on the market, including information not available publicly, we urge you to sign up for our free e-mail list. Sign up for our gold & silver mailing list today and you'll also get free, 7-day access to the Premium Sections on my website, including valuable tools and charts dedicated to serious PM Investors and Speculators. It's free and you may unsubscribe at any time.
Thank you for reading. Have a great weekend and profitable week!
P. Radomski
--
Mining stocks moved sharply lower on Wednesday and the rest of the precious metals sector followed. Was that the beginning of the correction, or are metals strong enough to rally throughout the summer months without taking a step back? This week's commentary includes our thoughts on this timely topic and the platinum market provides us with additional insight.
Signals that we've seen last week regarding the general stock market are no longer present and meanwhile, the situation in the currency (euro, USD) indices is particularly tense as they are either on a verge of a significant move up, or down.
In today's issue we also explain our strategy for the coming weeks and discuss what factors could invalidate it. We encourage you to Subscribe to the Premium Service today and read the full version of this week's analysis right away.
Back