
Based on the April 12, 2013 Premium Update. Visit our archives for more gold & silver articles.
This week we saw some interesting developments on the financial markets, mainly in the general stock market – S&P 500 has finally reached (and surpassed) the long-awaited 2007 high level and other more specific stock-market sectors have not been idle as well. Let us then jump straight into today’s technical portion to take a closer look at what’s happened and to see what the implications for the whole precious metals sector are. We will start with the S&P 500 Index long-term chart (charts courtesy by http://stockcharts.com.)
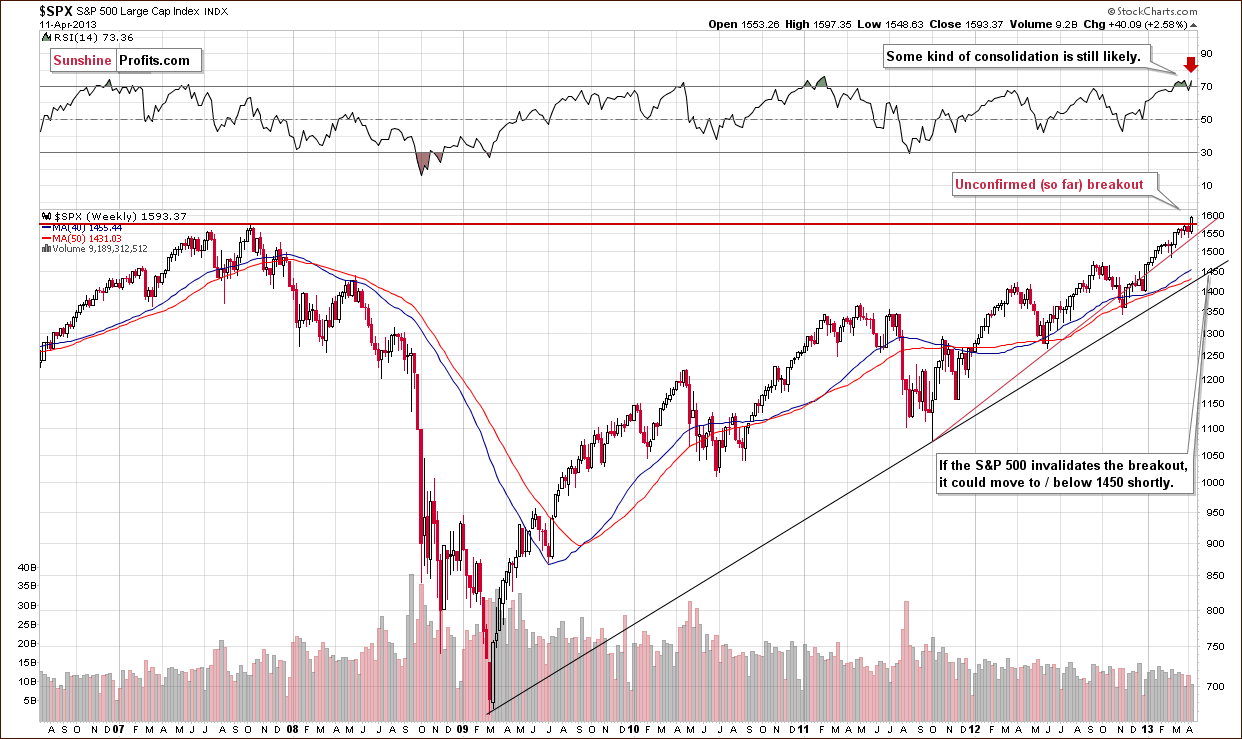
As mentioned above, we finally have a breakout and we have seen two daily closes above the 2007 high. One more close above this level (today) will confirm the breakout for the S&P 500. If this does happen, it will increase the odds for the continuation of a medium-term rally in the general stock market.
RSI levels are overbought for the medium term so some short-term consolidation is possible here anyway - before the rally really picks up. Nonetheless, this week’s price action is bullish based on this chart alone. If the breakout is invalidated, we are likely to see quite visible declines, perhaps to the 1,450 level for the S&P 500. This level approximately coincides with the long-term support line on the above chart.
Let us move on to the financial sector, which often leads the general stock market, for more clues regarding the future moves of the S&P 500 – we’ll use the Broker-Dealer Index as a proxy here.
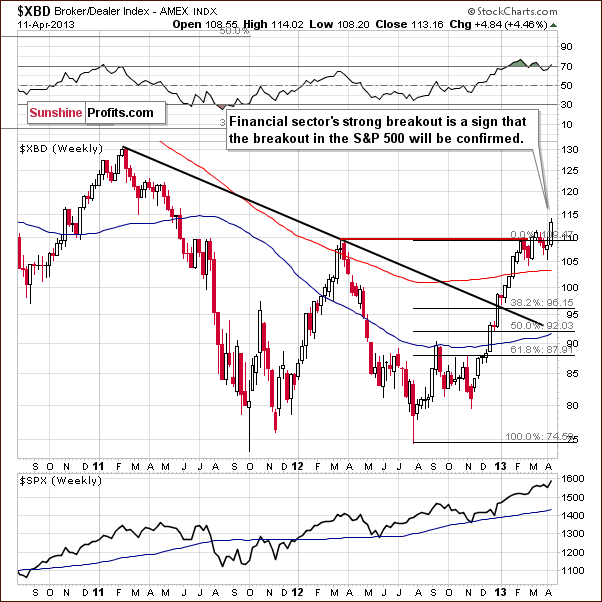
We also see a breakout for the financial stocks. The move here in fact is even more significant than that of the S&P 500. This is a strong bullish signal, though not yet confirmed, and will become even stronger if confirmed by today’s closing price levels.
The breakout here materialized after the cup-and-handle pattern was seen. The consolidation preceding the breakout was not huge when compared to the cup, but the implications are clearly bullish anyway. Please keep in mind that the financial sector used to lead the general stock market lower and higher so the bullish sign here is also a bullish confirmation for other stocks.
We’ll now have a look at the Dow to gold ratio, one of the tools for comparing gold strength relative to stocks.
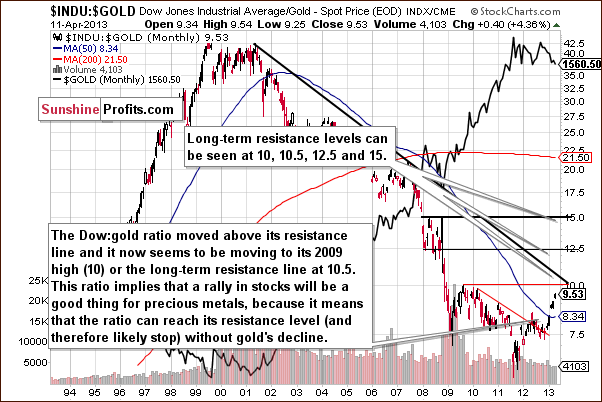
In this chart, we see that the ratio provides bearish implications for gold or bullish implications for stocks or perhaps both. If the ratio moves higher, either gold’s price will likely decline or stock prices will likely rise. The ratio has been declining recently and the medium-term trend remains up as a major resistance line has not yet been reached.
There is resistance at the 10.0 level here, which equals the 2009 high. A ratio of 10 means that the level of the Dow Industrials is equal to 10 times gold’s price. The question based on this chart now is will gold prices decline, will stocks move higher, or will we perhaps see both. If stocks confirm their breakout, then gold will not have to decline – or at least not much lower – for the ratio to move higher.
Summing up, the situation in the general stock market improved this week, and if the S&P 500 ends the week above their 2007 highs, their breakout will be confirmed. The breakout above the 2007 highs is visible in many indices at the same time including the industrials, transportation stocks, the S&P 500 and the financials.
Given today’s decline and breakdown in the precious metals sector it’s likely the case that the final bottom in gold, silver and mining stocks will be accompanied by a top in the Dow:gold ratio. The sooner the stocks rise, the sooner the resistance levels in the ratio will be reached.
How low can gold and silver go? Should you dump your gold and silver investments given today's breakdown and the size of the decline? These are the critical questions that we answered in today's Market Alert that we posted shortly after publishing today's Premium Update (we take the "we'll keep you updated" pledge that we give to our subscribers very seriously). If there was ever a time when we would like to particularly encourage you to read the premium version of our analysis - it's today. It's definitely one of the - if not the - most important Market Alert of the year. Read today's Market Alert by signing up here.
Thank you.
Sincerely,
Przemyslaw Radomski, CFA
