

Although the Fibonacci retracement triggered a rebound in AUD/USD currency bulls failed and the pair erased almost 70% of the recent rebound. Does it mean that we’ll see fresh lows in the coming days?
EUR/USD
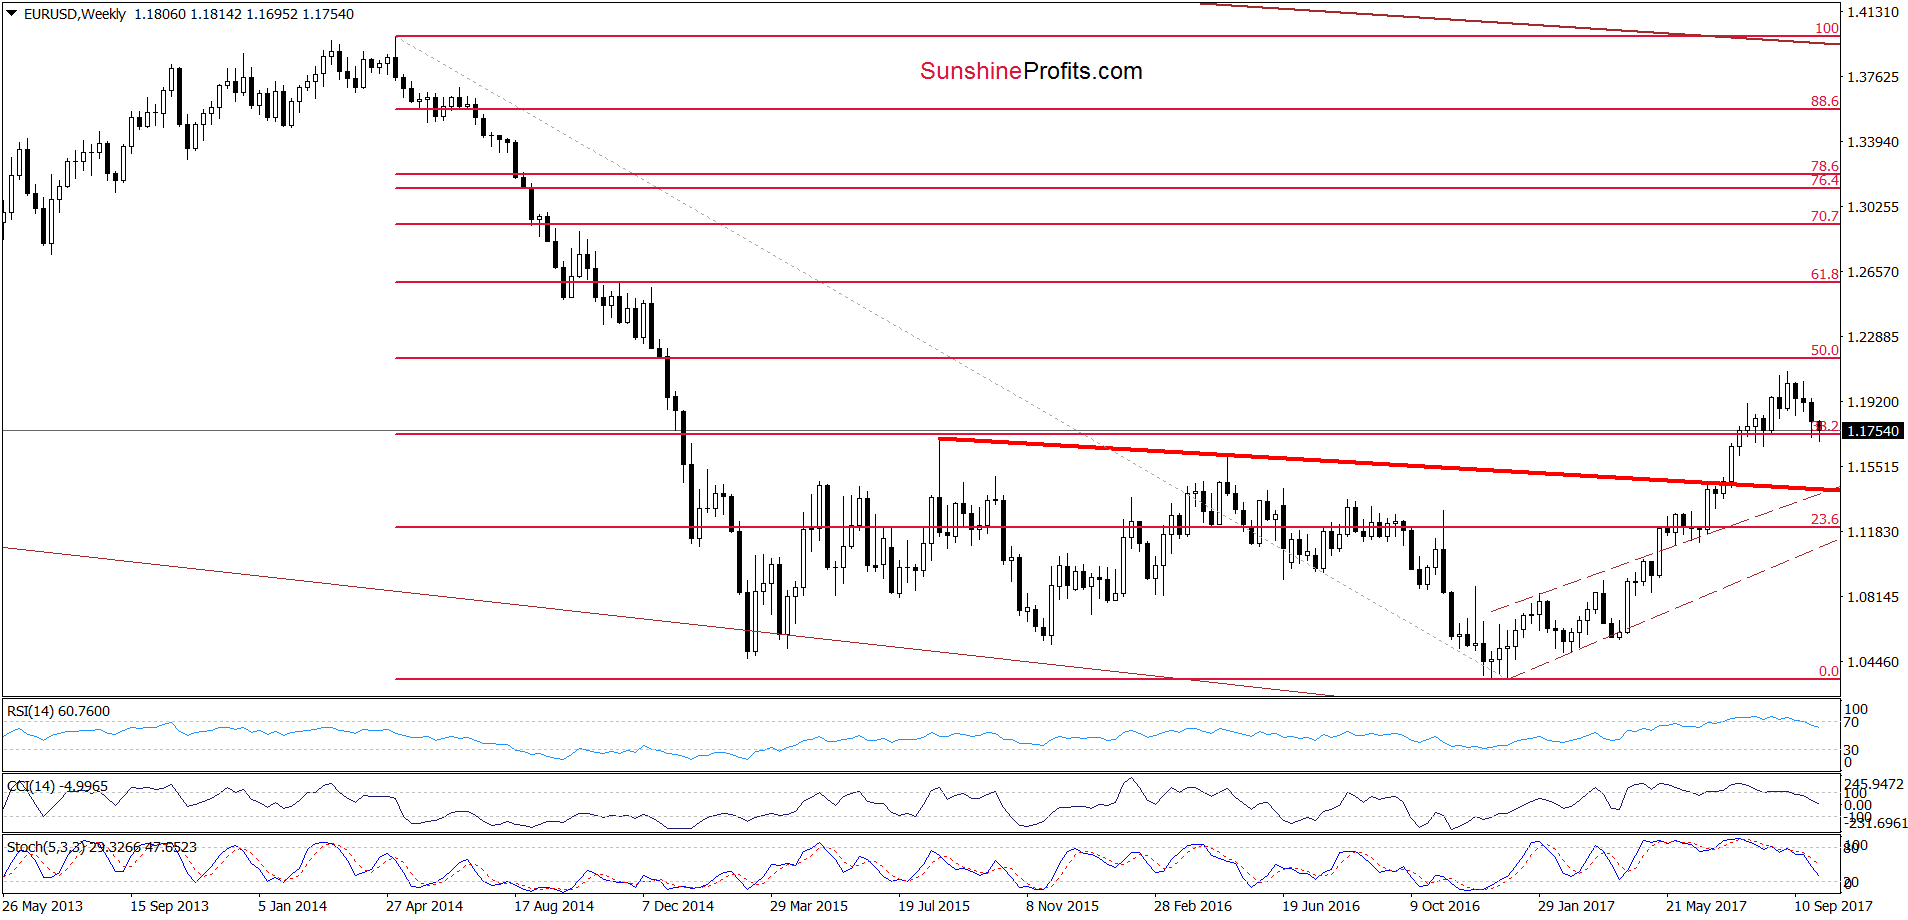
From today’s point of view, we see that the overall situation hasn’t changed much as EUR/USD is trading at yesterday levels, which means that what we wrote yesterday is up-to-date also today:
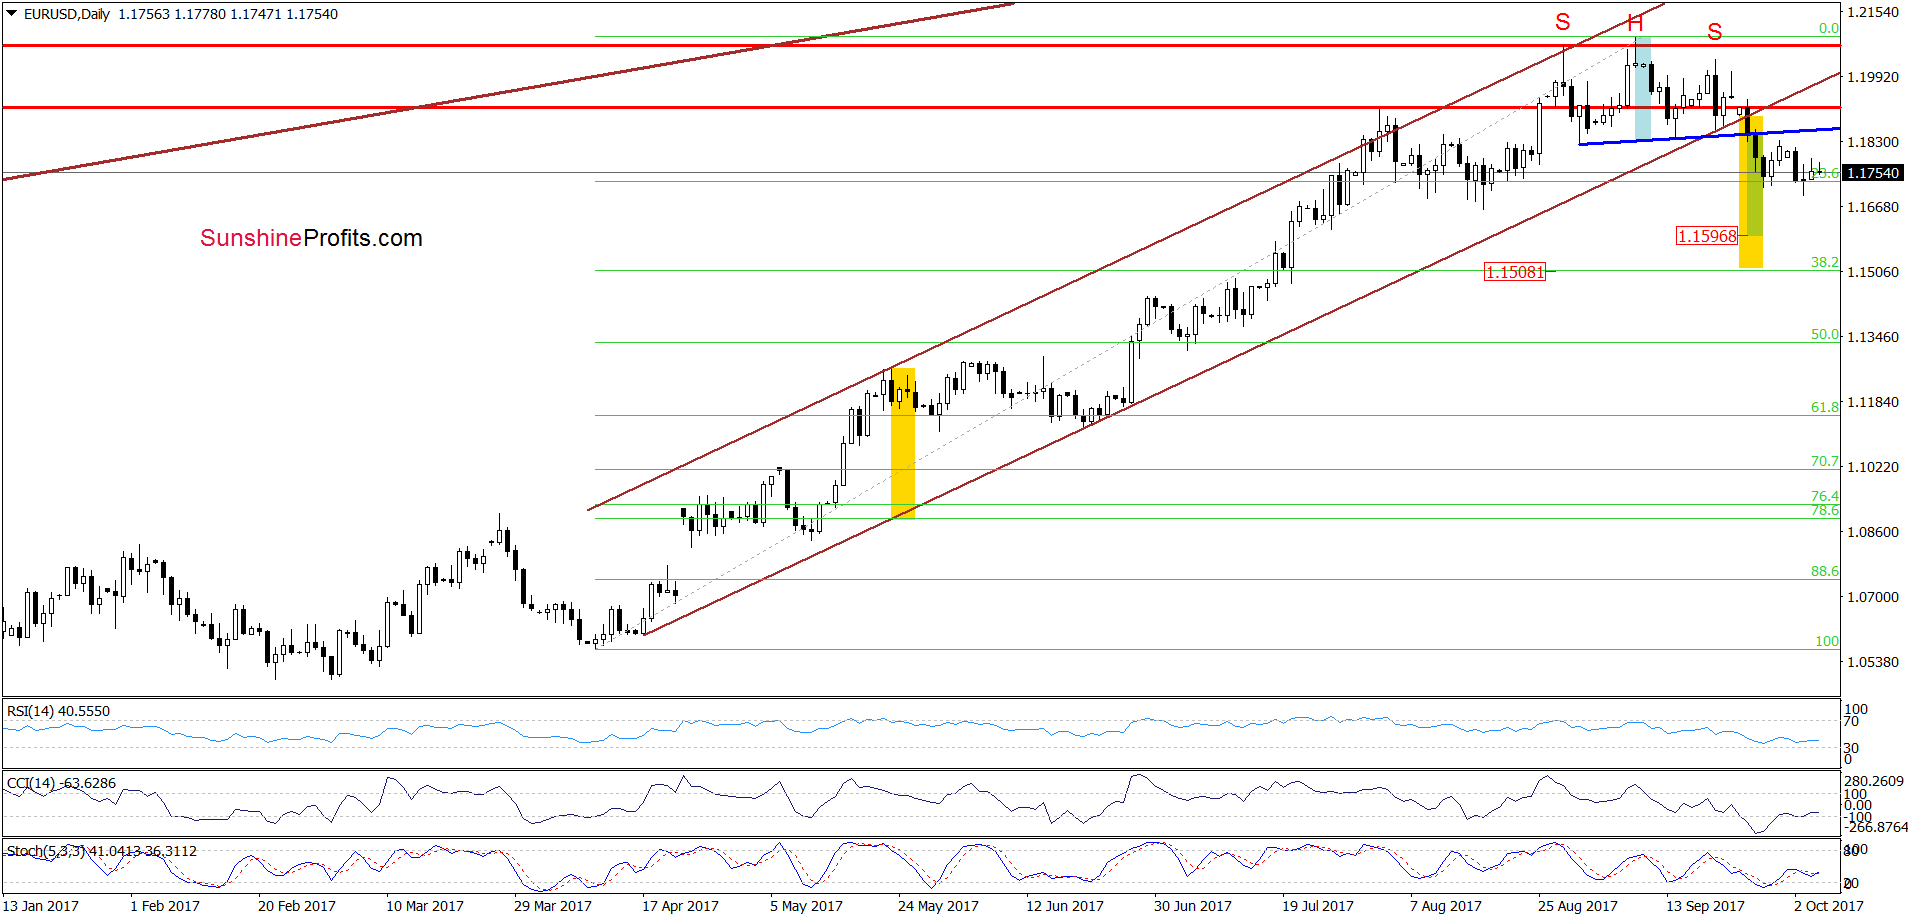
(…) EUR/USD moved a bit higher earlier today, but did it change anything? In our opinion, it didn’t, because the exchange rate is still trading not only well below the lower border of the brown rising trend channel, but also under the blue resistance line, which means that the head and shoulders formation is underway (and it will be as long as we do not see an invalidation of the breakdown under blue line). Additionally, the sell signals generated by the weekly and daily indicators (except the CCI, which generated the buy signal) remain in cards, supporting currency bears and lower values of EUR/USD.
Taking these facts, we believe that (…) we’ll see a downward move to around 1.1596, where the size of the move will correspond to the height of the formation [the head and shoulders pattern].
However, when we take into account a drop under the lower border of the brown rising trend channel and the broader picture of EUR/USD, we think that currency bears push the exchange rate even lower – to around 1.1508, where the size of declines will be equal to the height of trend channel. Taking all the above into account, we believe that our (already profitable) short positions are justified from the risk/reward perspective.
Very short-term outlook: mixed with bearish bias
Short-term outlook: bearish
MT outlook: mixed
LT outlook: mixed
GBP/USD
On Tuesday, we wrote the following:
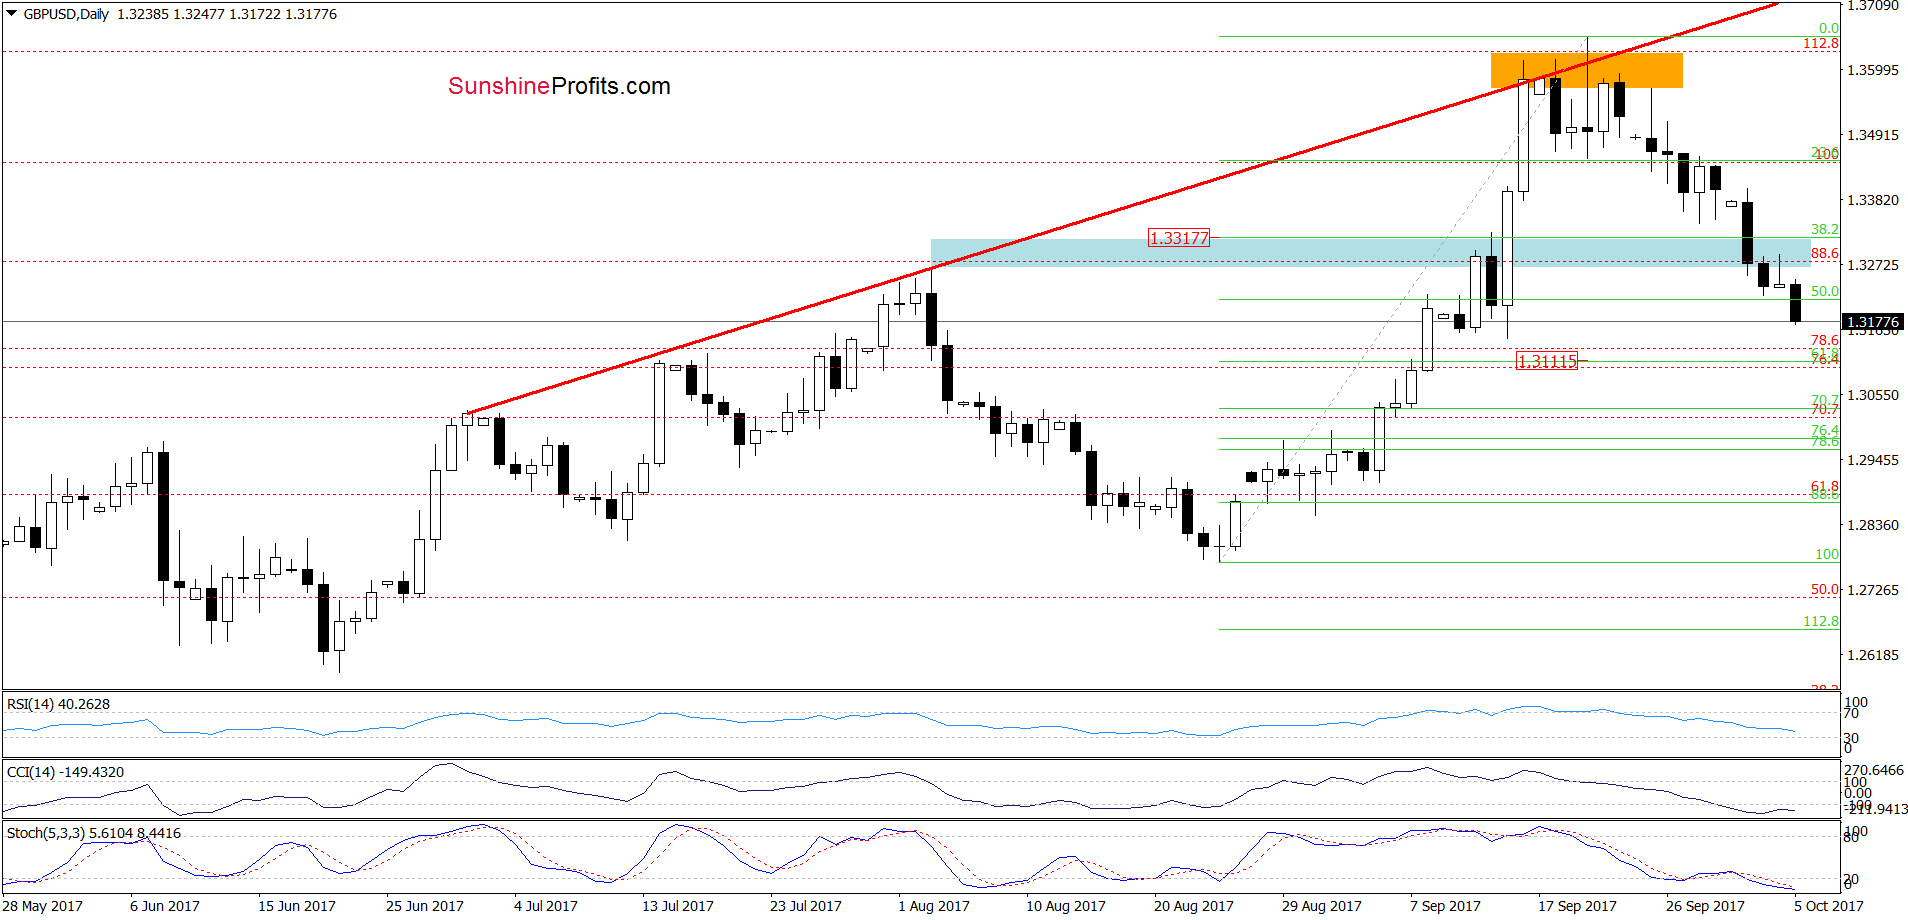
(…) What’s next for the exchange rate? Although the pair slipped to the blue support zone, we should keep in mind that the pair closed yesterday’s session below the 38.2% Fibonacci retracement based on the August-September upward move, which suggests further deterioration – especially when we factor in the fact that the sell signals generated by the weekly and daily indicators remain in cards, supporting currency bears.
Looking at the daily chart, we see that currency bears pushed GBP/USD lower (as we had expected), which resulted in a daily closure below the blue support zone. Earlier today, this negative development together with the sell signals generated by the indicators triggered further deterioration and a drop below the 50% Fibonacci retracement.
What does it mean for the exchange rate? We believe that the best answer to this question will be the quote from our Tuesday Forex Trading Alert:
(…) Taking the above into account, we think that if the pair extends losses from current levels, we’ll see a test of the mid-September low of 1.3149 and the 61.8% Fibonacci retracement based on the August-September upward move (around 1.3115) in the coming days.
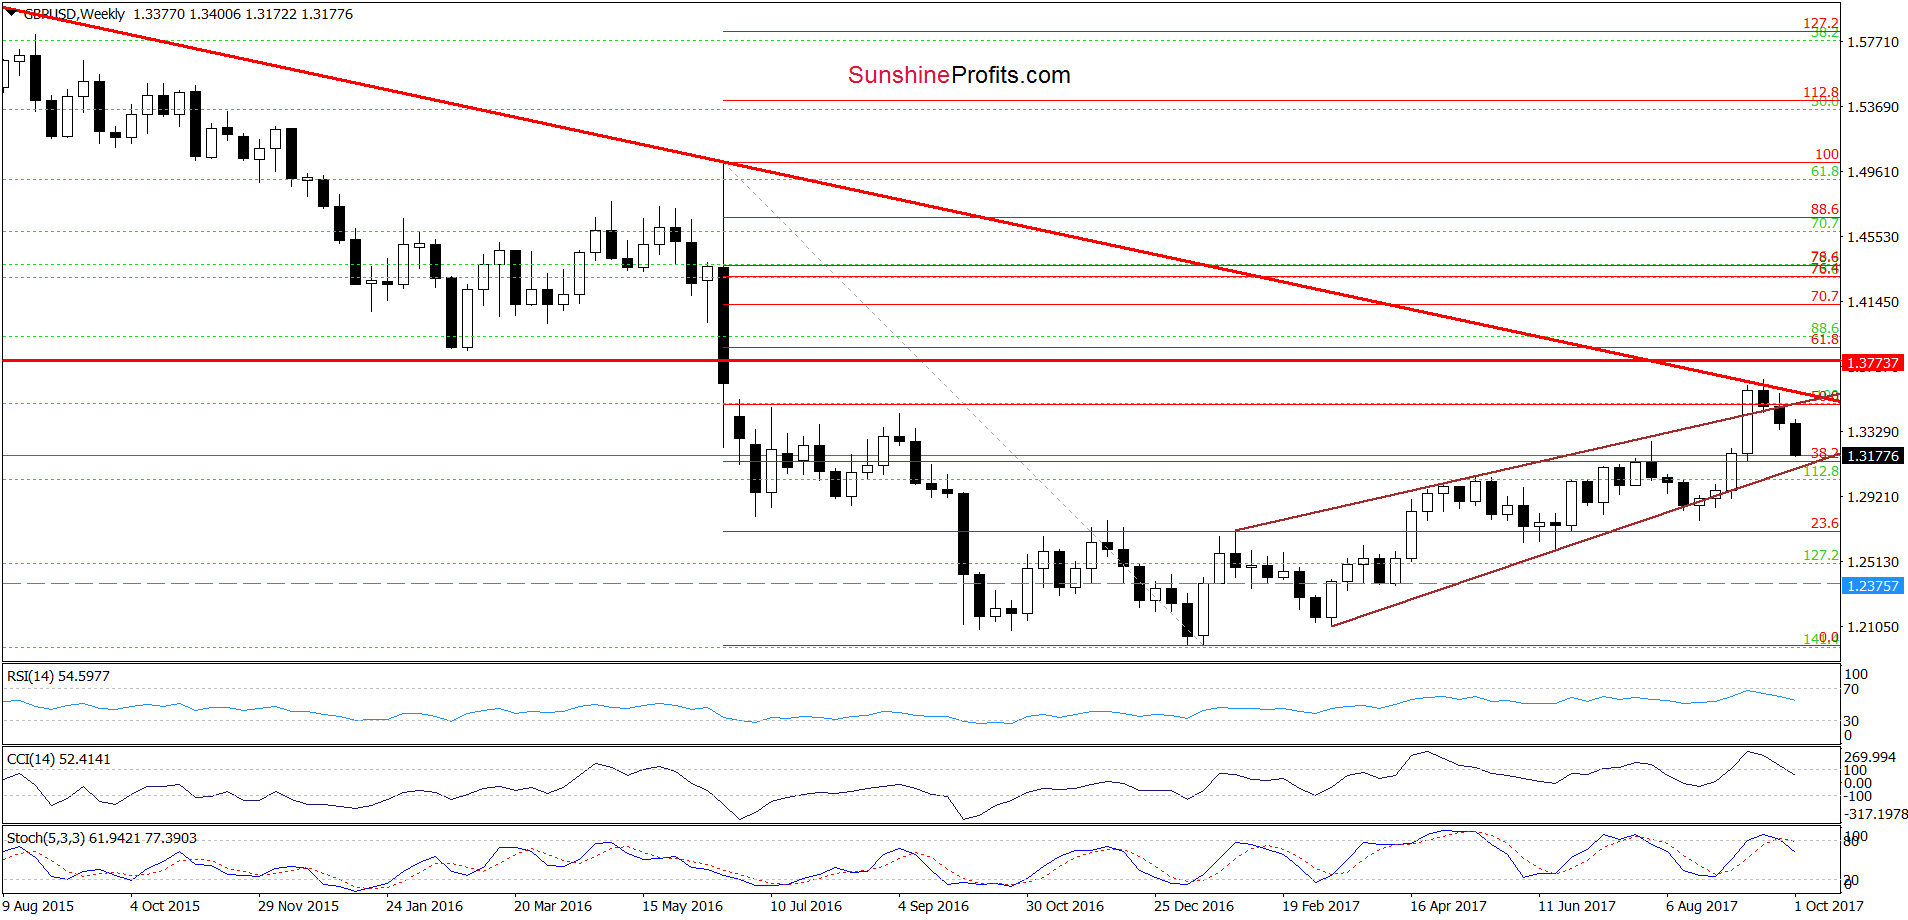
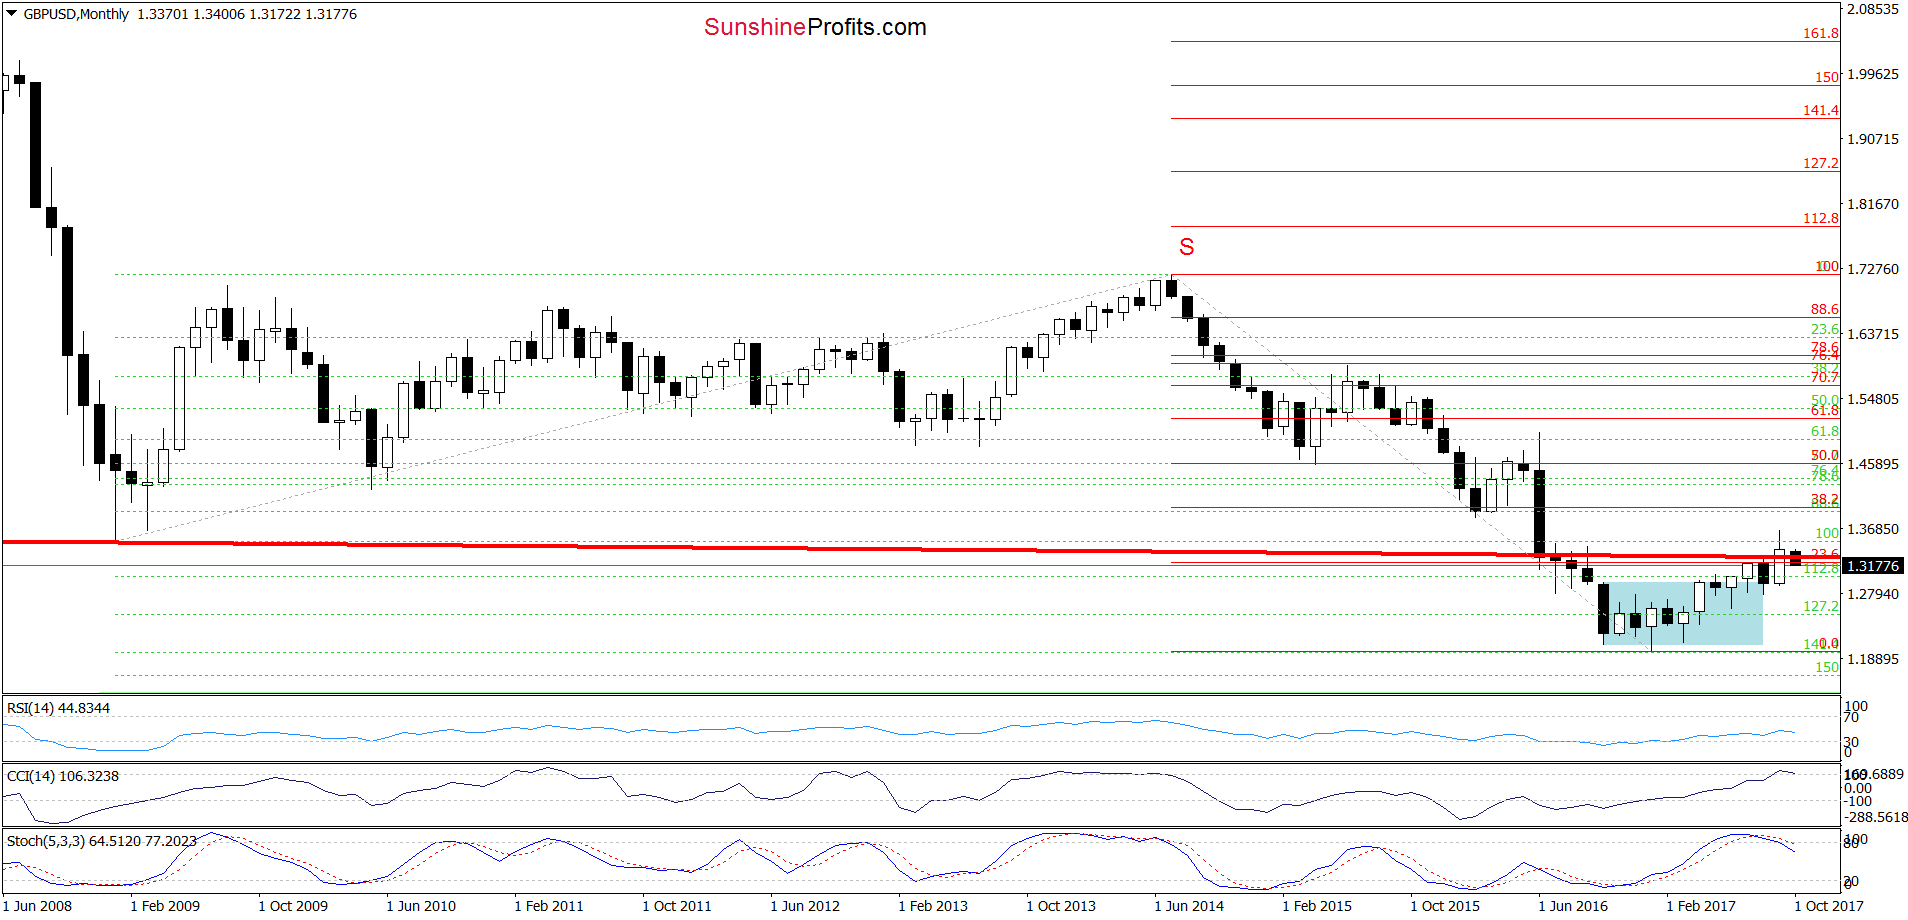
Nevertheless, looking at the weekly chart and considering an invalidation of the breakout above the upper border of the brown rising wedge, it seems that we could see GBP/USD even lower - around 1.3100, where the lower border of the above-mentioned formation currently is.
Finishing today’s commentary on this currency pair, we would also like to draw your attention to the long-term chart of GBP/USD.
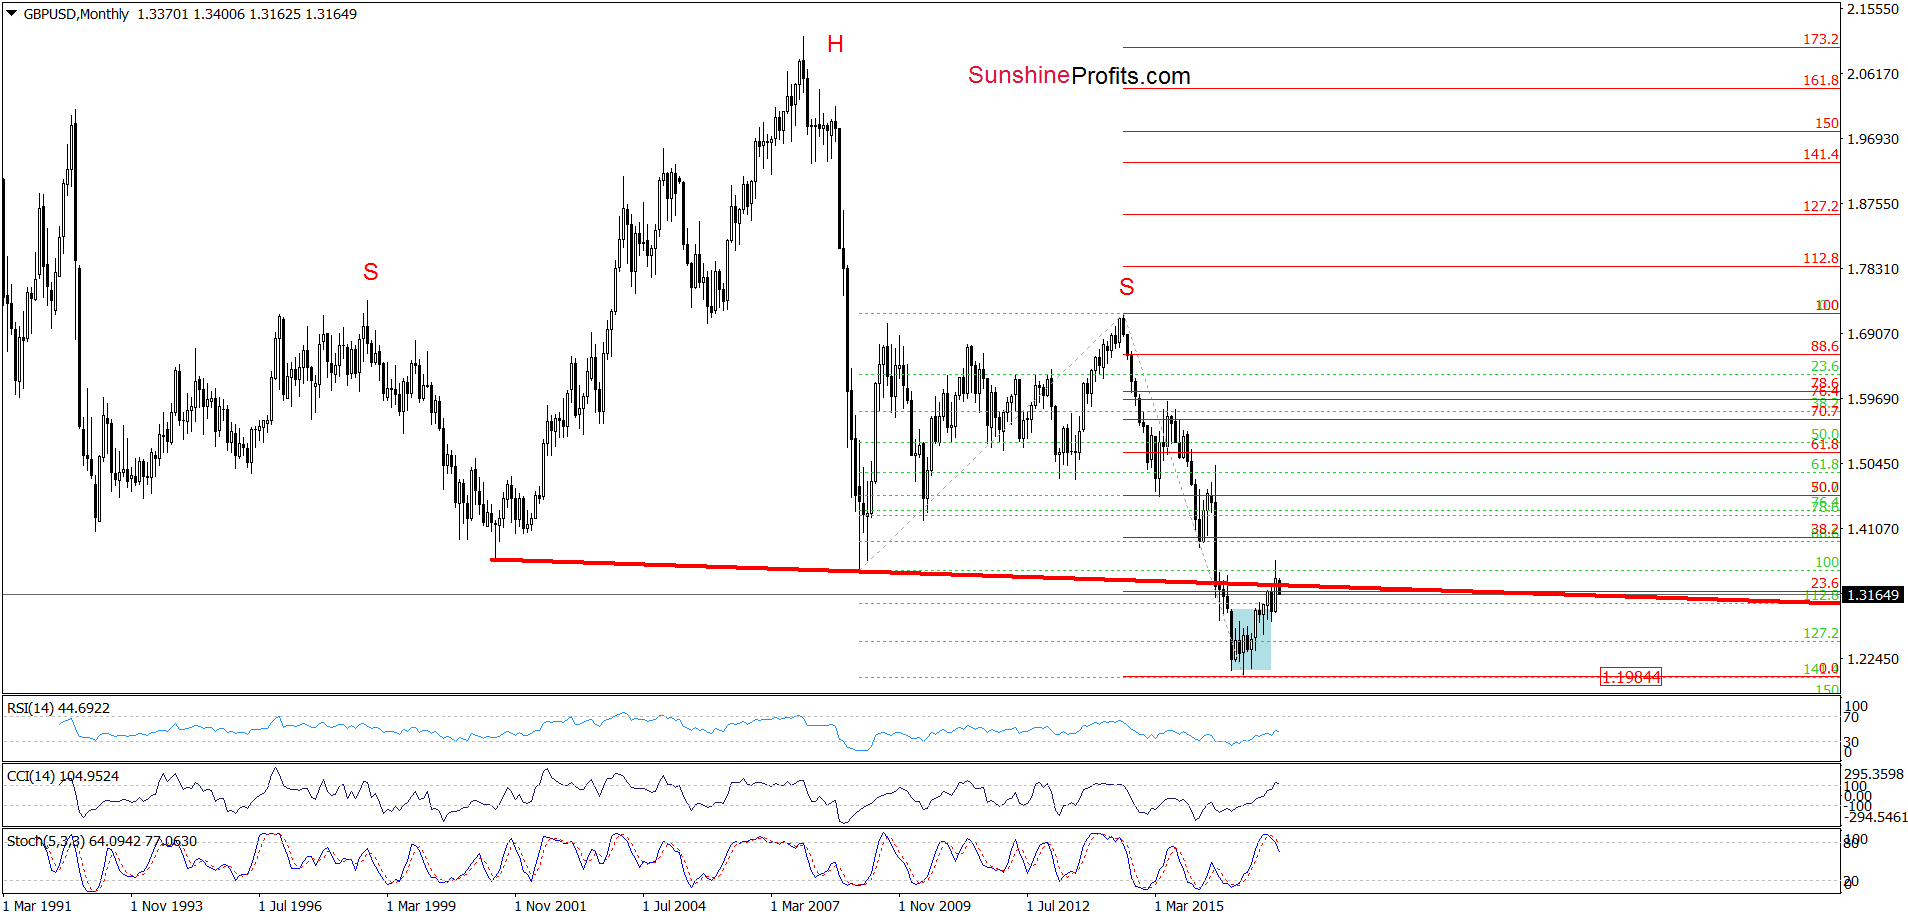
From this perspective, we see that this month’s decline took the exchange rate below the previously-broken red line (the neck line of the very long-term head and shoulders formation), which resulted in an invalidation of the earlier breakout.
Additionally, the Stochastic Oscillator generated the sell signal (while the CCI is very close to doing the same) for the first time since July 2014, which suggests further deterioration in the coming month(s). Why? When we take a closer look at the long-term chart, we see that similar readings of the indicators preceded a significant decline in the following months, which suggests that we’ll see a similar price action later in 2017. Therefore, short profitable positions continue to be justified from the risk/reward perspective.
Very short-term outlook: bearish
Short-term outlook: bearish
MT outlook: mixed with bearish bias
LT outlook: mixed with bearish bias
AUD/USD
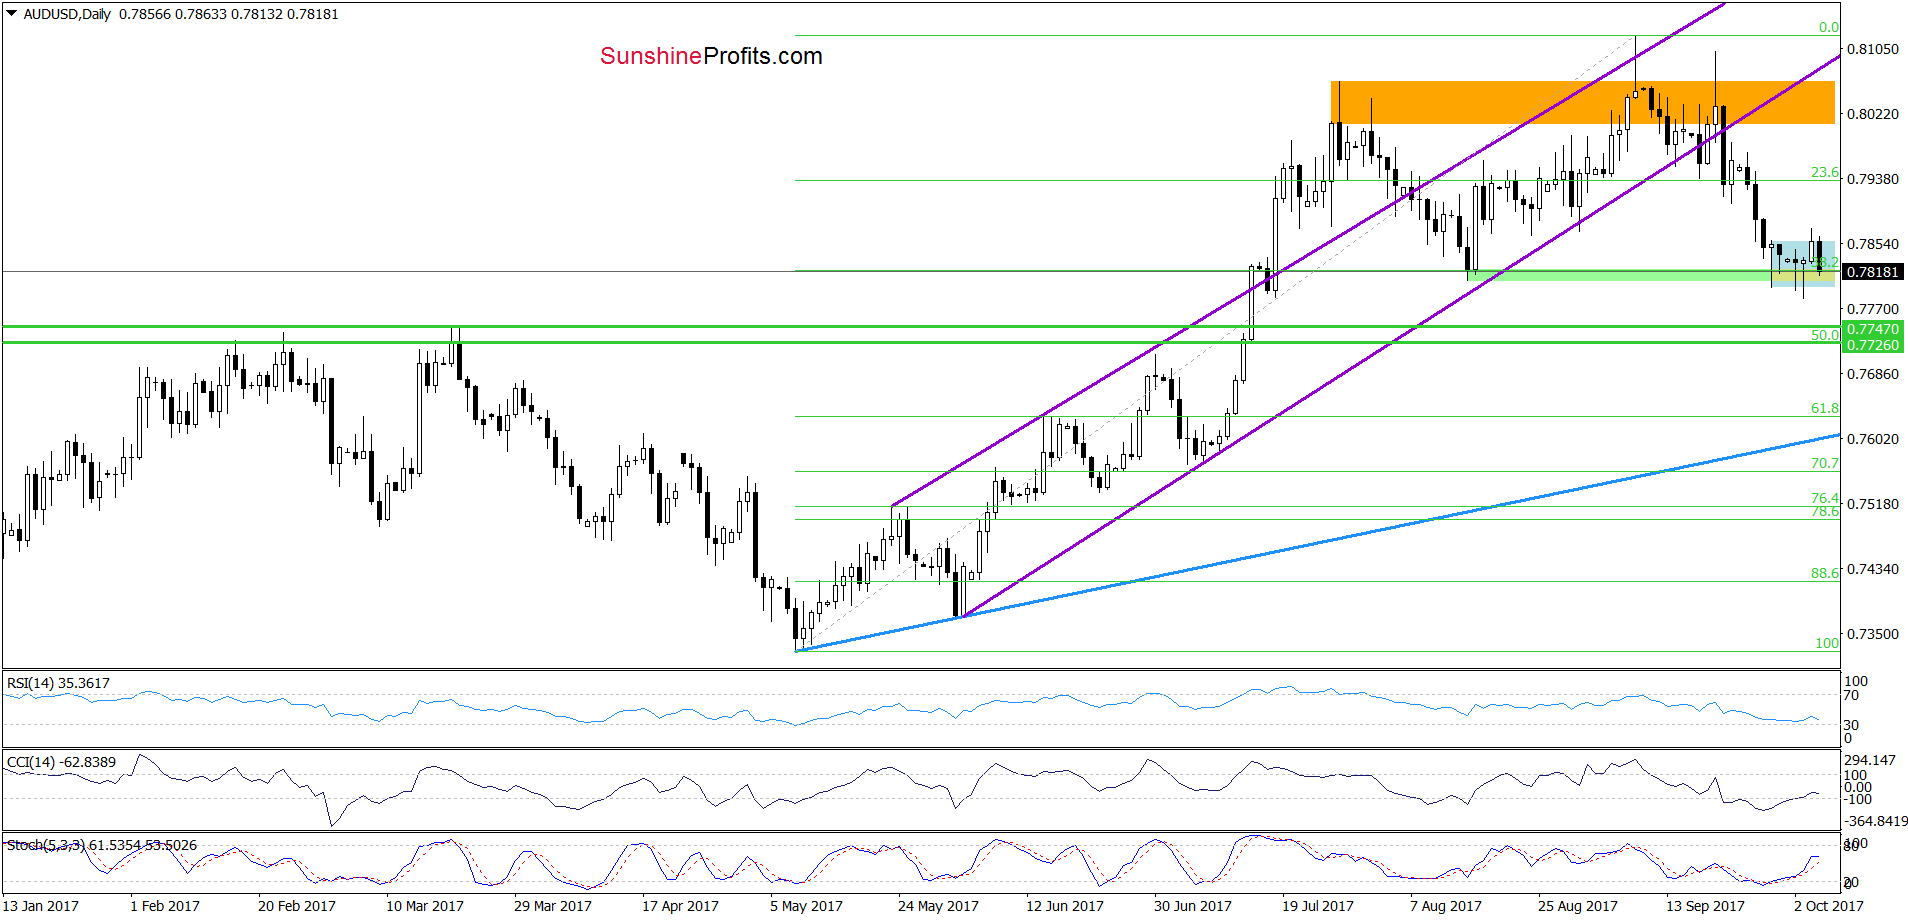
On the daily chart, we see that although the green support zone (created by the mid-August lows and the 38.2% Fibonacci retracement) triggered a rebound in recent days, currency bulls didn’t manage to hold gained levels, which resulted in a reversal and decline. Thanks to today’s drop AUD/USD invalidated the earlier tiny breakout above the upper border of the blue consolidation, which suggests that we’ll see (at least) a test of this week low in the coming day(s).
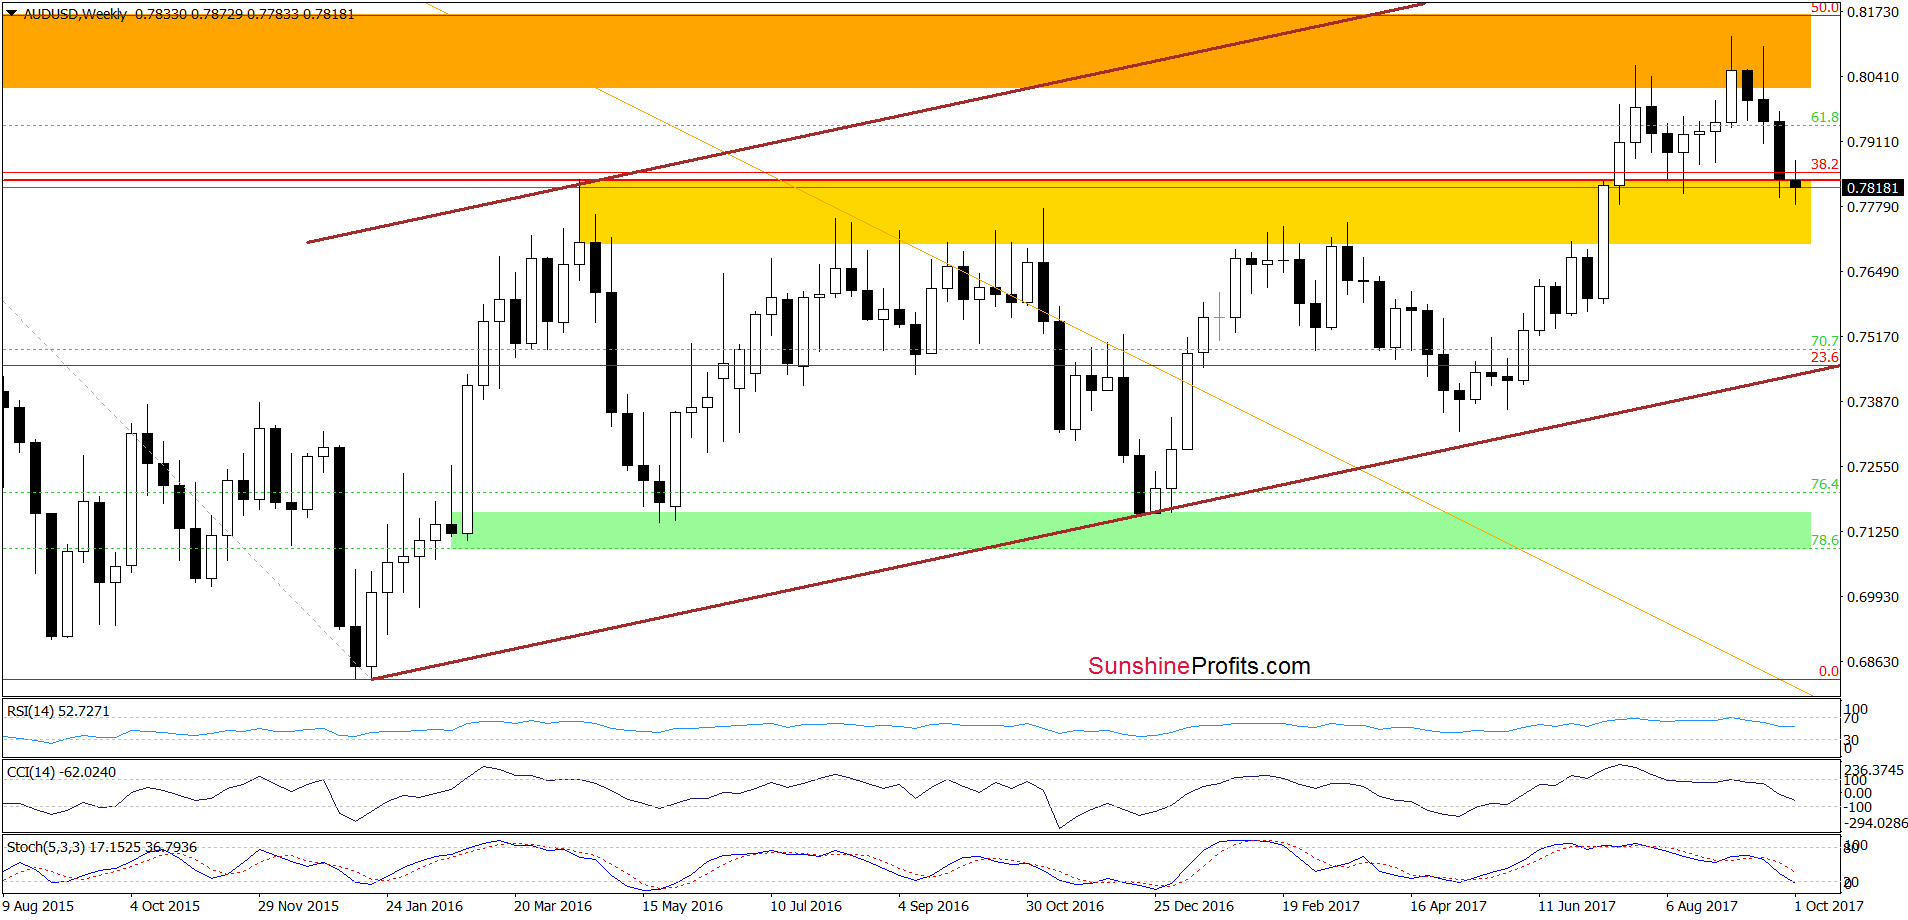
Nevertheless, taking into account the size of the recent rebound (it was visibly smaller than the move, which we saw in the second half of September), we think that the pair will decline even lower and test the next support zone created by the green horizontal lines based on the March peaks and the 50% Fibonacci retracement (based on the entire May-September upward move) in the coming week.
Very short-term outlook: mmixed with bearish bias
Short-term outlook: mixed
MT outlook: mixed
LT outlook: mixed
Naturally, the above could change in the coming days and we’ll keep our subscribers informed, but that’s what appears likely based on the data that we have right now. If you enjoyed reading our analysis, we encourage you to subscribe to our daily Forex Trading Alerts.
Thank you.
Nadia Simmons
Forex & Oil Trading Strategist
Przemyslaw Radomski, CFA
Founder, Editor-in-chief, Gold & Silver Fund Manager
Gold & Silver Trading Alerts
Forex Trading Alerts
Oil Investment Updates
Oil Trading Alerts
