
One of the most important factors contributing to the precious metals and commodities bull market is the overall economic health of the United States of America and the US Dollar, since it is the world’s main reserve currency. Should any problems with USD occur that would have a huge impact on the world economy. Precious metals have always been a safe haven, which helps to preserve and even multiply capital in such circumstances. All other things equal, gold moves in the opposite direction to the move in the USD. Some analysts even refer to gold as an anti-dollar. There’s more to the gold story than just the US Dollar, but that is definitely a very important factor. That is why precious metals investors need to watch Dollar’s performance very closely.
A lot has been written about the US Economy and the US Dollar’s fundamental problems which have a tremendous impact on the long-term situation in the market. There are many reasons as to why we think the USD will continue its slide in the LONG TERM. The purpose of this essay, however, is not to elaborate on that matter, but rather give you our comments on the current situation on the market. This is a matter of ‘when’ and ‘how far’, not necessarily ‘why’. This is why we will use the technical analysis to make our predictions in the short term.
One of the principles of this type of analysis is that the history repeats itself to a great extent. There are various ways of checking what type of price patter will most likely repeat on a given situation. Sometimes it’s the way the price moves with regard to a particular moving average, other time it’s one line of specific indicator crossing the other line, but what we feature in this analysis is a powerful combination of several different tools.
Our main point is that from a short term perspective dollar is probably going to rise and test the levels it achieved a few weeks earlier. We will present two charts (courtesy of StockCharts.com) of the USD Index to support our opinions. The first charts presents the big picture.
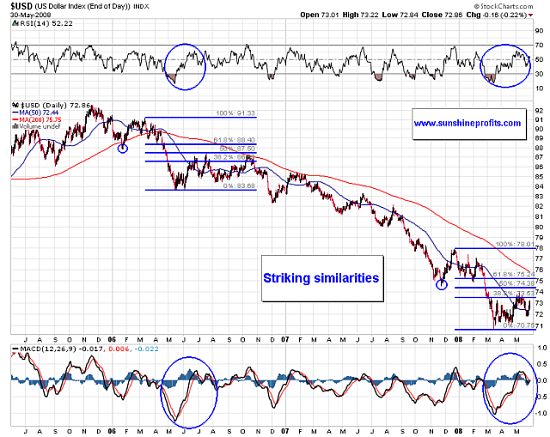
On the chart above one can see that there are at least several similarities between now and the year 2006. The USD Index falls dramatically, confirms the bottom, then rallies in a zigzag (or ABC if you prefer to call it this way) fashion. The first ‘A’ local top in June 2006 was ended just in the middle between the 38.2% and 50% Fibonacci retracement levels. Exactly the same took place just a few weeks ago. The final ‘C’ upswing of this zigzag correction took the USDX up to the 50% retracement level, just above the previous top and very close to the bottom prior to the dramatic fall. If you take a look at the current situation with the previous comments in mind, it becomes obvious that all of those resistance levels also shape in a similar way right now.
Taking a look at the moving averages confirms this assumption – after bottoming in 2006 the price rose over the 50DMA (day moving average), then fell just below it, to finally go to a level just above the middle between the 50DMA and 200DMA. After bottoming the USDX rose just above the 50DMA and then fell just below it several days ago.
Another thing to look at are the indicators. We have to digress here: indicators are just a mathematical transformation of the price, sometimes volume and/or open interest and should only be viewed as such. In our opinion, neither of them is a perfect ‘crystal ball’, though some speculators choose to open or close their positions basing solely on them. Naturally, if you choose to do so that is fine with us, you are free to use your capital in any way you want. As far as we are concerned, we prefer to combine a lot of different approaches before conducting a transaction.
In the above analysis we use the indicators to check whether the transformations of the price are also similar now and in 2006. We used two of the most popular ones: RSI (the Relative Strength Index) and the MACD (Moving Average Convergence Divergence). It appears that both of these indicators show striking similarities between current events and the situation on the market two years ago.
Before making specific conclusions let’s take a look at more detailed chart.
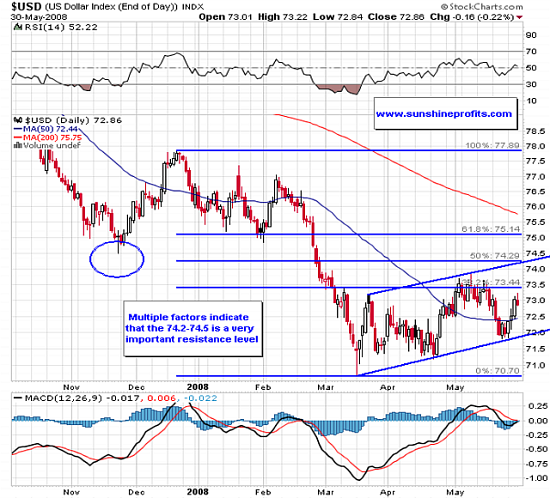
On a medium term chart it is visible that there is one more apparent reason to expect the 74.2 – 74.5 level to be a very important resistance level. That is the upper trend line of the channel in which USDX currently trades. As you can see the rising trend line, the 50% Fibonacci retracement level and the November 2007 bottom all point to this level as a resistance. Will it stop the USDX rally? Only the time will tell, but we personally believe that it will, at least for a few months, just like it happened two years earlier. Taking into account the fact that the price of gold moves generally in the opposite direction to the US Dollar, we may experience testing or even temporary breaking below the previous lows in the precious metals. This means gold in the $850 level and silver in the $16 level or probably even lower.
Of course the market might prove us wrong, as nobody can be right 100% of the time. Should that take place or should our projections materialize we will send an update to our registered Users along with suggestions on how to take advantage of it. Register today to make sure you won’t miss this free, but valuable information. You’ll also gain access to our Tools section. Registration is free and you may unregister anytime.
P. Radomski
Back