

Gold is turning vigorously lower. And not only gold at that. Red, red, everywhere in precious metals you look. The silent scream we wrote about yesterday brought serious repercussions. In this article, we devote extraordinary attention to the short-term picture throughout the PMs complex. Stay tuned as in the coming day(s) we’ll explain here how it affects the long-term charts and the 2012-2013 – now link in gold. That will be so much more than a great and actionable summary.
Yesterday’s alert was quick and timely as it was important to keep our subscribers informed as gold and silver approached their resistance levels. Today, both metals are moving lower in the pre-market trading- silver erased more than 48 hours of gains and gold more than 24 hours of gains.
Let’s being with a look at the overnight performance. It’s important because it shows prices are already much lower than it might appear based on the daily charts.
Feeling the Pulse of Gold, Silver and USD Index
A few hours can make a lot of difference, especially for the silver price. Silver is not only below yesterday’s lows – it’s also below Tuesday’s lows. About 15 cents below them. The attempt to ignite a rally seems to have failed. In case of gold, it’s not as crystal clear, but still clear enough. The yellow precious metal moved below yesterday’s lows, invalidating the entire daily gain. It’s almost as low as it was 48 hours before. This means that the $1,310 level that we described as strong resistance, has indeed held. This adds the necessary context to the following daily charts.
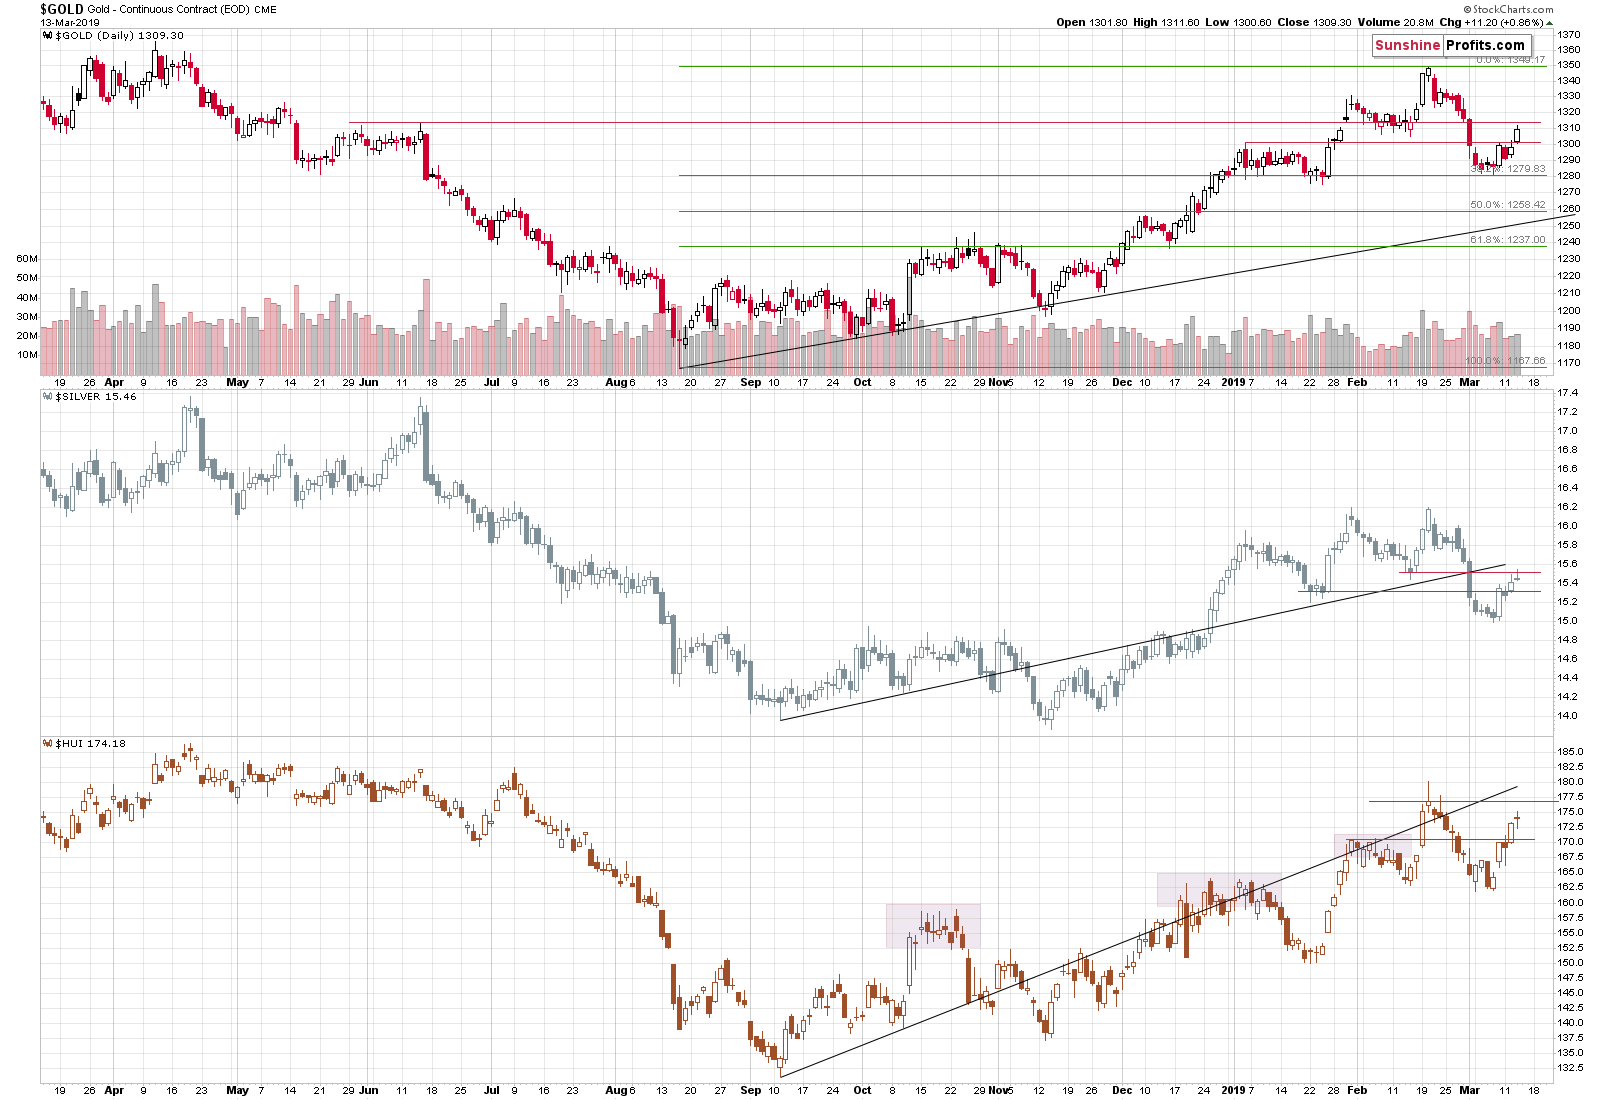
On the above chart, we see that silver reversed, that miners moved higher, but only a bit, and that gold rallied. Based on the previous intraday charts, we already know that both precious metals have already invalidated yesterday’s strength and that there was no breakout above the resistance levels.
We warned that if the USD Index declines once more before rallying, PMs might move a bit higher, but that it would likely not be anything to call home about – and it seems that is exactly what has happened.
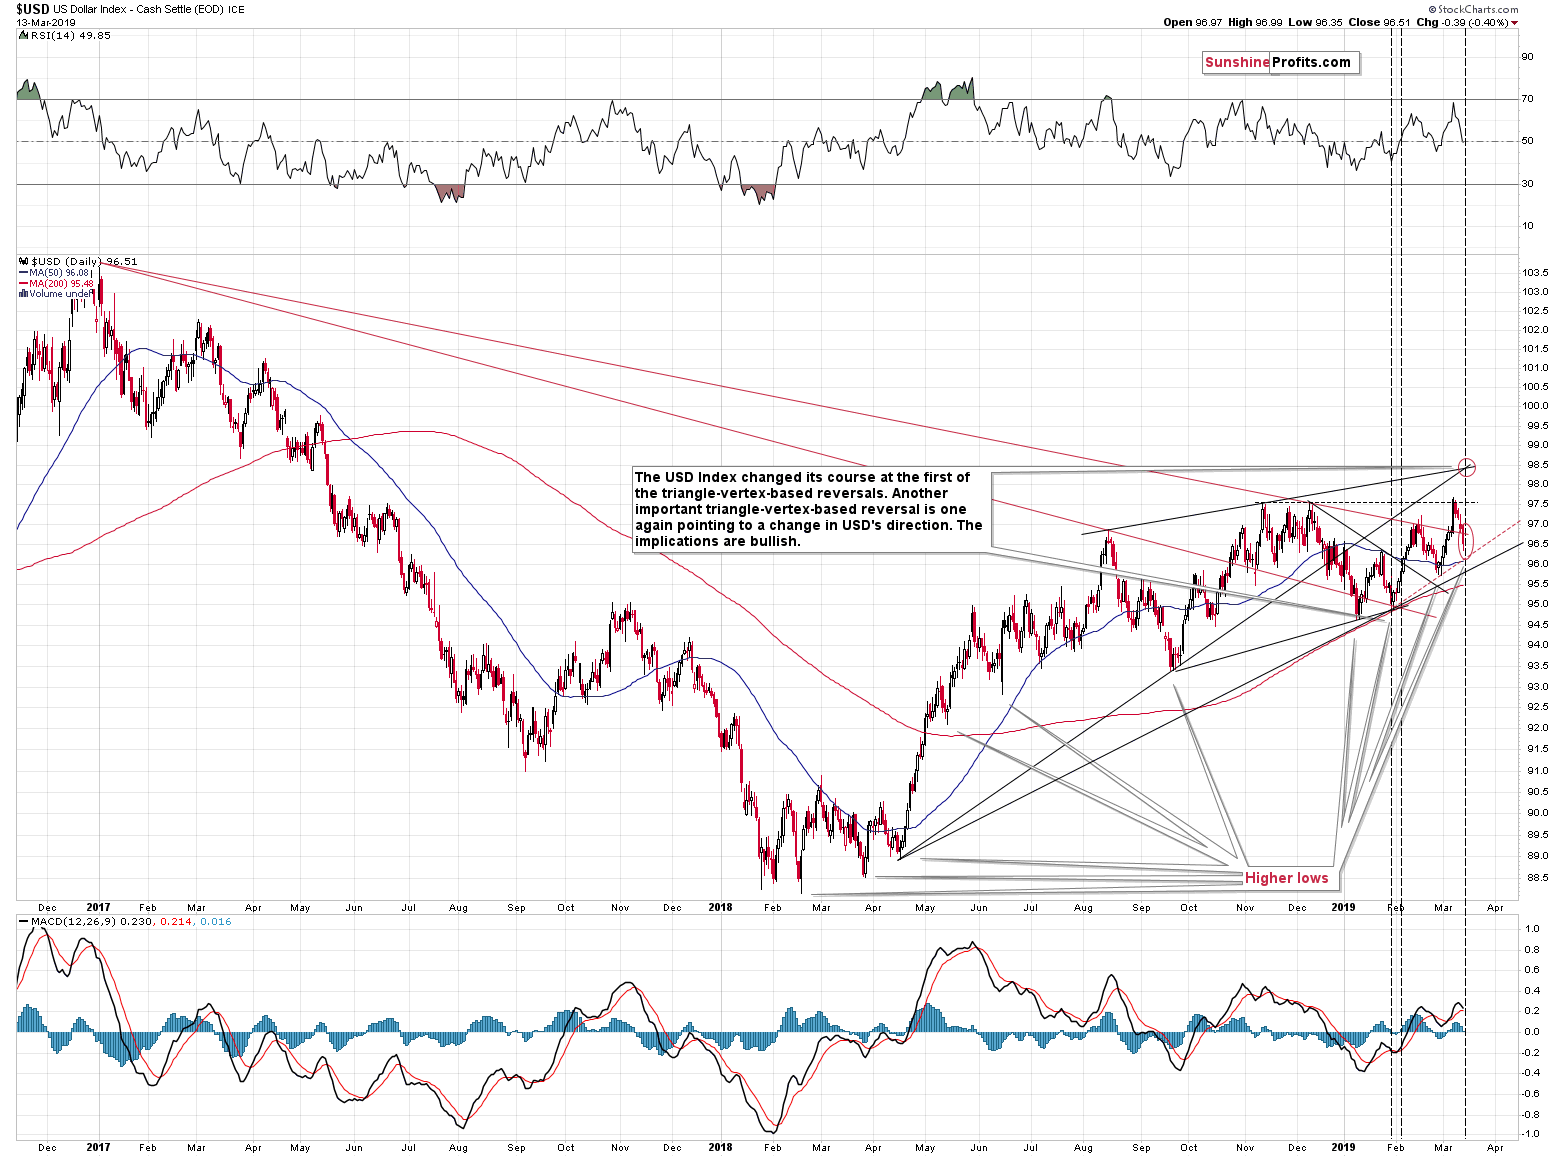
The USD Index moved to the lower one of our mid-March target areas.
What’s so special about the middle of March? Why are the targets at that time?
It’s because of the triangle-vertex-based reversal that suggested an important top or bottom in mid-March. Please note how well this technique worked previously – after the first month of the year, the USDX bottomed and moved to new yearly lows. Based on the most recent short-term decline, it seems that the next turnaround is going to be a local bottom or that the bottom has already formed.
Before moving back to the PMs, please take a look the bottoms that we saw since early 2018. For more than a year, we’ve been seeing higher lows. We also saw higher highs on average, but it’s not as clear, as it is in case of the bottoms. This is the very definition of a bull market – higher highs and higher lows.
It’s also interesting that the pace of growth of the USD Index declined after May 2018. You see, the USDX has actually… Corrected after the powerful April – May 2018 upswing. It’s not clearly visible, because it’s a running correction. This is the kind of correction where the market needs to take a breather, but it’s actually too strong to decline during this correction, so it just moves sideways. It’s characteristic of only the strongest bull markets for the sideways movement to take the price higher on average. And that’s exactly what we saw in case of the USD index.
When the USD Index breaks above the corrective pattern, it’s likely to soar and take the PMs to much lower levels. And it seems that it’s about to take place.
Moving back to the PMs, we would like to point your attention to the way silver corrected.
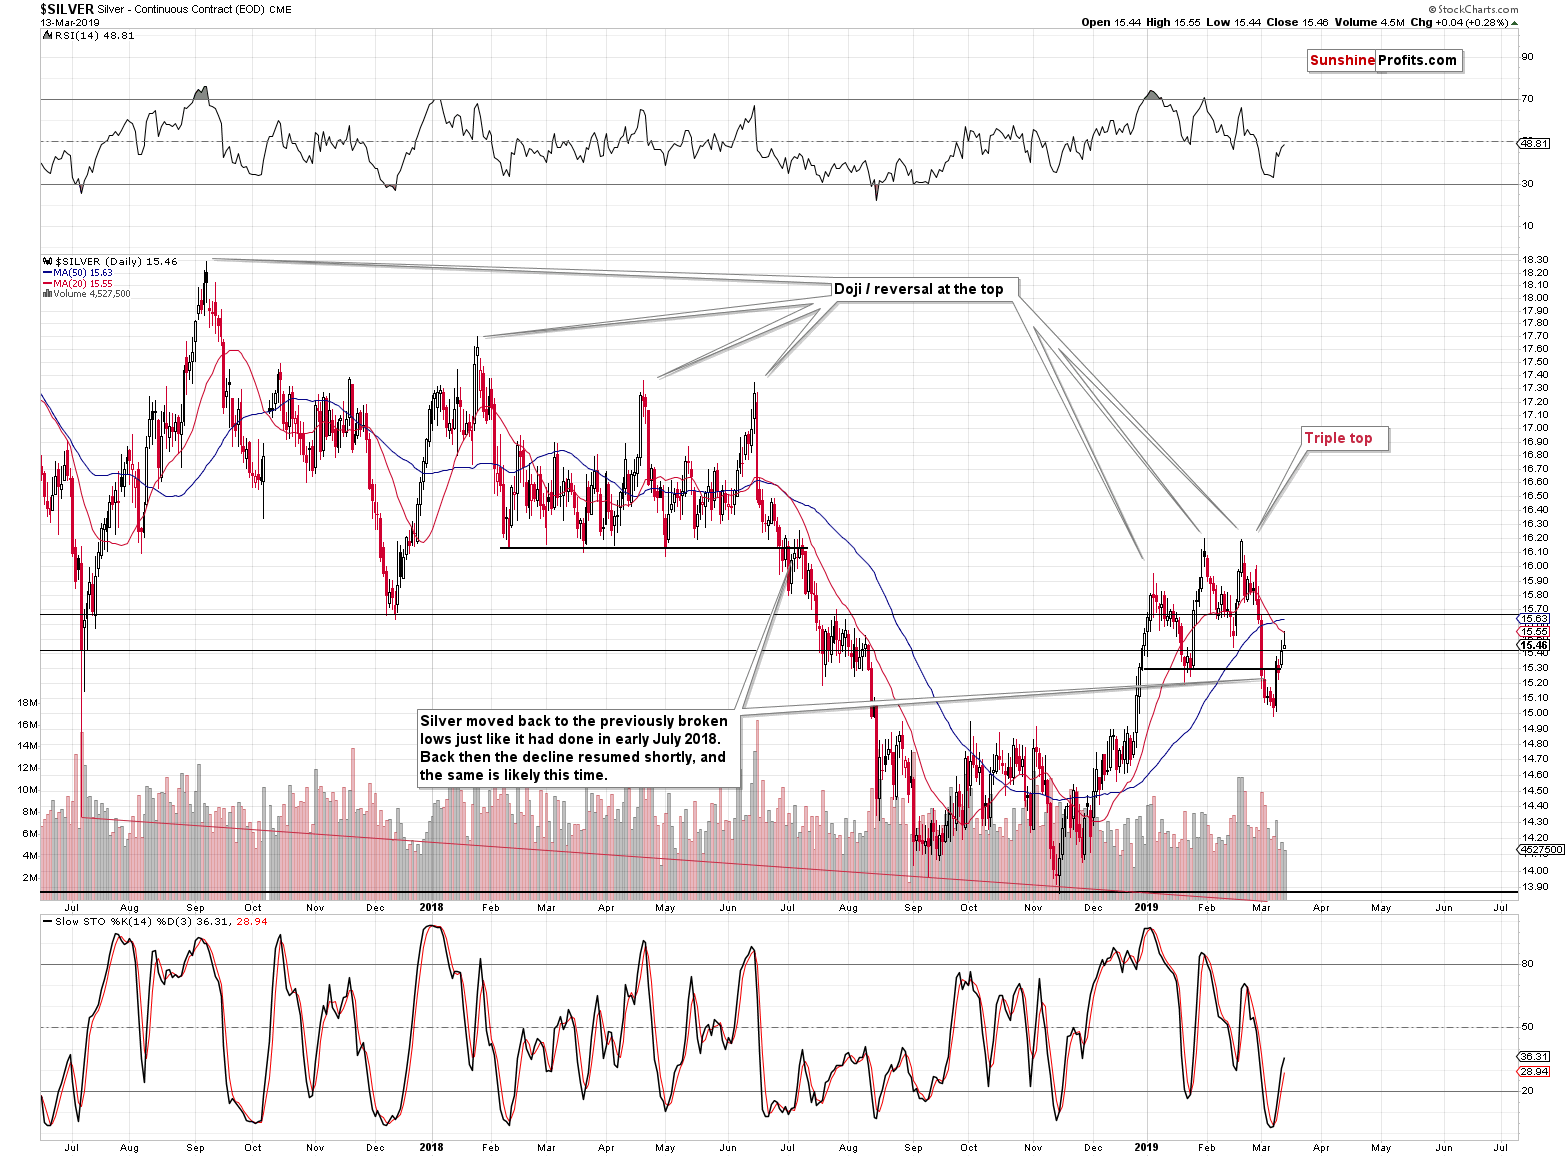
The move in the white metal is very similar to what we saw in July 2018. In particular, its similar to both situations: from July’s beginning, and from its final part. Silver moved back to the previous low and to the 20-day moving average (marked with red). Silver’s shooting star candlestick is also a bearish indication because that’s the way in which silver ended the early-July 2018 correction. Yesterday’s reversal was not confirmed by strong volume, which would be a concerning factor if it wasn’t for two facts:
- The early-July 2018 reversal also formed on relatively low volume
- It’s silver. Many general technical rules don’t apply to silver or they apply, but in a non-standard way (silver’s breakouts often turn into fakeouts etc.). This is what makes silver so difficult to trade for beginners.
The implications for short-term precious metals charts are bearish.
The full version of the above analysis also includes the analysis of silver, gold miners and the omnipotent USD Index. These provide vital clues as to the next short-term moves and additional analytical strength. If you’d like to read the full version and receive follow-ups (including the intraday ones, when things get hot), we invite you to subscribe to our Gold & Silver Trading Alerts today.
Thank you.
Przemyslaw Radomski, CFA
Editor-in-chief, Gold & Silver Fund Manager
Sunshine Profits - Effective Investments through Diligence and Care
