

Earlier today, the U.S. dollar moved sharply lower against the yen as demand for safe-haven assets increased after yesterday’s South Korea’s Defense Ministry commentaries. As a result, USD/JPY slipped under important support line once again, invalidating the earlier breakout. What does it mean for the exchange rate?
EUR/USD
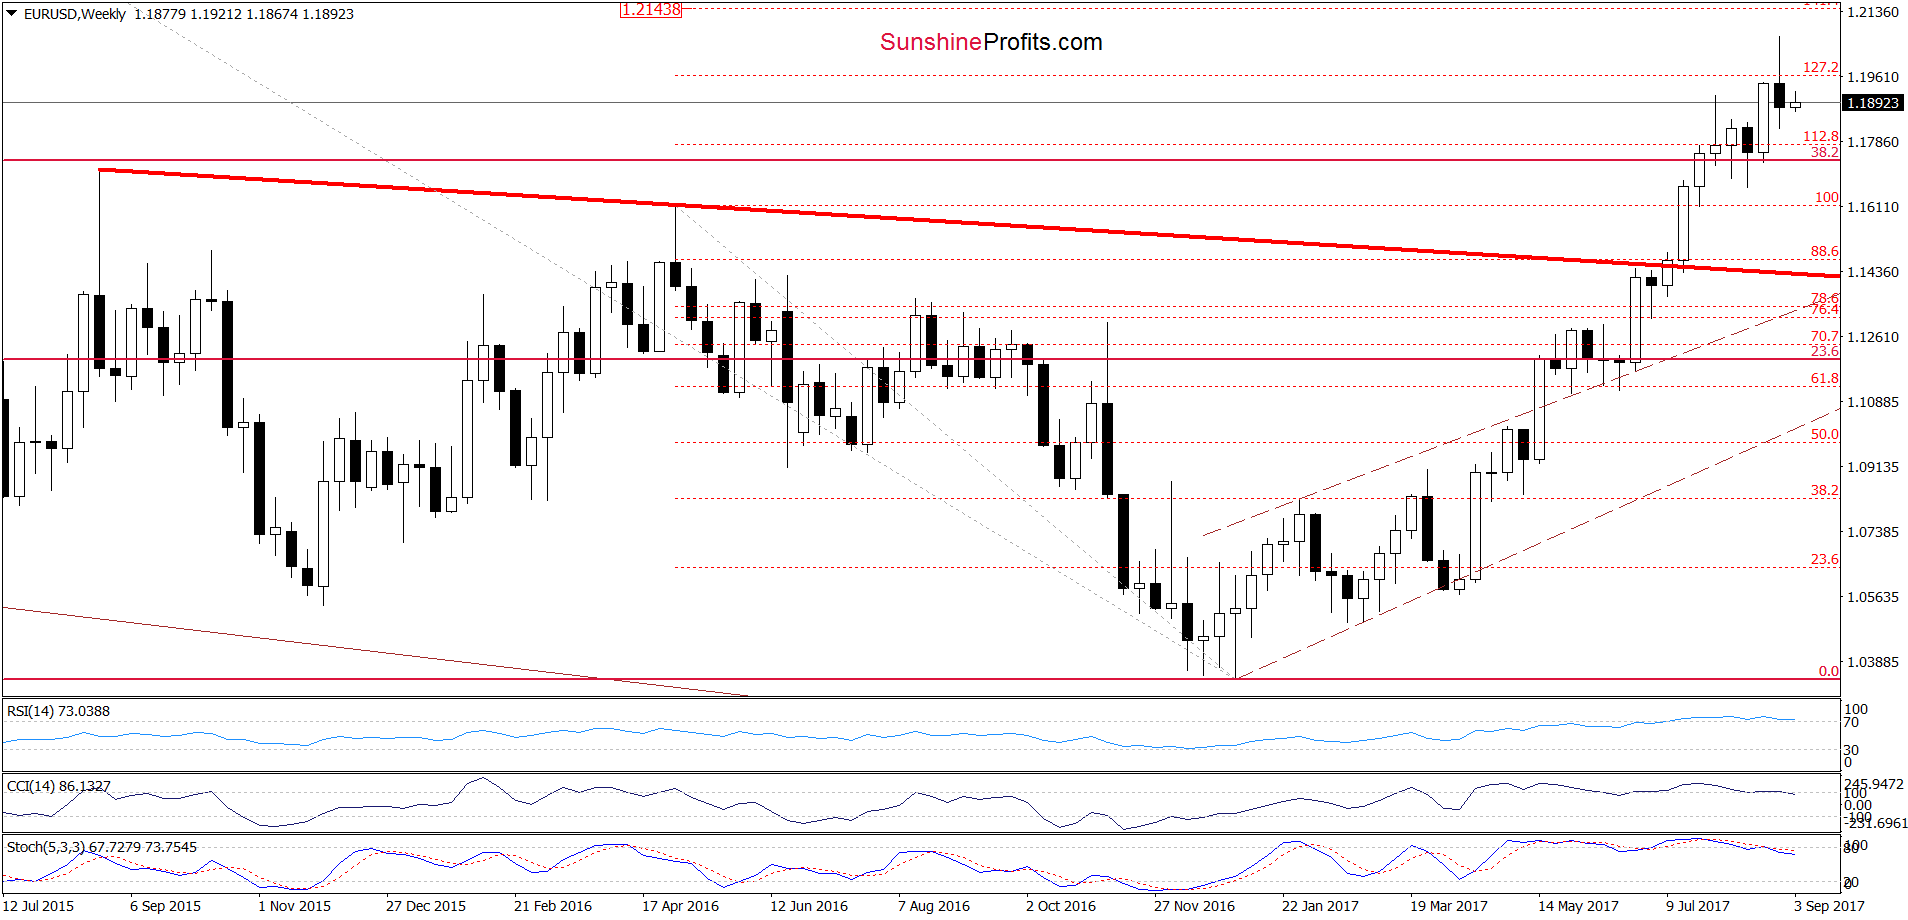
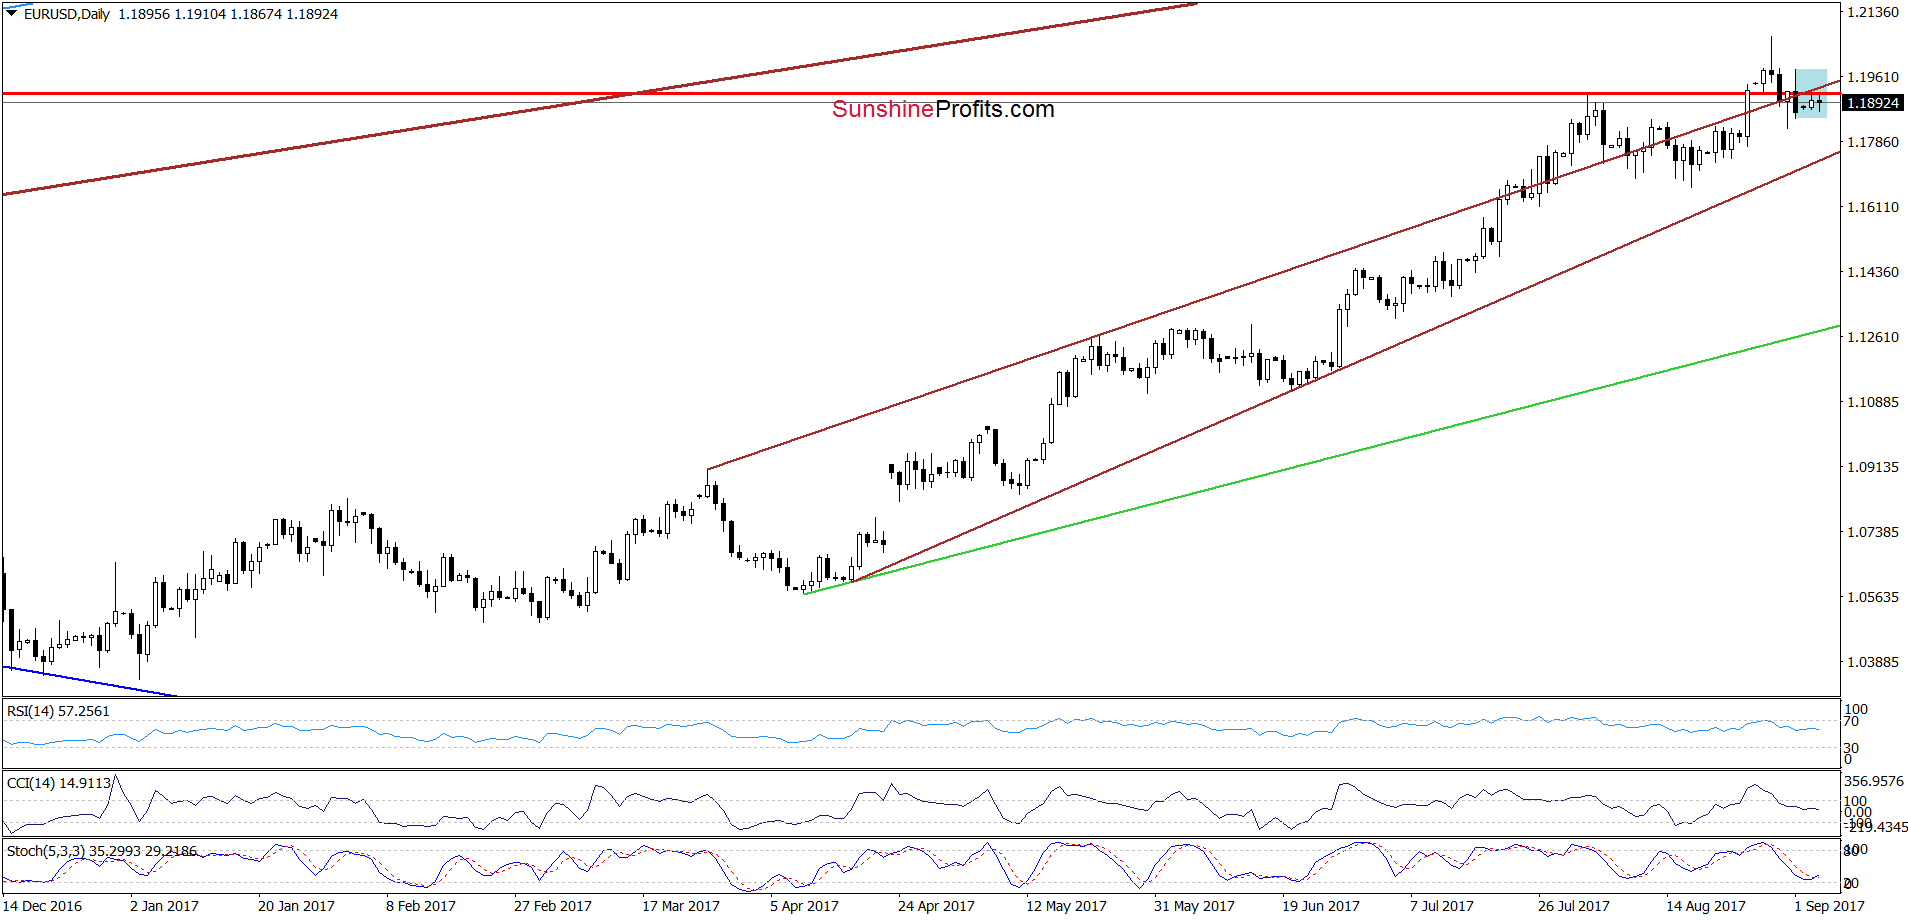
From today’s point of view, we see that the overall situation hasn’t changed much in recent days as EUR/USD remains in the blue consolidation under the previously-broken 127.2% Fibonacci extension, the early August peak and the upper border of the brown rising wedge. This means that an invalidation of the breakout above these levels and its potential negative impact on the exchange rate is still in effect, suggesting another attempt to move lower in the coming days.
How low could the pair go? In our opinion, the first downside target for currency bears will be around 1.1740, where the lower border of the brown rising wedge is. If this support is broken, we can see a decline to around 1.1466, where the 38.2% Fibonacci retracement based on the entire February-August upward move is.
Very short-term outlook: mixed with bearish bias
Short-term outlook: mixed with bearish bias
MT outlook: mixed
LT outlook: mixed
USD/JPY
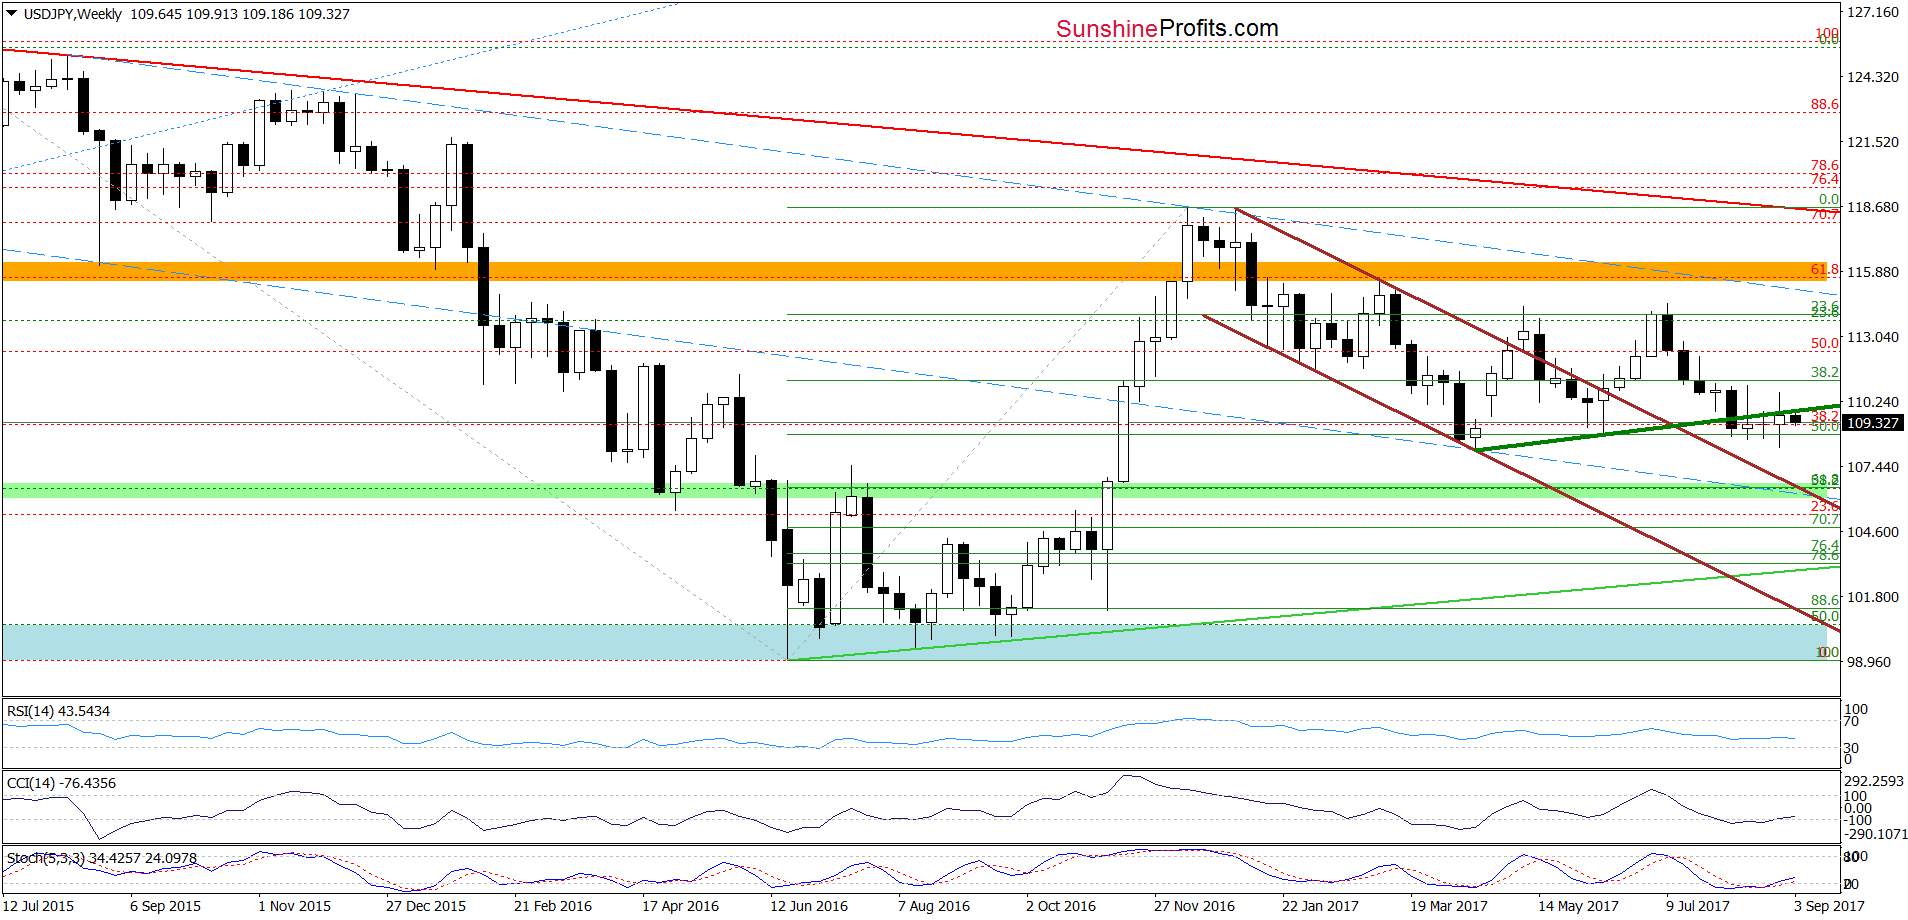
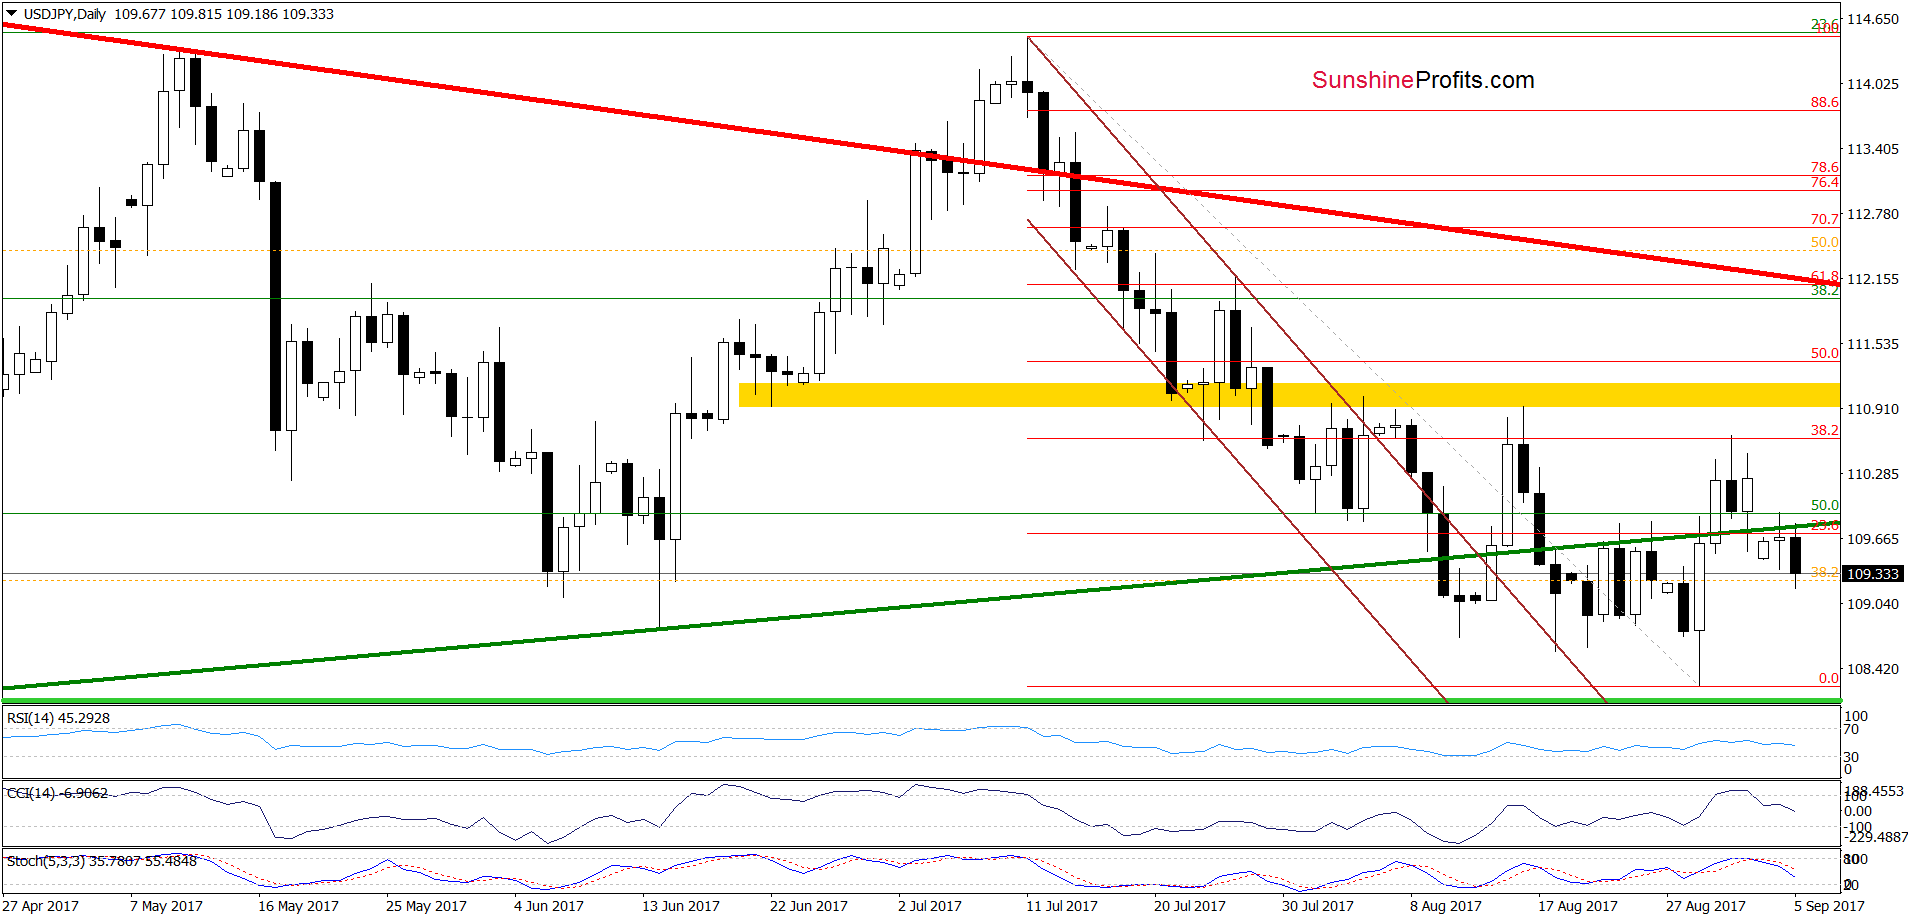
The first thing that catches the eye on the above chart is an invalidation of the breakout above the medium-term green line, which is a bearish development. When we take a closer look at the daily chart, we can notice a similar price action in the previous month. Back then, such situation preceded fresh lows, which suggests that further deterioration and a test of the recent lows (area between 108.25 and 108.90) should not surprise us in the coming days – especially when we factor in the sell signals generated by the daily indicators.
Very short-term outlook: mixed with bearish bias
Short-term outlook: mixed
MT outlook: mixed
LT outlook: mixed
AUD/USD
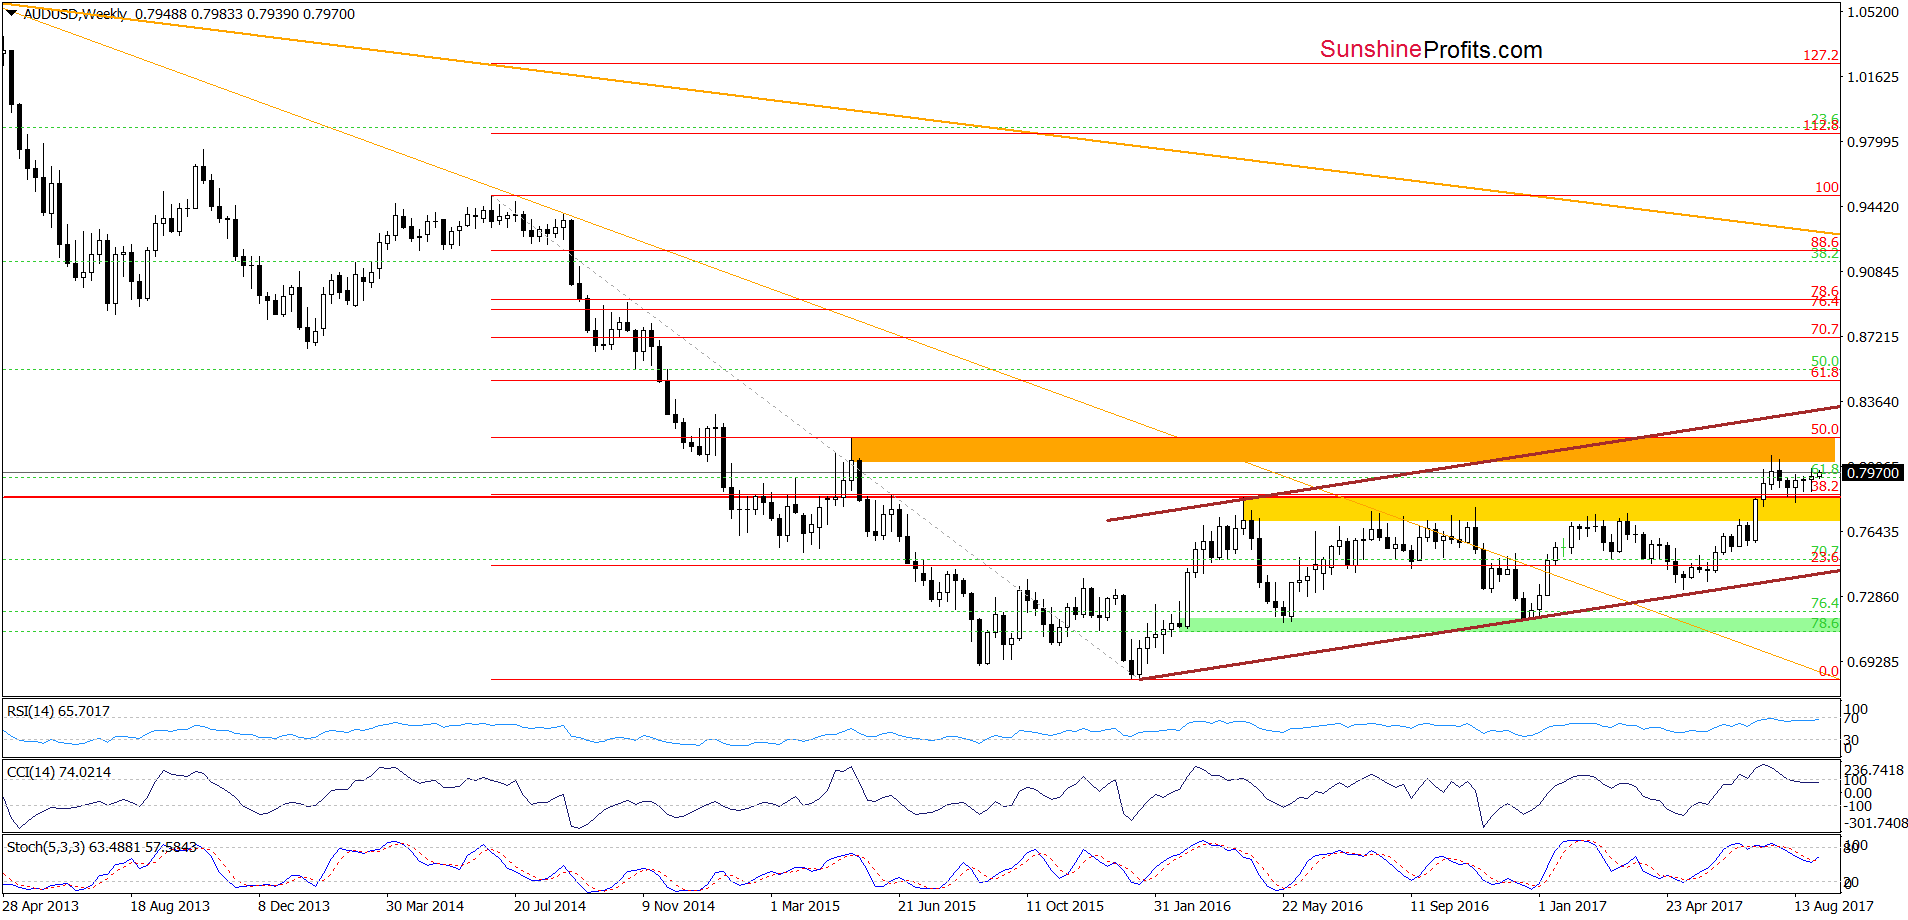
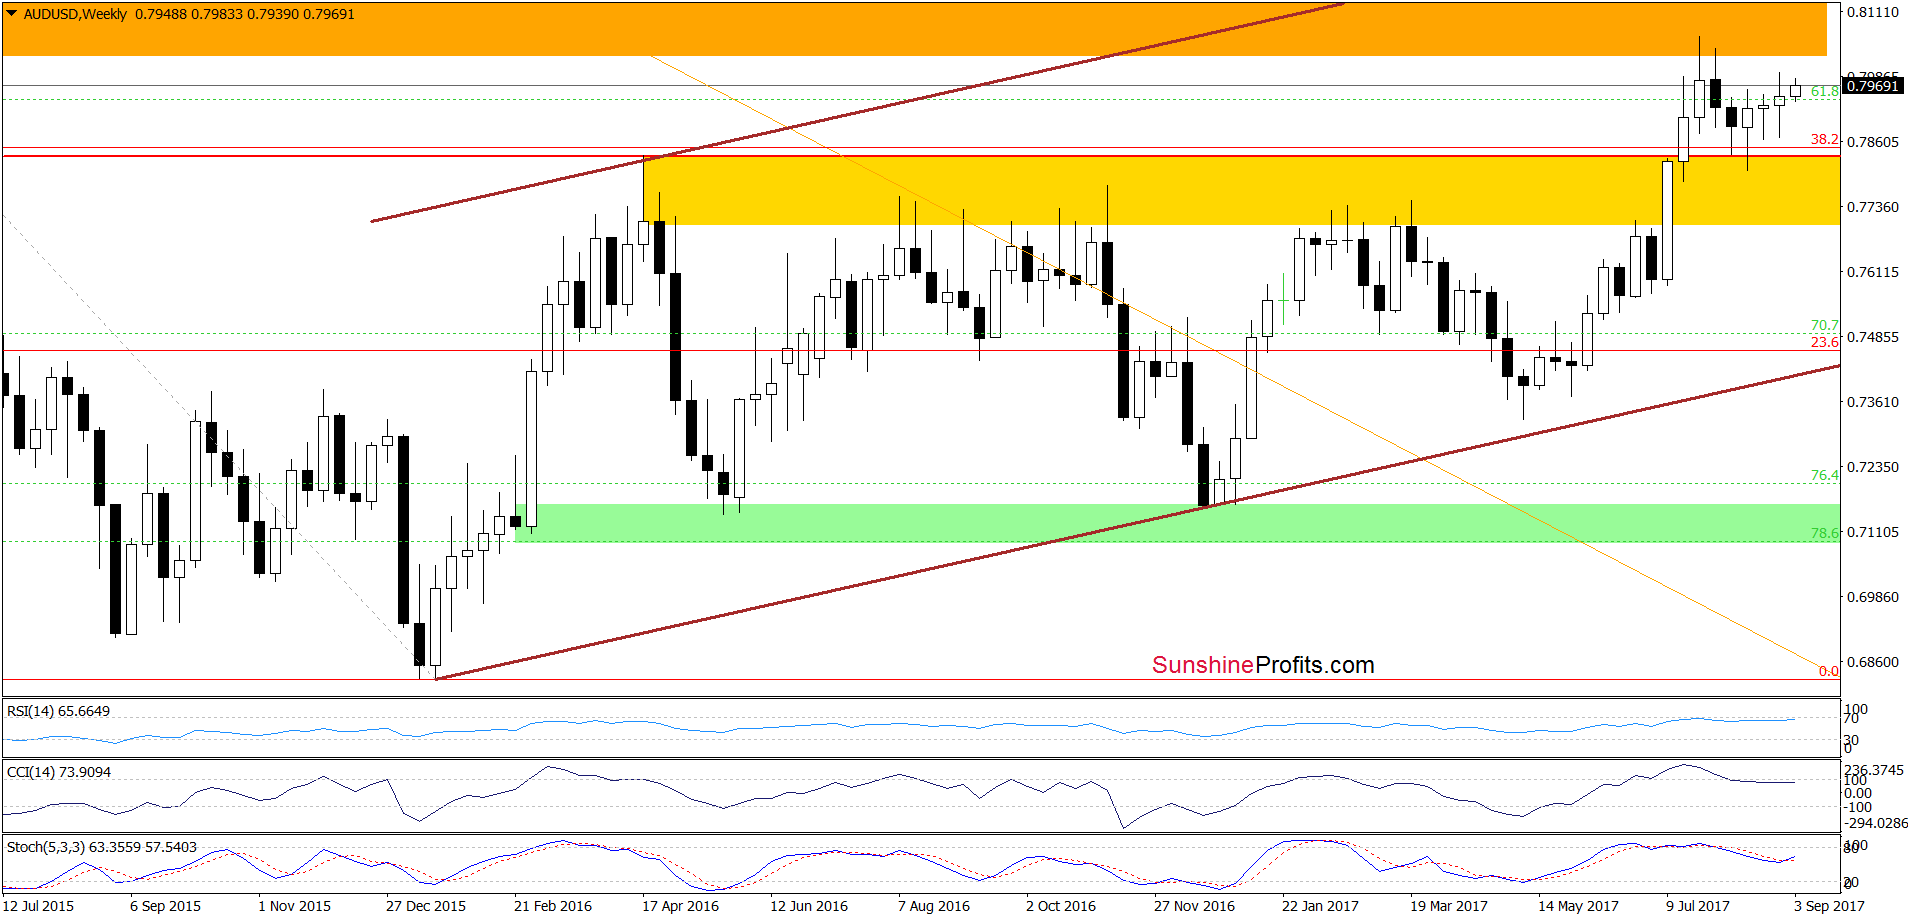
Looking at the medium-term chart, we see that the technical picture of AUD/USD remains almost unchanged as the exchange rate is still trading between the range resistance zone and the yellow support area.
Will the daily chart give us more clues about future moves? Let’s check.
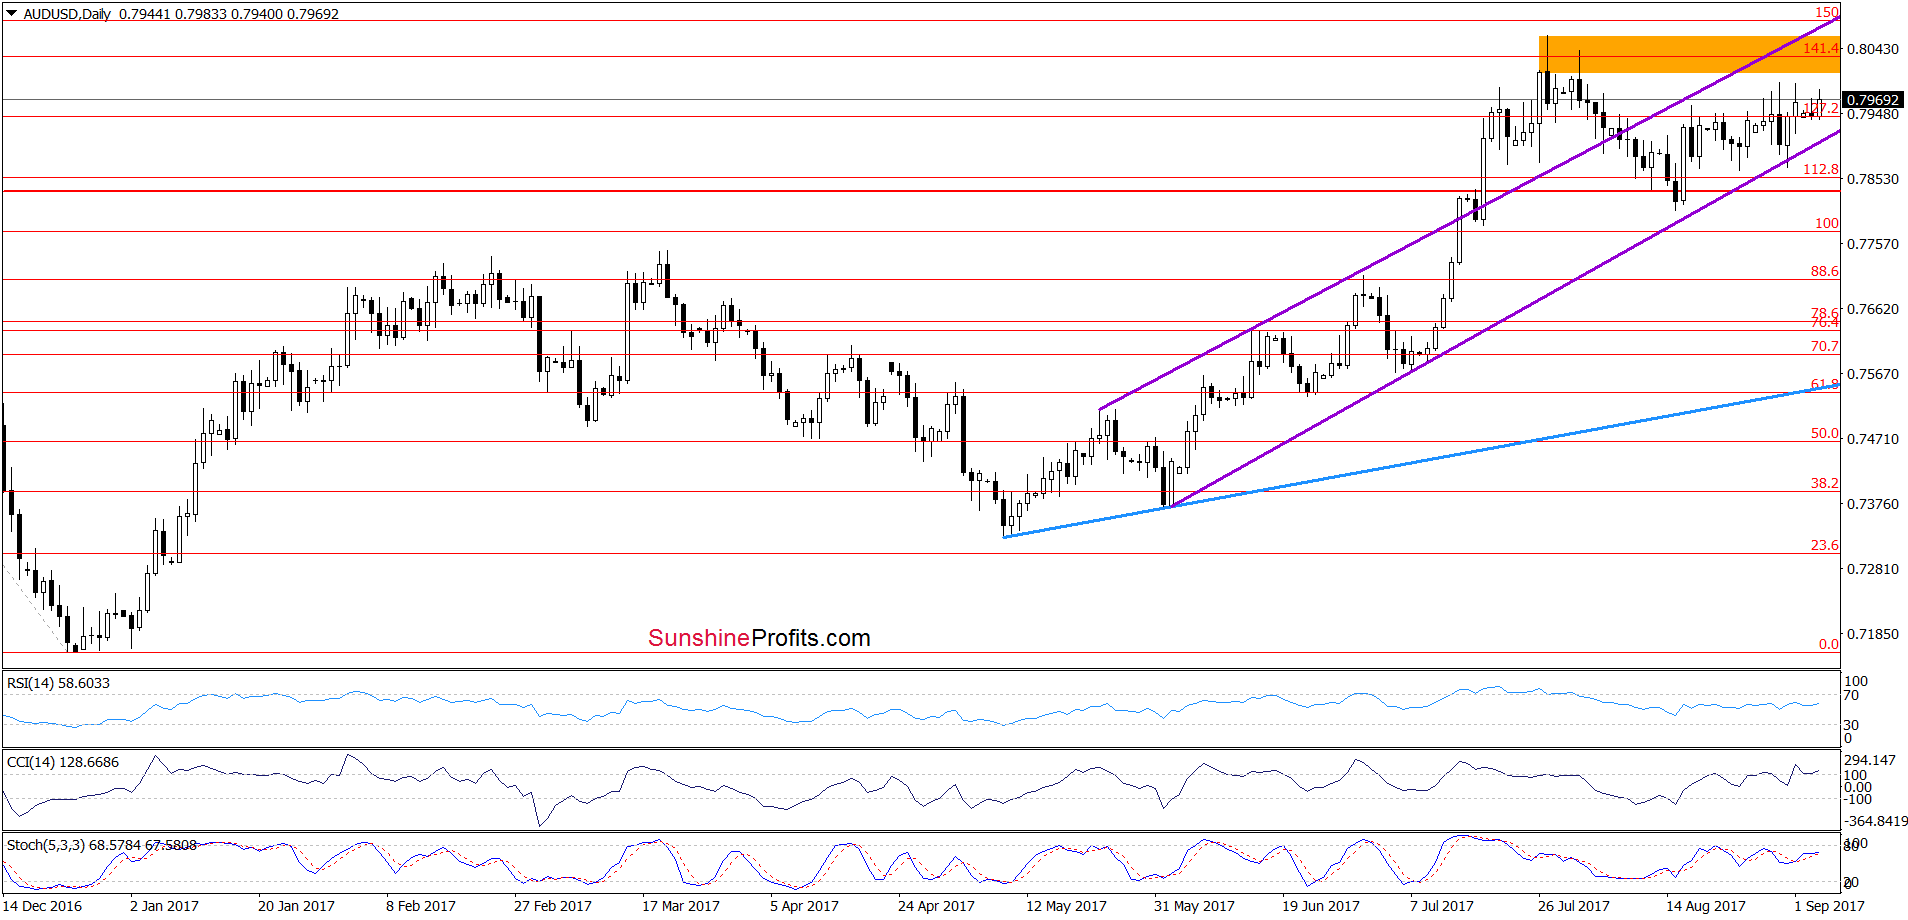
From the very short-term perspective, we see that AUD/USD invalidated the tiny breakdown under the lower border of the purple rising trend channel, which together with the buy signals generated by the daily indicators (they still remain in place), suggests that we’ll likely see a test of the orange resistance zone, the recent highs or even the upper border of the purple rising trend channel in the coming days.
Very short-term outlook: mixed with bullish bias
Short-term outlook: mixed
MT outlook: mixed
LT outlook: mixed
Naturally, the above could change in the coming days and we’ll keep our subscribers informed, but that’s what appears likely based on the data that we have right now. If you enjoyed reading our analysis, we encourage you to subscribe to our daily Forex Trading Alerts.
Thank you.
Nadia Simmons
Forex & Oil Trading Strategist
Przemyslaw Radomski, CFA
Founder, Editor-in-chief, Gold & Silver Fund Manager
Gold & Silver Trading Alerts
Forex Trading Alerts
Oil Investment Updates
Oil Trading Alerts
