

From the beginning of the week the situation of currency bulls was not very favorable. Their lack of strength to continue the last week's march to the north in combination with the breakdown below an important support line awakened the imagination of the sellers and pushed the currency pair to a fresh December low earlier today. Are there any supports on the horizon that can save the buyers from further declines?
EUR/USD – Breakout and Its Potential Implications
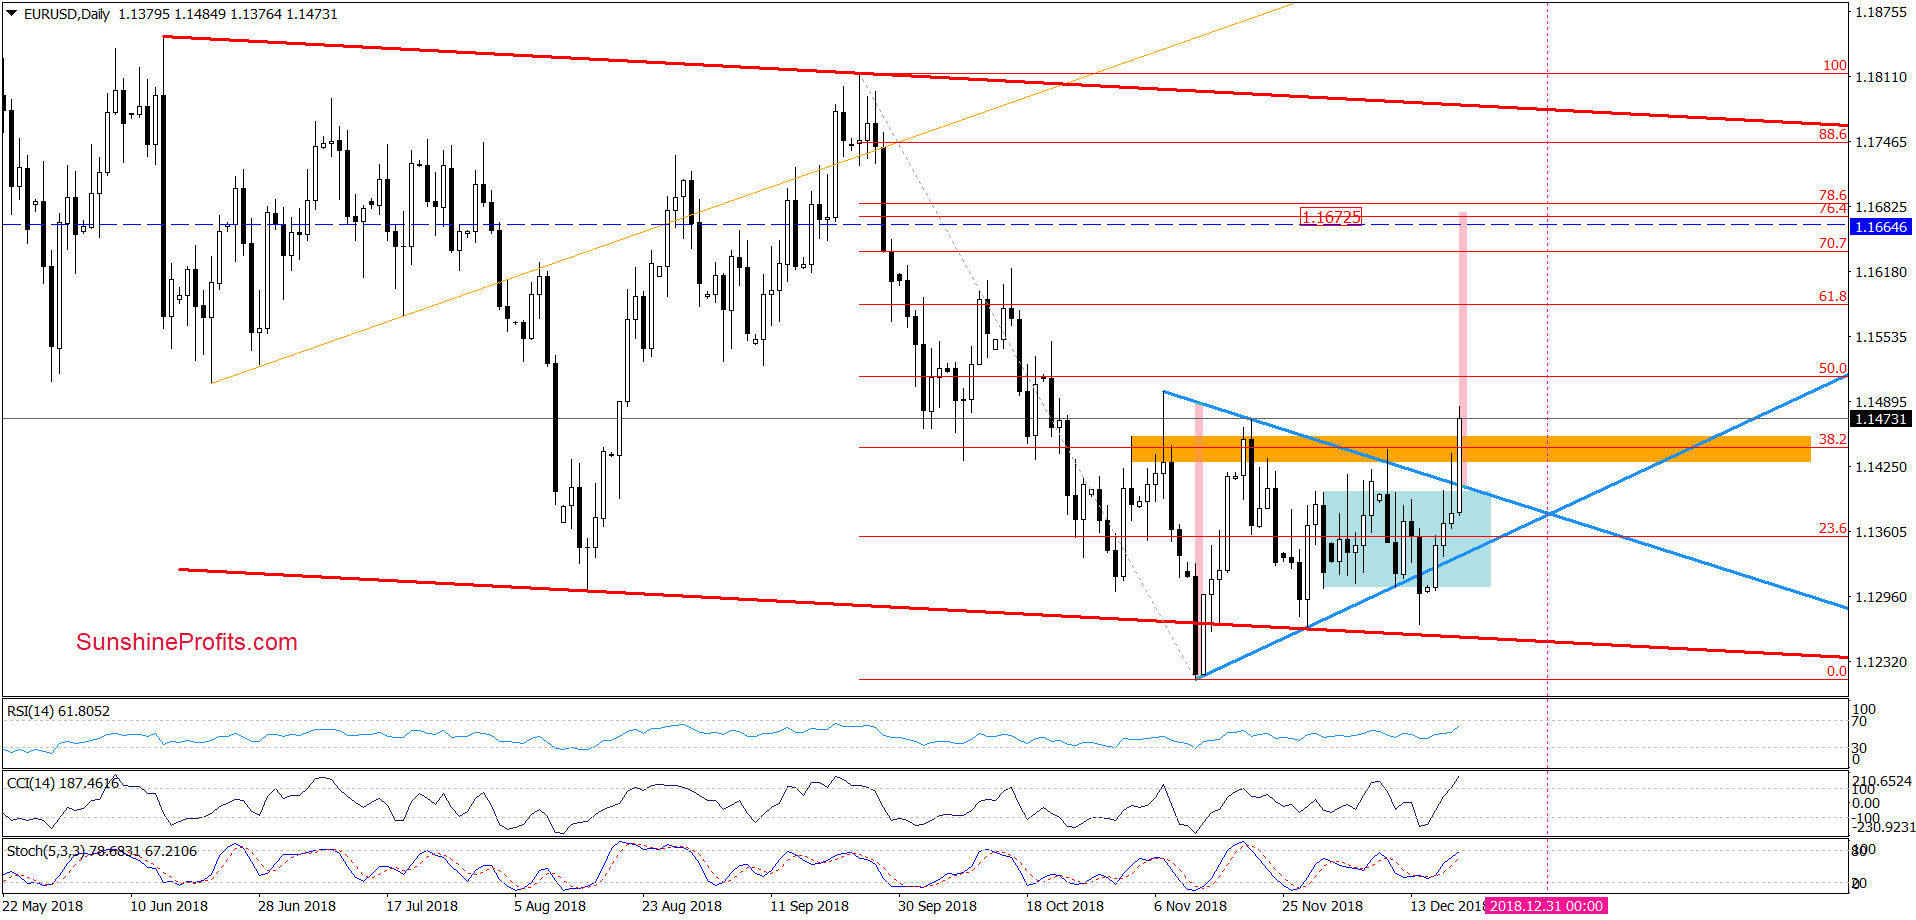
On Monday, we wrote that although EUR/USD broke below the lower border of the blue consolidation and the lower line of the blue triangle, currency bulls managed to trigger a rebound (…)
Thanks to their determination, the exchange rate came back above both previously-broken supports, invalidating Friday’s breakdowns. This is a bullish development, which in combination with the current position of the daily indicators (the CCI and the Stochastic Oscillator generated buy signals) suggests further improvement in the following days – especially if currency bulls close today’s session above both blue lines.
How high can the pair go?
In our opinion, if we see a daily closure inside the triangle and the consolidation, the buyers will likely extend gains and test the upper borders of both formation in the very near future (currently at around 1.4002-1.1412).
From today’s point of view, we see that the situation developed in tune with the above assumption and EUR/USD increased sharply earlier today. Thanks to this increase, the exchange rate broke not only above the upper border of the blue consolidation, but also above the upper line of the blue triangle and the orange resistance zone, which stopped the buyers several times in the previous weeks.
This is a bullish development, which suggests further improvement in the following days – especially when we factor in the buy signals generated by the indicators, which continue to support higher values of the exchange rate.
How high can the bulls go?
Taking into account today’s breakout above the upper border of the triangle, it seems that EUR/USD can climb even to around 1.1677, where the size of the upward move will correspond to the height of the formation.
Nevertheless, in our opinion, the pro-growth scenario will be more likely and reliable if the pair closes today’s session above all these resistances. If we see such price action, the bulls will have to face with the 50% and 61.8% Fibonacci retracements before completing the aforementioned scenario.
USD/JPY under Bears’ Pressure
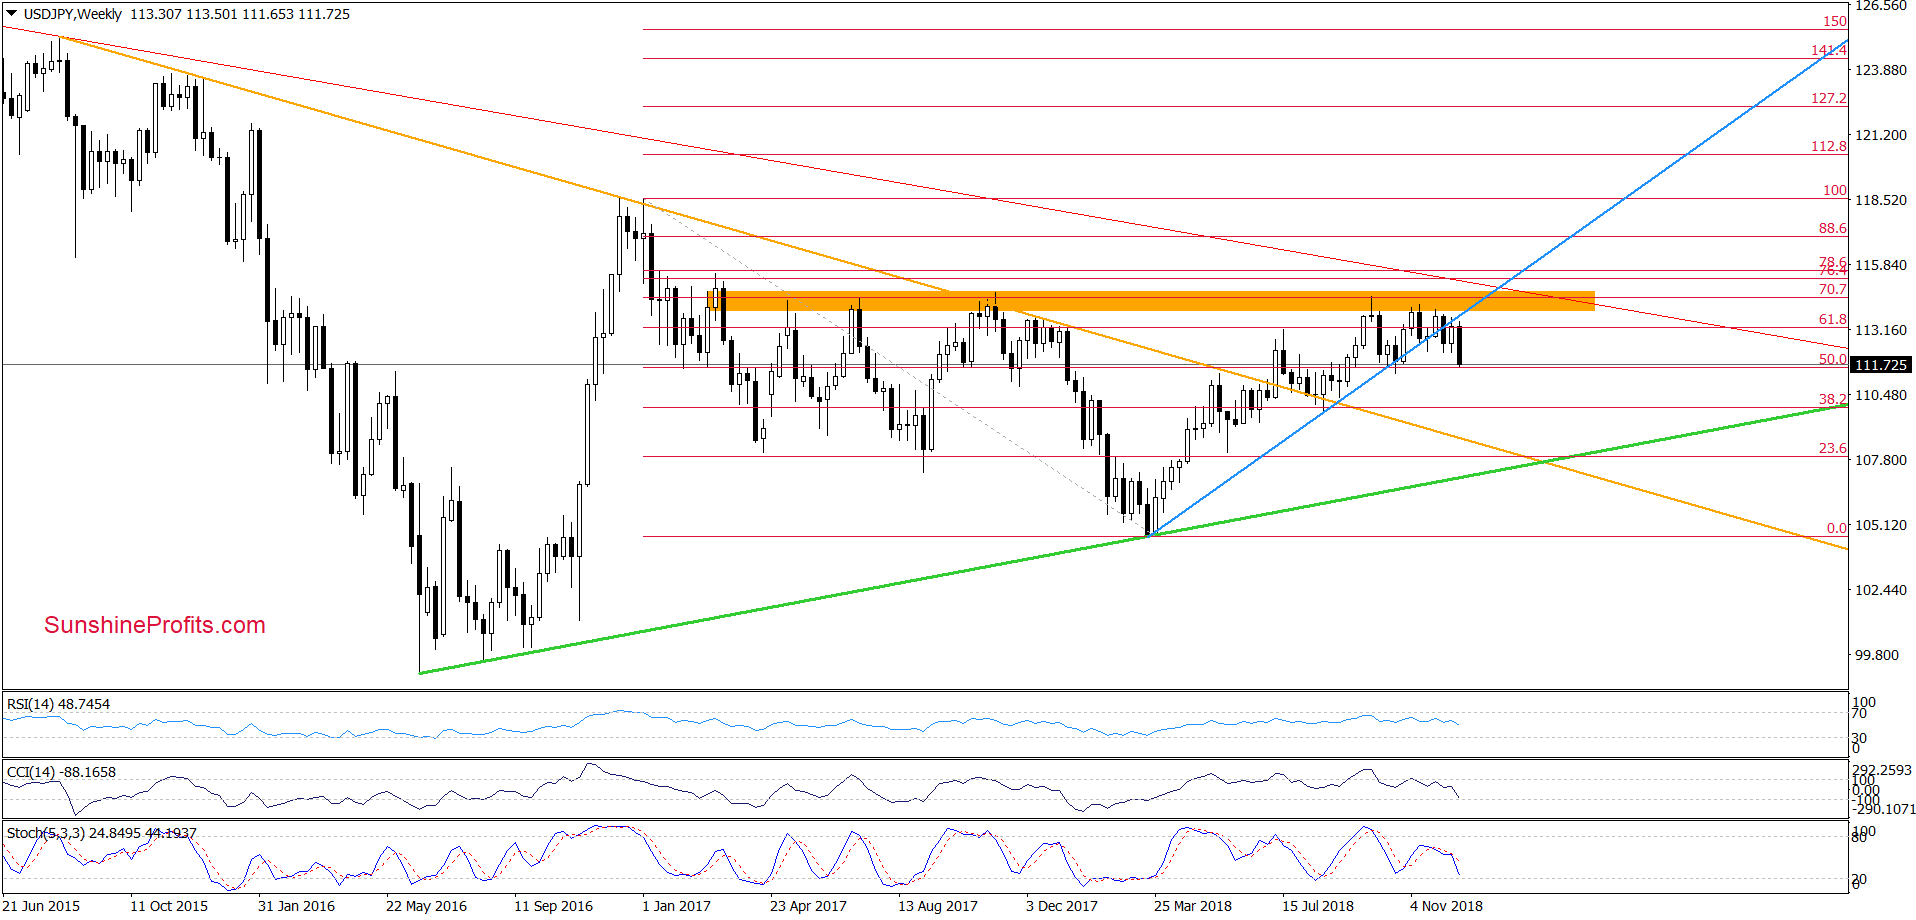
In our Forex Trading Alert posted on December 14, we wrote:
(…) we continue to believe that this week’s price action is nothing more than a verification of the earlier breakdown and suggests that reversal and lower values of the exchange rate might be just around the corner.
Looking at the weekly chart, we see that the situation developed in tune with our assumptions and the exchange rate reversed and pulled back earlier this week.
How did this drop affect the short-term picture?
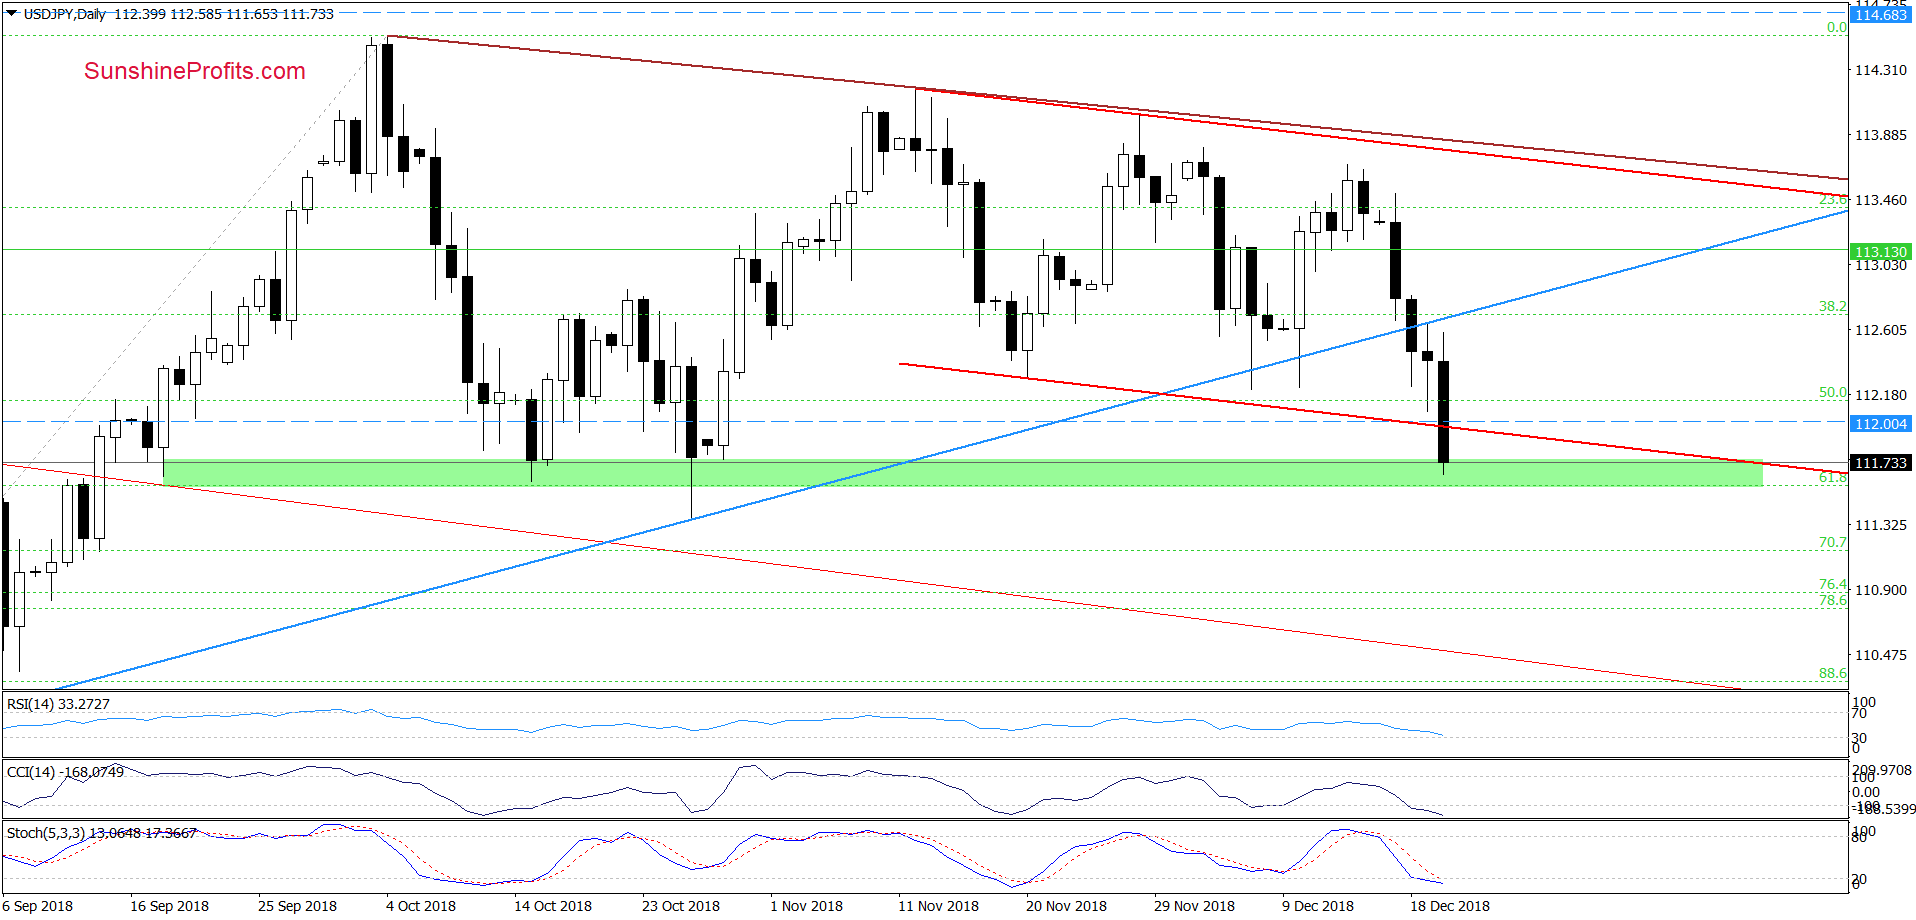
From this perspective, we see that USD/JPY closed Tuesday’s session under the blue support line, which was a bearish development. On the following day, the buyers tried to go higher, but this resistance stopped them triggering a pullback.
Such price action (a verification of the earlier breakdown) translated into further deterioration and resulted in a new December low shaped during yesterday's session. Despite the fact that the bulls made one more attempt to push the currency pair higher earlier today their rivals quickly took control and dominated the trade in the following hours.
Thanks to their determination USD/JPY deepened the recent declines and dived below the lower line of the red declining trend channel (making our short positions even more profitable). This negative event encouraged even more sellers to action, which resulted in a drop to the green support zone.
What’s next for the exchange rate?
In our opinion, the future of USD/JPY depends largely on the attitude of the bulls in this area. If they manage to withstand the pressure of the sellers and push the currency pair back into the red declining trend channel, the exchange rate has a chance for further growth.
Unfortunately, if currency bears close today's session below this important support, the way to the south can be opened. How low USD/JPY could fall if the buyers failed during today's session? In our opinion, the pair could fall to around 110, where the next support zone based on 76.4% and 78.6% Fibonacci retracements is, or even to around 110.22, where the size of the downward movement would correspond to the height of the red declining trend channel.
Connecting the dots, if USD/JPY invalidates the earlier breakdown under the red channel, we’ll consider opening long positions. However, if the pair closes today’s session under the green zone, we’ll consider re-opening short positions. We will keep our subscribers informed should anything change, or should we see a confirmation/invalidation of the above.
USD/CHF – Another Invalidation of Breakout
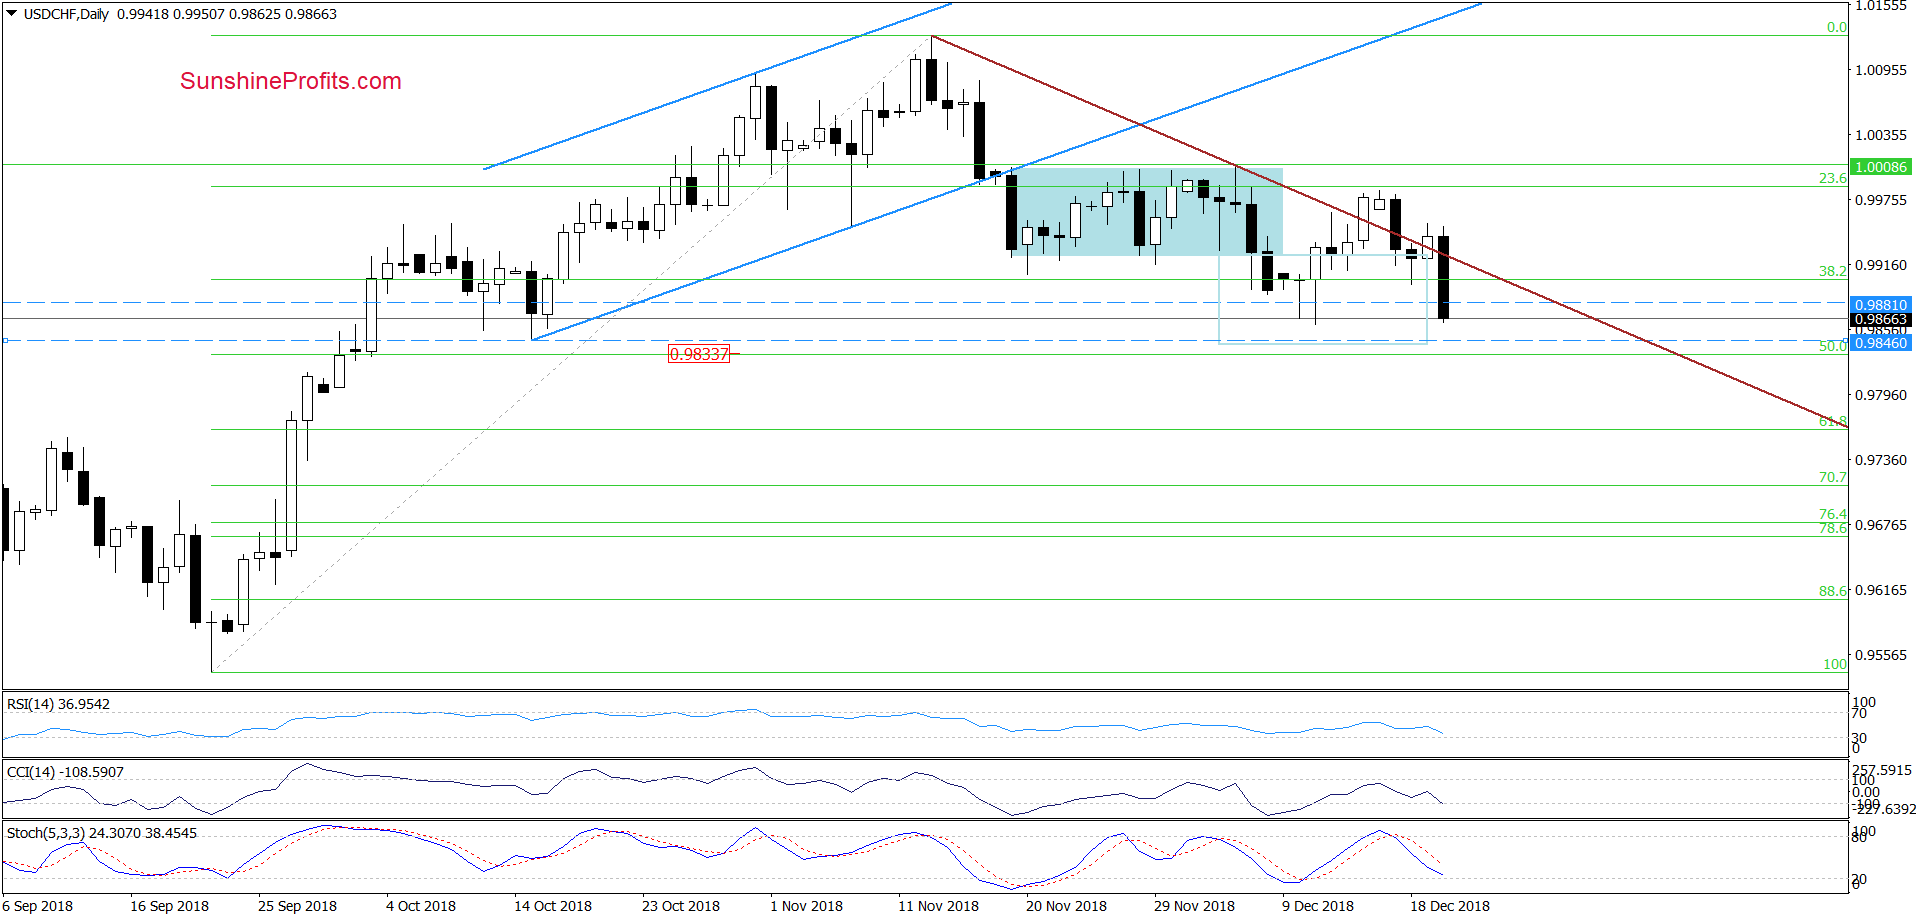
From today’s point of view, we see that although currency bulls took USD/CHF above the short-term brown declining resistance line based on the previous highs yesterday, this improvement did not last long.
Earlier today, currency bears attacked, which led to an invalidation of yesterday’s small breakout above this line. As you see, this negative development triggered further deterioration (which made our short positions even more profitable) and a comeback to the earlier December low.
Although this price action can translate into a double-bottom formation and cause a rebound from here, we should keep in mind that the sell signals generated by the CCI and the Stochastic Oscillator remain in the cards, suggesting that lower values of USD/CHF are just around the corner.
If this is the case and the pair declines from current levels, the sellers will likely test the mid-October lows and the 50% Fibonacci retracement in the following days (around 0.9833-0.9846).
Finishing today’s commentary on this currency pair, it is also worth noting that in this area the size of the downward move will correspond to the height of the blue consolidation, which increases the probability that the sellers will want to make profits in this area.
If you enjoyed the above analysis and would like to receive daily premium follow-ups, we encourage you to sign up for our Oil Trading Alerts. Sign up now!.
Thank you.
Nadia Simmons
Forex & Oil Trading Strategist
Przemyslaw Radomski, CFA
Founder, Editor-in-chief, Gold & Silver Fund Manager
Gold & Silver Trading Alerts
Forex Trading Alerts
Oil Investment Updates
Oil Trading Alerts
