

Looking at the daily chart of USD/CHF we can summarize the recent days in one word: boredom. But behind the current consolidation there may be something more than we think at first glance. Read today's alert and you'll find out what we mean.
EUR/USD
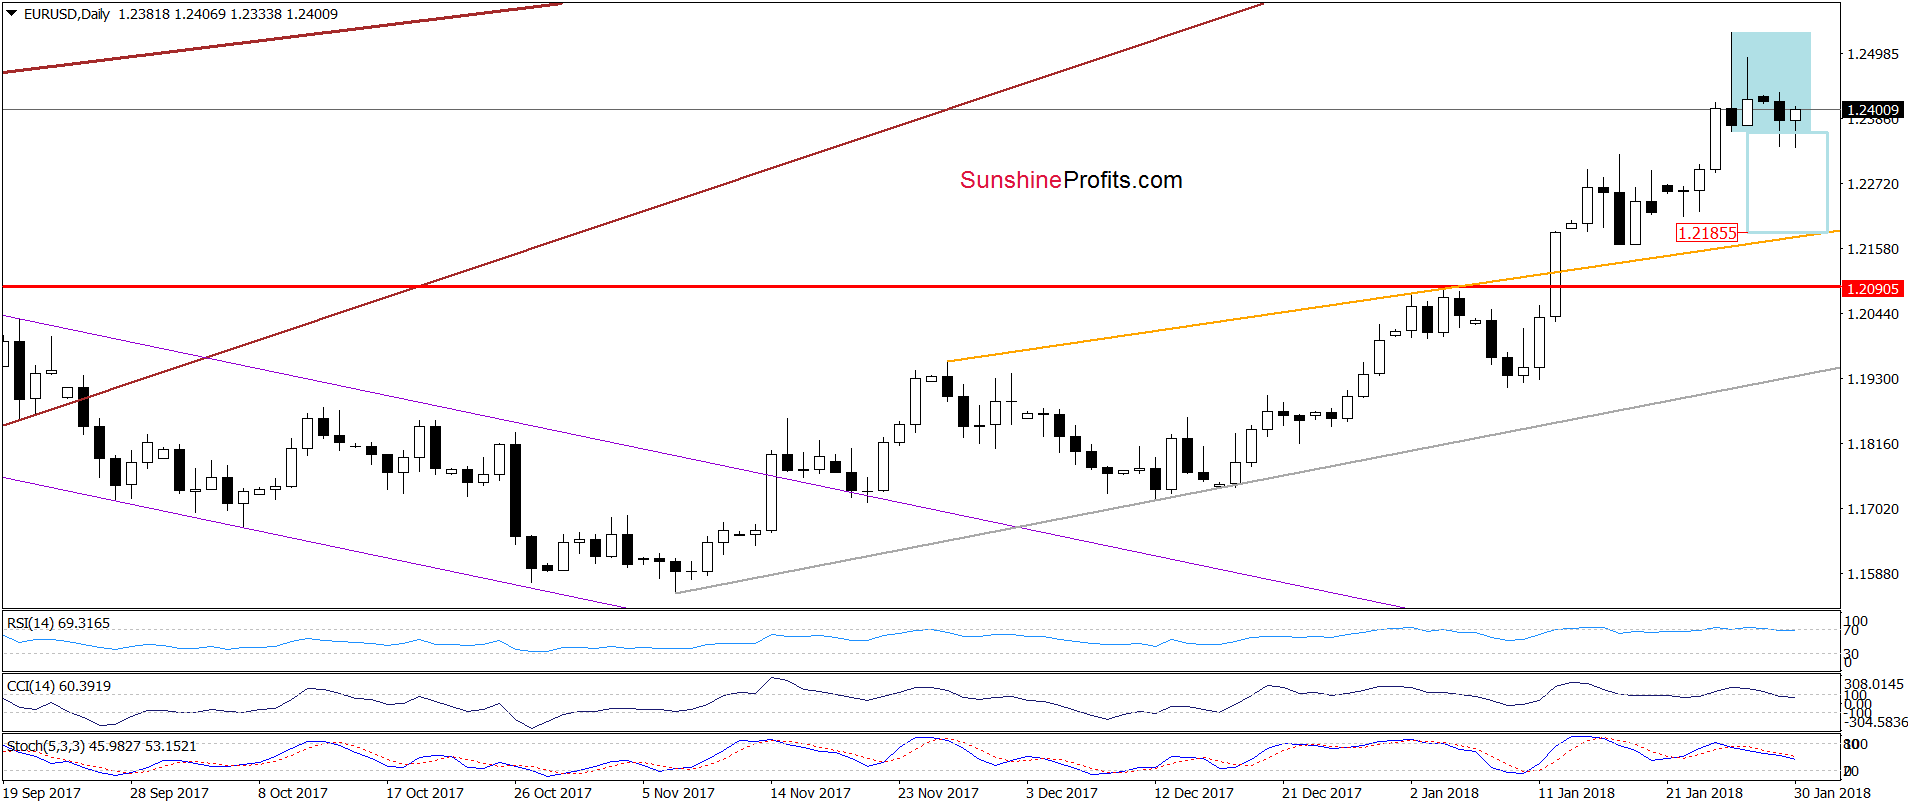
On the daily chart, we see that although currency bears tried to push EUR/USD under the lower border of the blue consolidation, they failed yesterday and also earlier today. Such price action doesn’t look encouraging considering our short positions, but the trading day in the U.S. is still ahead of us, which means that the bears have a lot of time to change the situation and win today’s session.
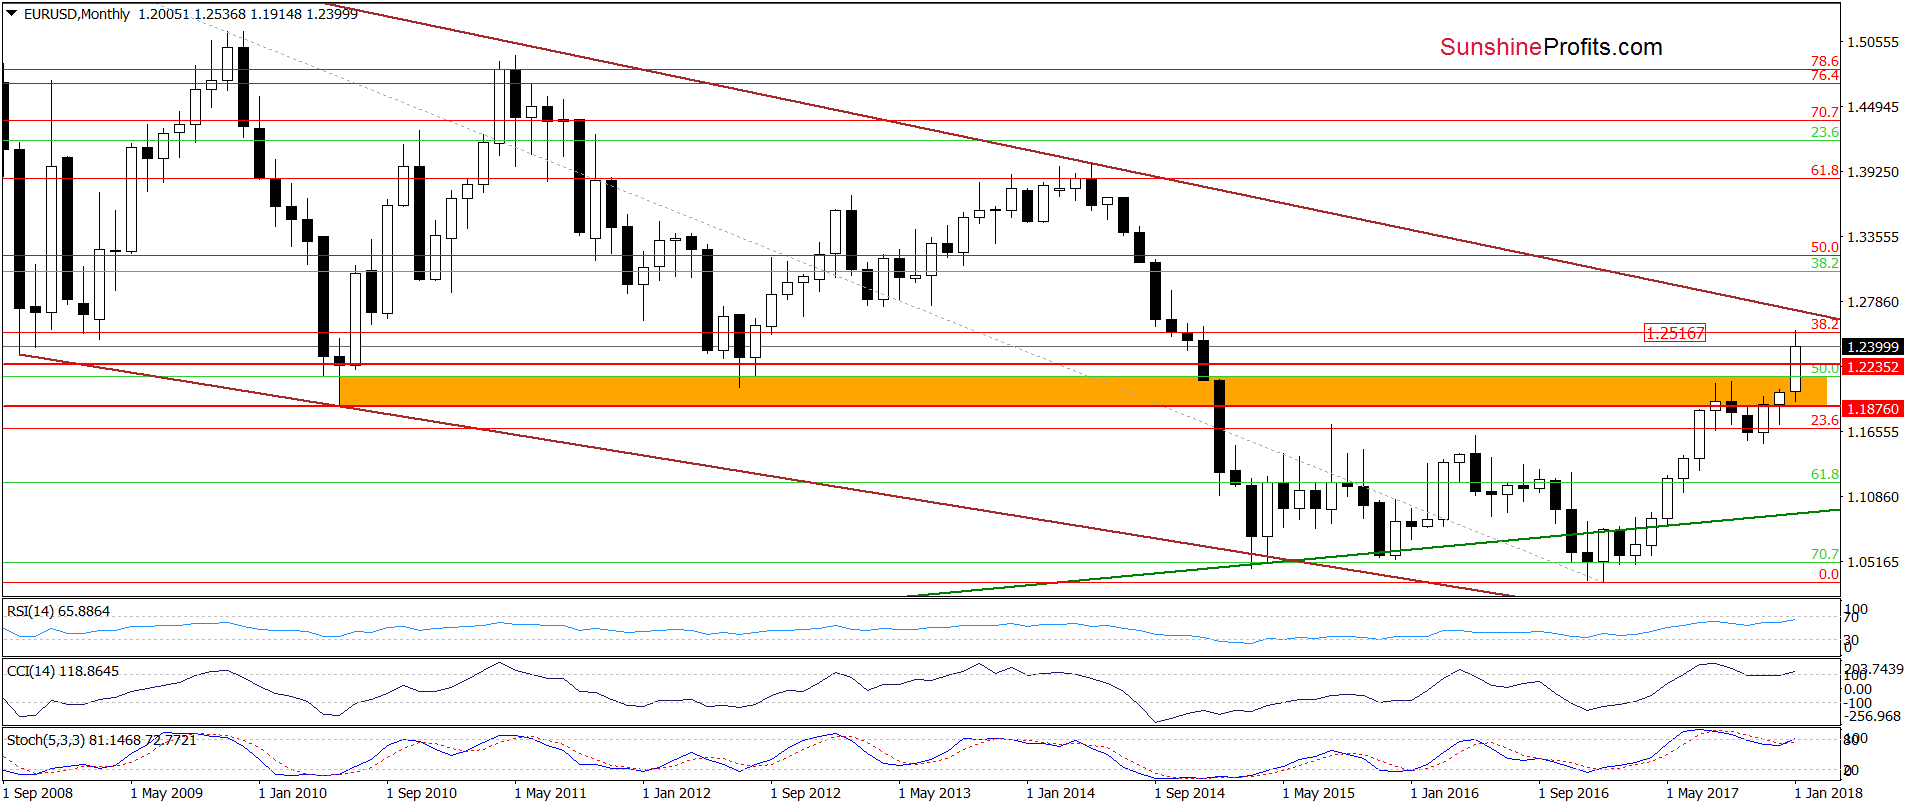
Why should something like that happen? Firstly, the sell signals generated by the indicators remains in the cards, suggesting lower values of the exchange rate in the coming days. Secondly, the 38.2% Fibonacci retracement based on the entire 2008-2017 downward move (which serves as the key resistance at the moment of writing these words) continues to keep gains in check. Thirdly, two pro bearish candlestick formations are still in play, reinforcing the resistance area.
What does it mean for EUR/USD? In our opinion, even if we see further improvement currency bulls will have to invalidate the shooting star (we wrote more about this formation yesterday) and break above the upper line of the consolidation. In other words, we believe that as long as there is no daily/monthly closure above these levels and the 38.2% retracement a bigger move to the downside is a more credible scenario.
USD/CAD
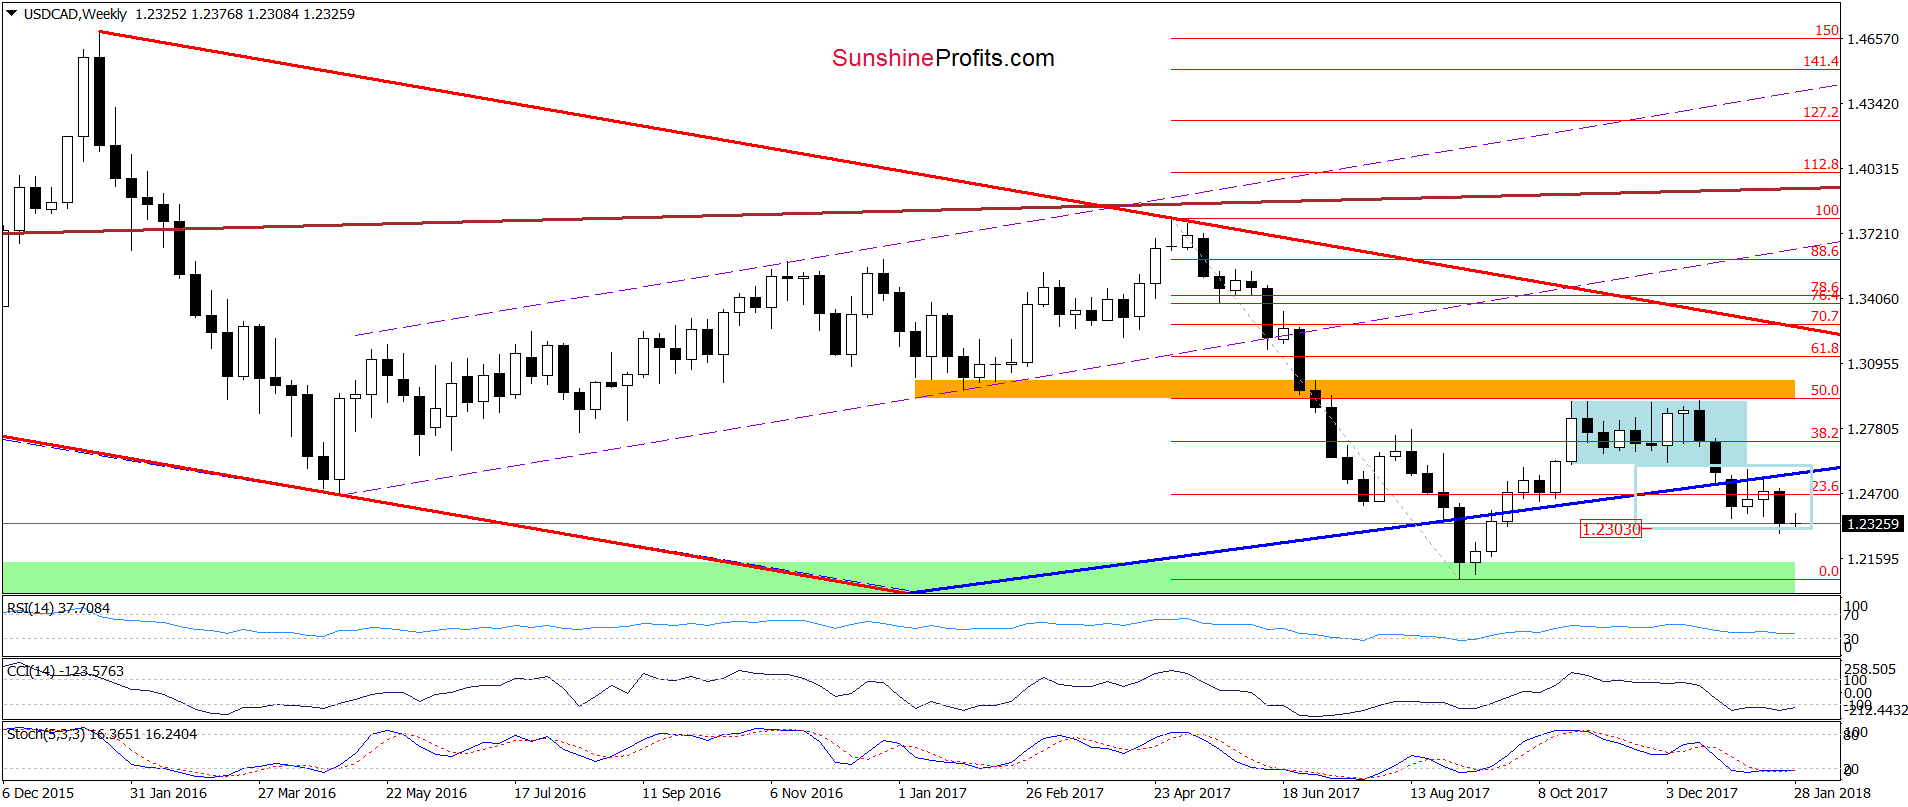
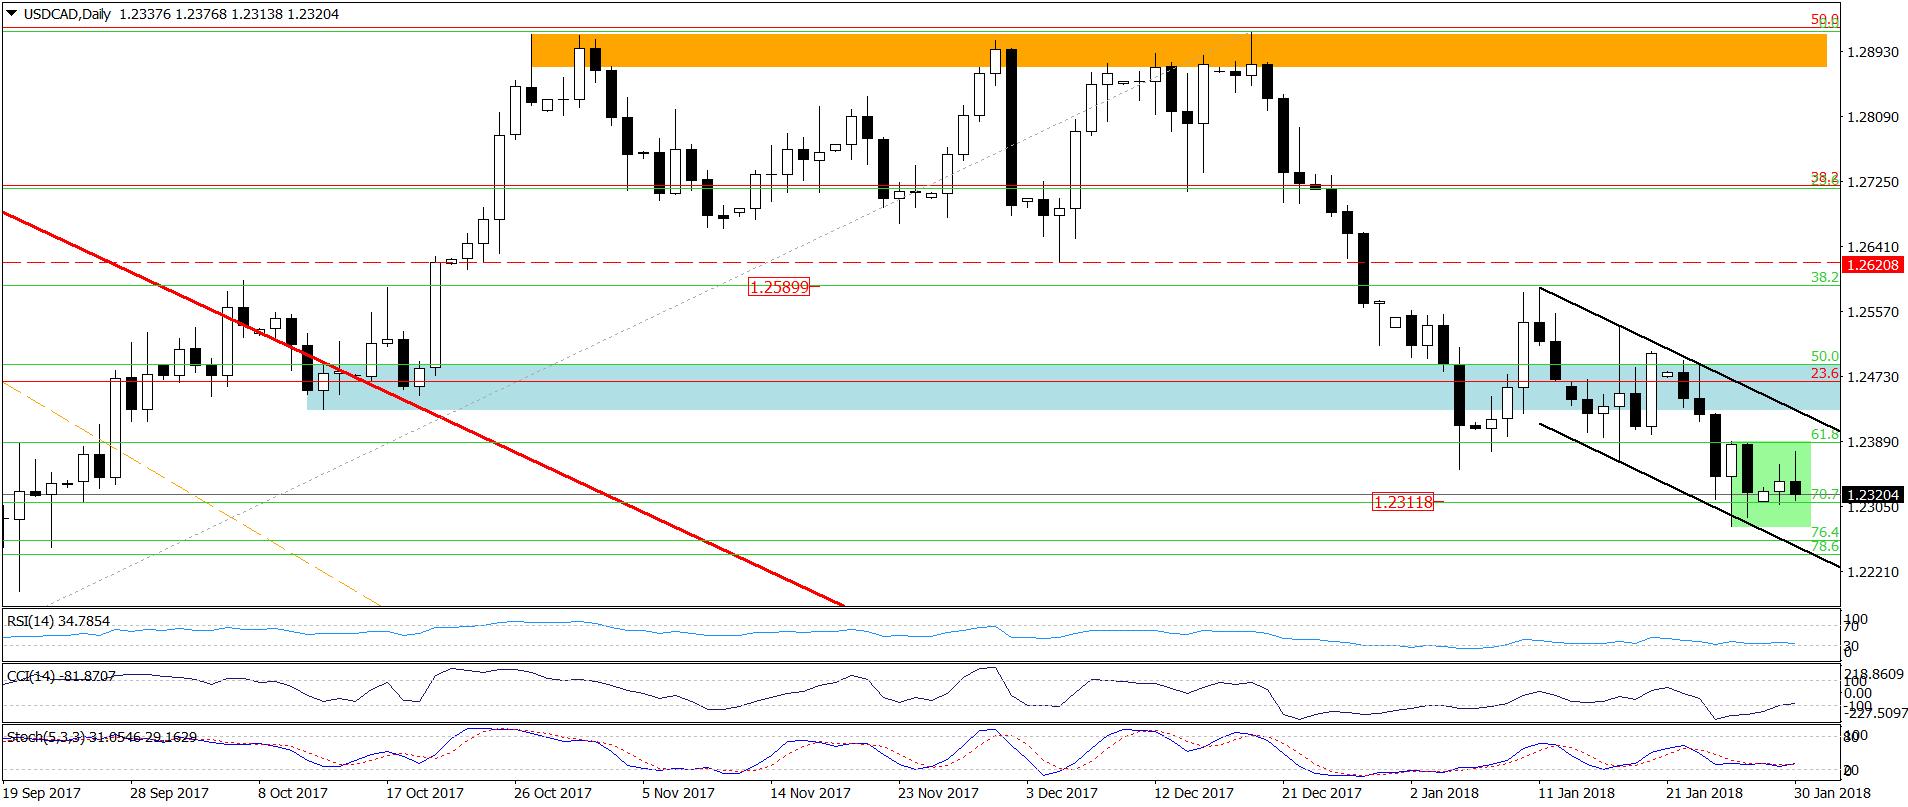
Looking at the above charts, we see that the overall situation in recent days hasn’t changed much as USD/CAD is trading in a narrow range (the green consolidation) inside the black declining trend channel.
What does it mean to us? That as long as there is no breakout above the upper line of the channel or a breakdown under the lower line opening any positions is not justified from the risk/reward perspective.
However, there are some technical details, which suggest that the next bigger move should be to the upside. Why? Firstly, currency bears reached their downside target (USD/CAD dropped to the area, where the size of the downward move corresponded to the height of blue consolidation marked on the weekly chart), which could reduce the selling pressure. Secondly, the consolidation itself suggests that that the forces of the buyers and the sellers are beginning to balance, which may translate into a change in the recent direction (in other words, a trend reversal). Thirdly, the current position of the weekly and daily indicators almost screams: it's time to move up!
Connecting the dots, we will continue to monitor the market in the coming days and if we see any reliable signs justifying the opening long positions, we will send you a message.
USD/CHF
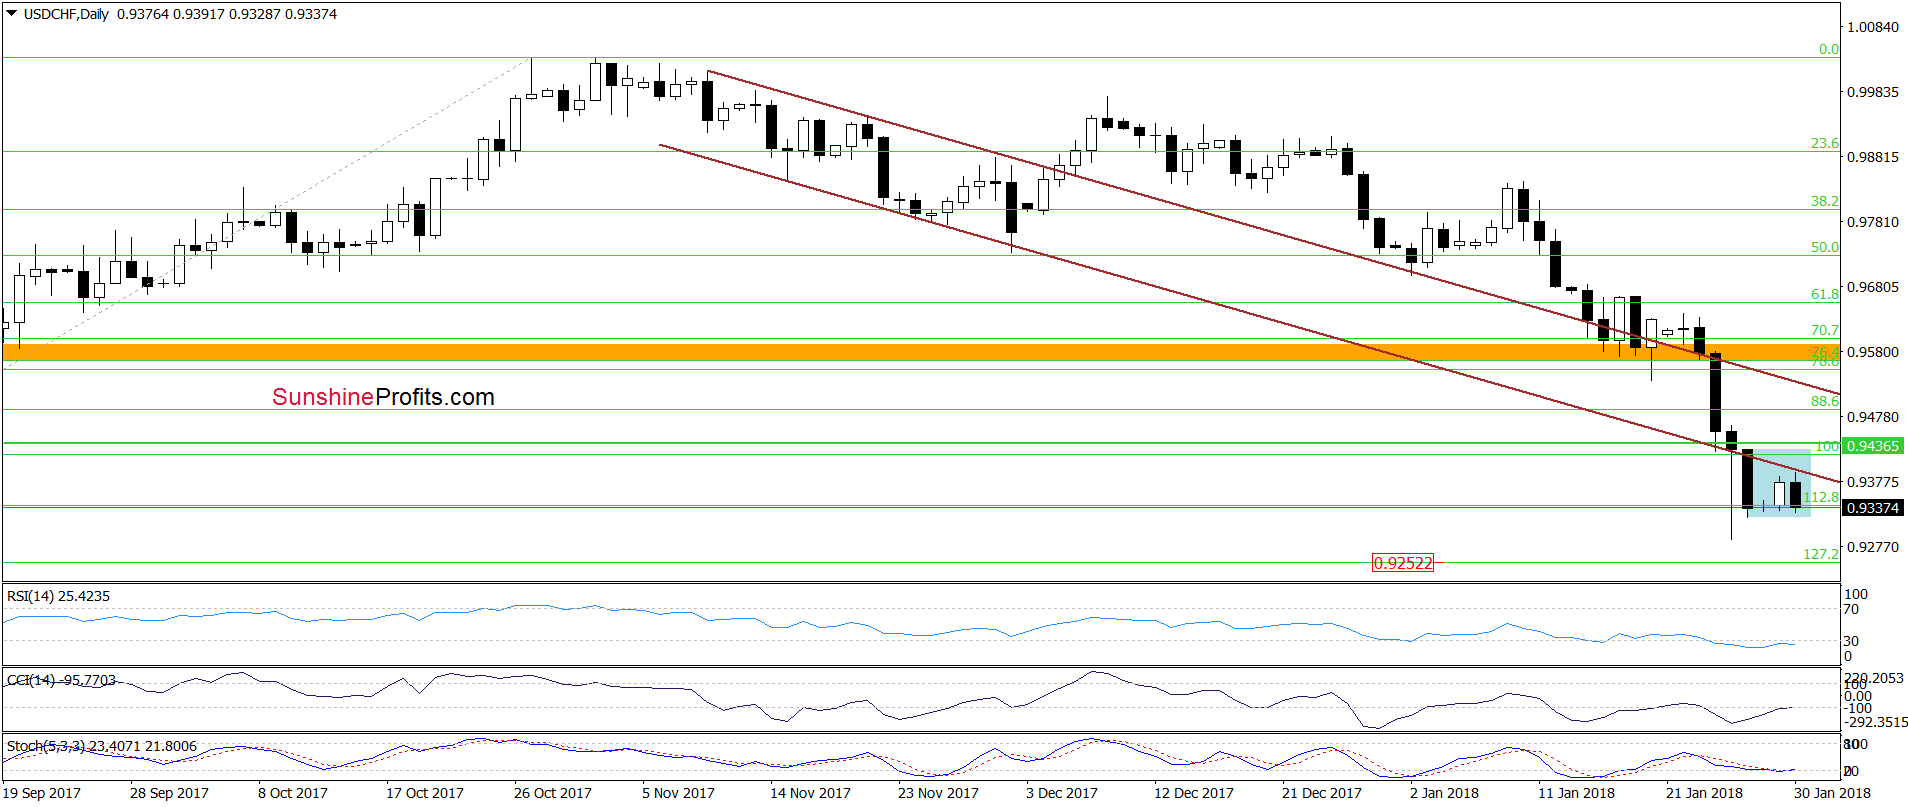
The first thing that catches the eye on the daily chart is the blue consolidation, where the overall undertone is the same as in the case we discussed above: the forces of the buyers and the sellers are likely beginning to balance, which may translate into a change in the recent direction in the coming days.
Nevertheless, USD/CHF, in contrast to USD/CAD, dropped below the lower border of the previous trend channel (the lower brown support line based on the previous lows), which means that as long as there is no invalidation of the breakdown under this line all upswing will be nothing more than another verification of the breakdown.
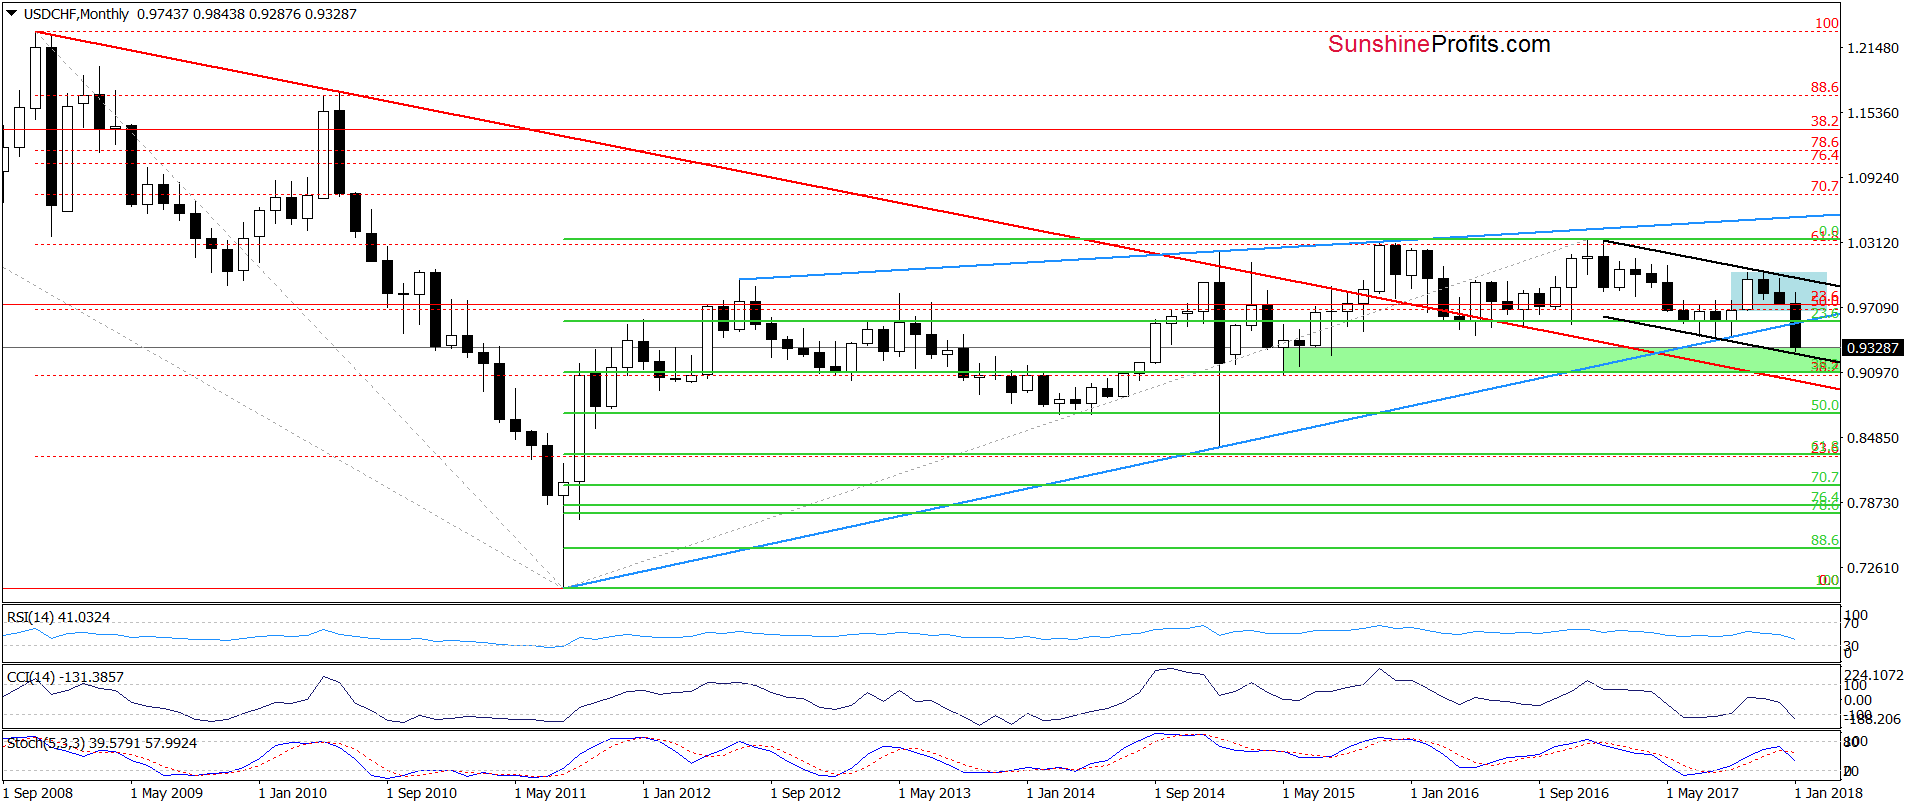
Additionally, the exchange rate remains below the previously-broken long-term blue support line based on the 2011, 2015 and November 2017 lows (marked on the monthly chart below), which doesn’t bode well for currency bulls.
Nevertheless, we should keep in mind that USD/CHF slipped to the green support zone created by the April-August lows and the 38.2% Fibonacci retracement (based on the entire 2011-2016 upward move) and almost touched the lower border of the black declining trend channel. This could encourage currency bulls to act and translate into rebound in the coming week.
Therefore, in our opinion, even if the exchange rate moved a bit lower (for example, to the above-mentioned lower line of the trend channel or the 127.2% Fibonacci extension seen on the daily chart), the space for declines seems limited and reversal is just around the corner.
What could happen if the situation develops in line with the above scenario? We think that USD/CHF will rebound to around 0.9530, where the long-term blue line currently is. That’s why, we will keep an eye on this currency very closely and we'll let you know if the situation changes enough to justify opening long positions.
Naturally, the above could change in the coming days and we’ll keep our subscribers informed, but that’s what appears likely based on the data that we have right now. If you enjoyed reading our analysis, we encourage you to subscribe to our daily Forex Trading Alerts.
Thank you.
Nadia Simmons
Forex & Oil Trading Strategist
Przemyslaw Radomski, CFA
Founder, Editor-in-chief, Gold & Silver Fund Manager
Gold & Silver Trading Alerts
Forex Trading Alerts
Oil Investment Updates
Oil Trading Alerts
