

Although currency bulls managed to invalidate a small breakdown under the lower border of the rising trend channel, they failed to go further north. What stopped them? How did their opponents behave in the face of this event? What does all this mean for the U.S dollar and the Swiss franc? You will find the answers to all these questions in today's alert.
EUR/USD – One More Time
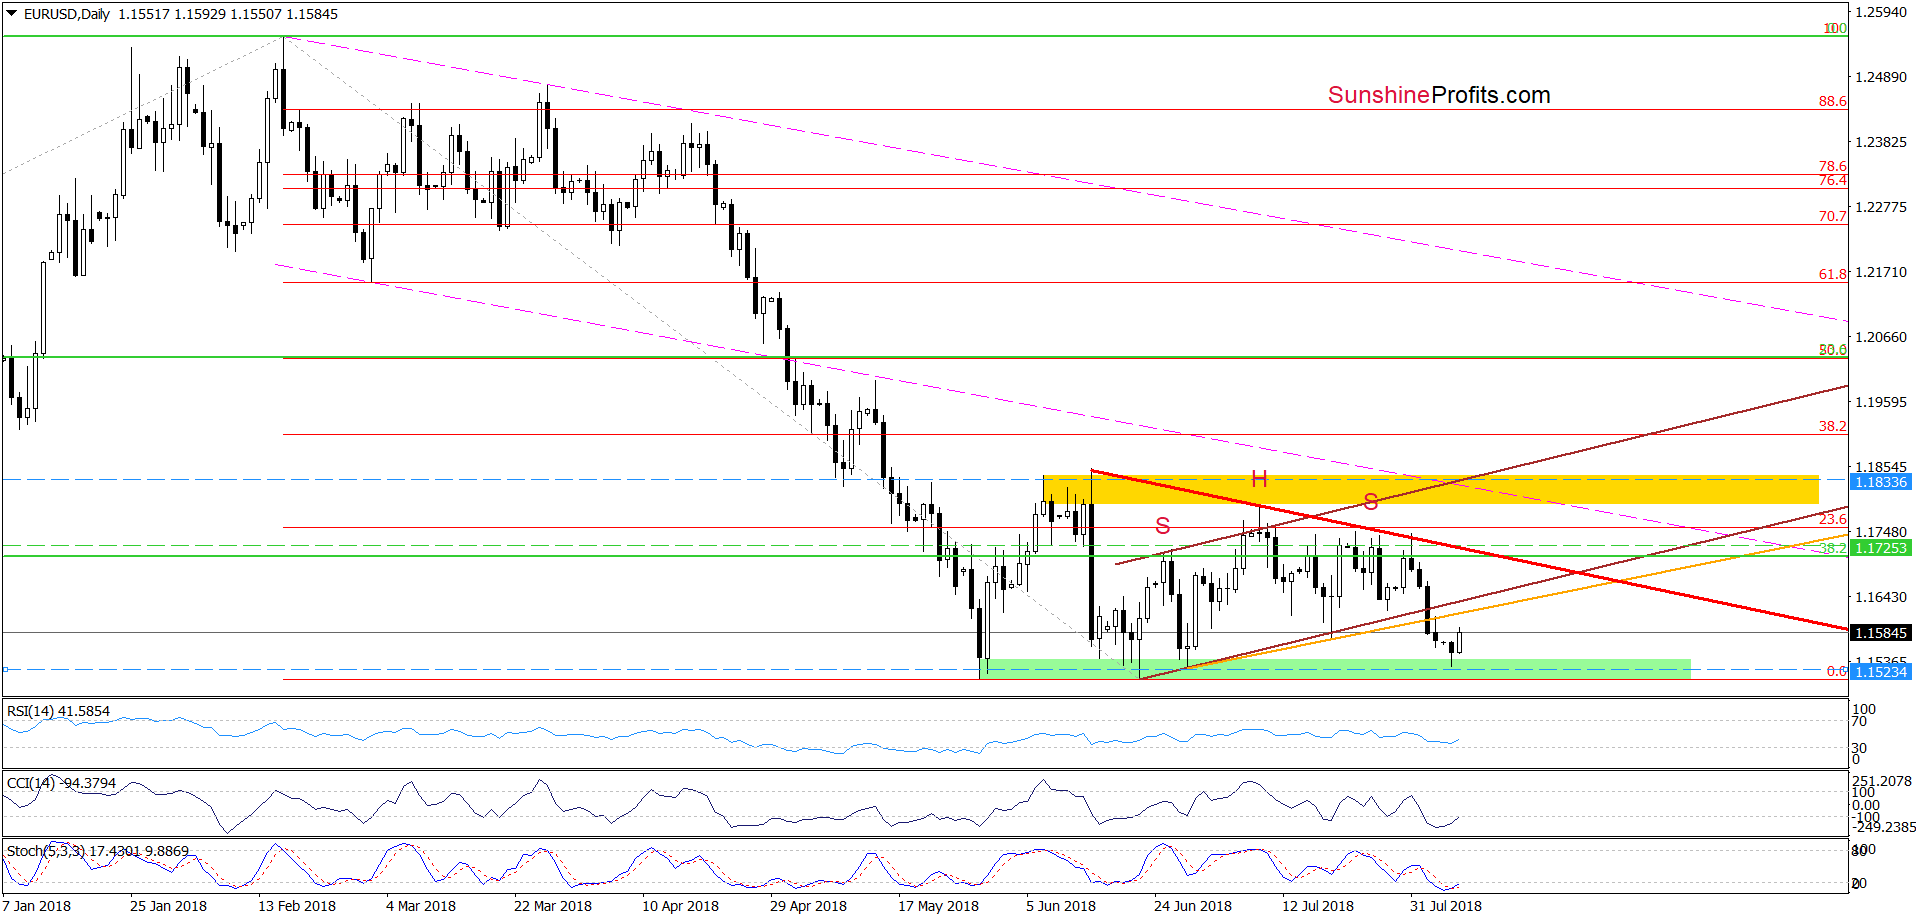
Yesterday, the exchange rate slipped to the green support zone, which was strong enough to stop the sellers in the previous months. As you see, they have fallen in this area so many times that there was a reasonable risk that history would repeat itself once again and we would see another rebound from here in the coming days.
Thanks to this assumption, we decided to close our short positions (not only in EUR/USD, but also in GBP/USD) and take profits off the table (for those who are not yet our subscribers, we inform that we opened them when EUR/USD was trading at around 1.1725 – we marked this level with a green dashed horizontal line).
As it turned out after our Forex Trading Alert was posted, EUR/USD bounced off the green support zone as we had expected. Earlier today, the pair extended Monday’s move, which shows that our decision to take profits off the table was right.
What’s next for the exchange rate?
Taking into account the current position of the daily indicators (the Stochastic Oscillator generated a sell signal, while the CCI is very close to doing the same), we think that the pair will test the previously-broken orange line based on the late June and mid-July lows (the neck line of the head and shoulders formation) in the very near future.
Nevertheless, observing the charts of EUR/USD and the USD Index, we noticed that many times in the past currency bears had problems with realization of the pro-declining scenario based on the head and shoulder s pattern.
Therefore, it seems to us that further improvement above this resistance line can’t be ruled out. If this is the case and we see an invalidation of the earlier breakdown (under the orange line and the lower border of the brown rising trend channel), EUR/USD can climb even to the red declining resistance line based on the previous peaks (currently around 1.1725) in the following days.
Finishing today’s commentary on this currency pair, please note that if the situation develops in tune with our assumptions, we’ll consider opening long positions (of course, if the other technical factors also speak for the pro-growth scenario). So, enjoy recent profits and stay tuned.
USD/CAD – How Low is Too Low?
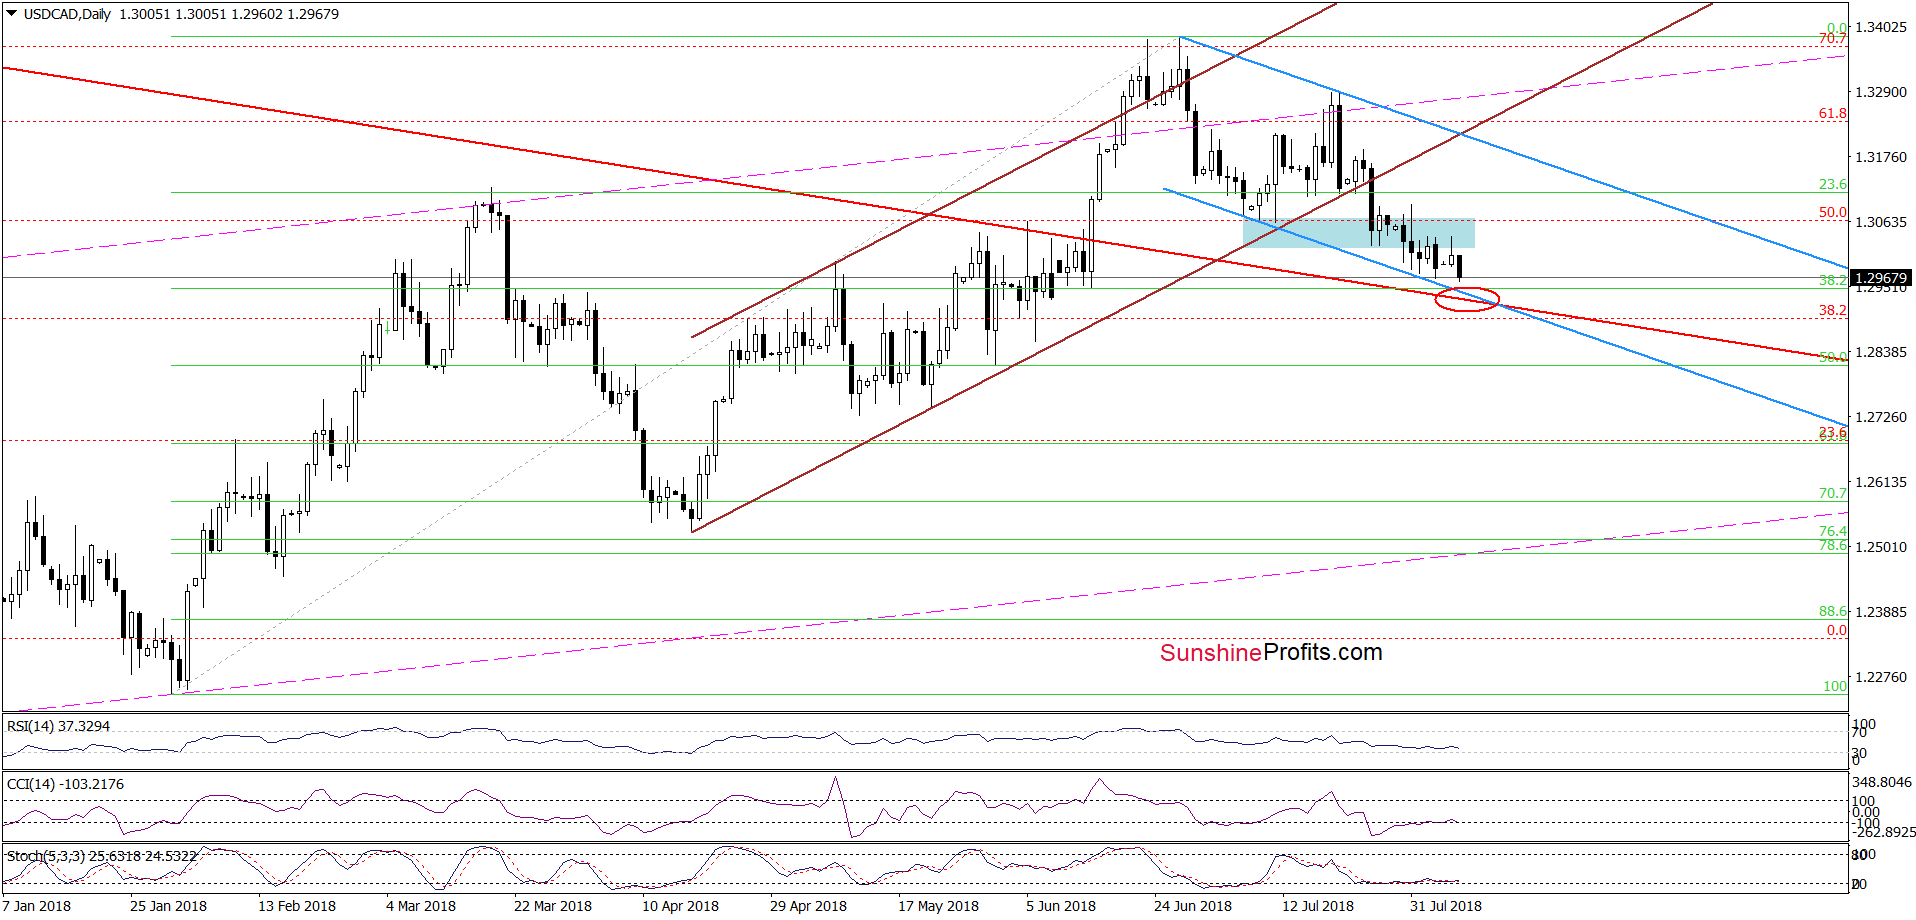
From today’s point of view, we see that currency bulls have recently had quite serious problems with crossing the blue resistance zone based on early and late July lows.
Thanks to that show of weakness (another example of an unsuccessful attempt to break through to higher levels we could observe during yesterday's session), USD/CAD moved lower once again, which suggests that we’ll see a test of the lower border of the blue declining trend channel in the coming day(s).
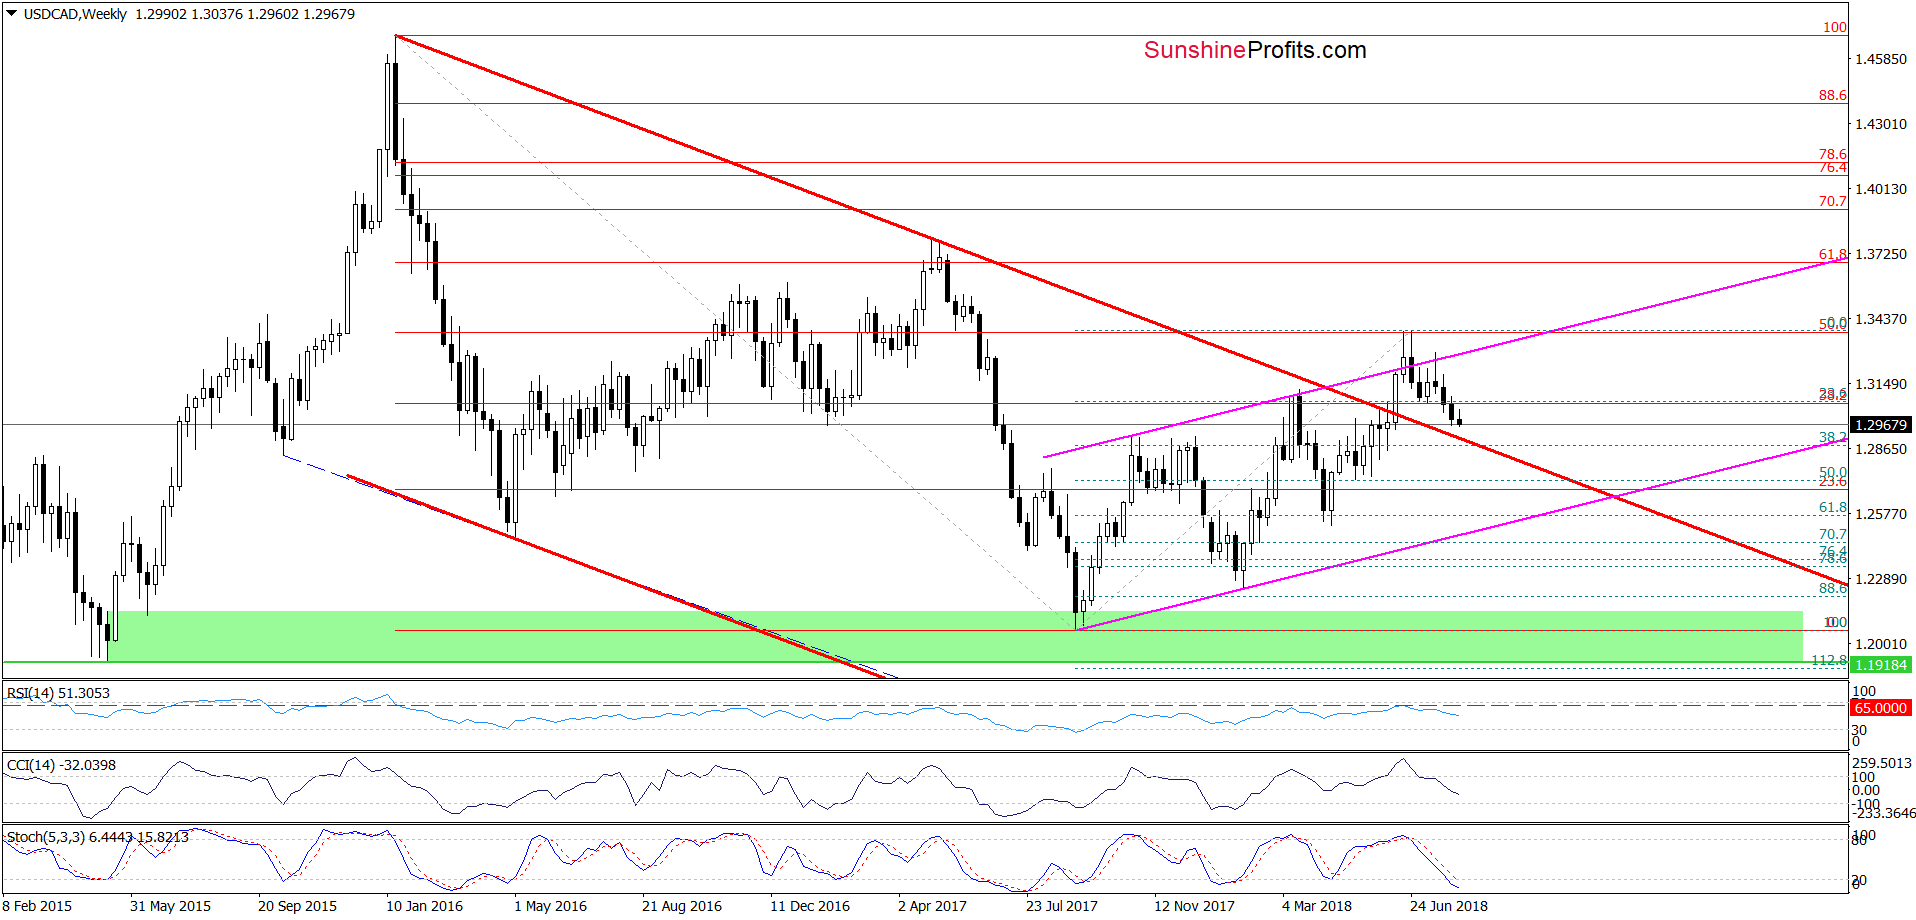
At this point, it is also worth noting that slightly below this line is also the upper border of the long-term red declining trend channel (you can see it more clearly on the weekly chart), which will likely stop the sellers in the very near future.
This scenario is also reinforced by the position of the daily indicators – they are not only extremely oversold, but there are also clearly visible bullish divergences between them and the exchange rate, which suggests that reversal is just around the corner.
USD/CHF – North or South?
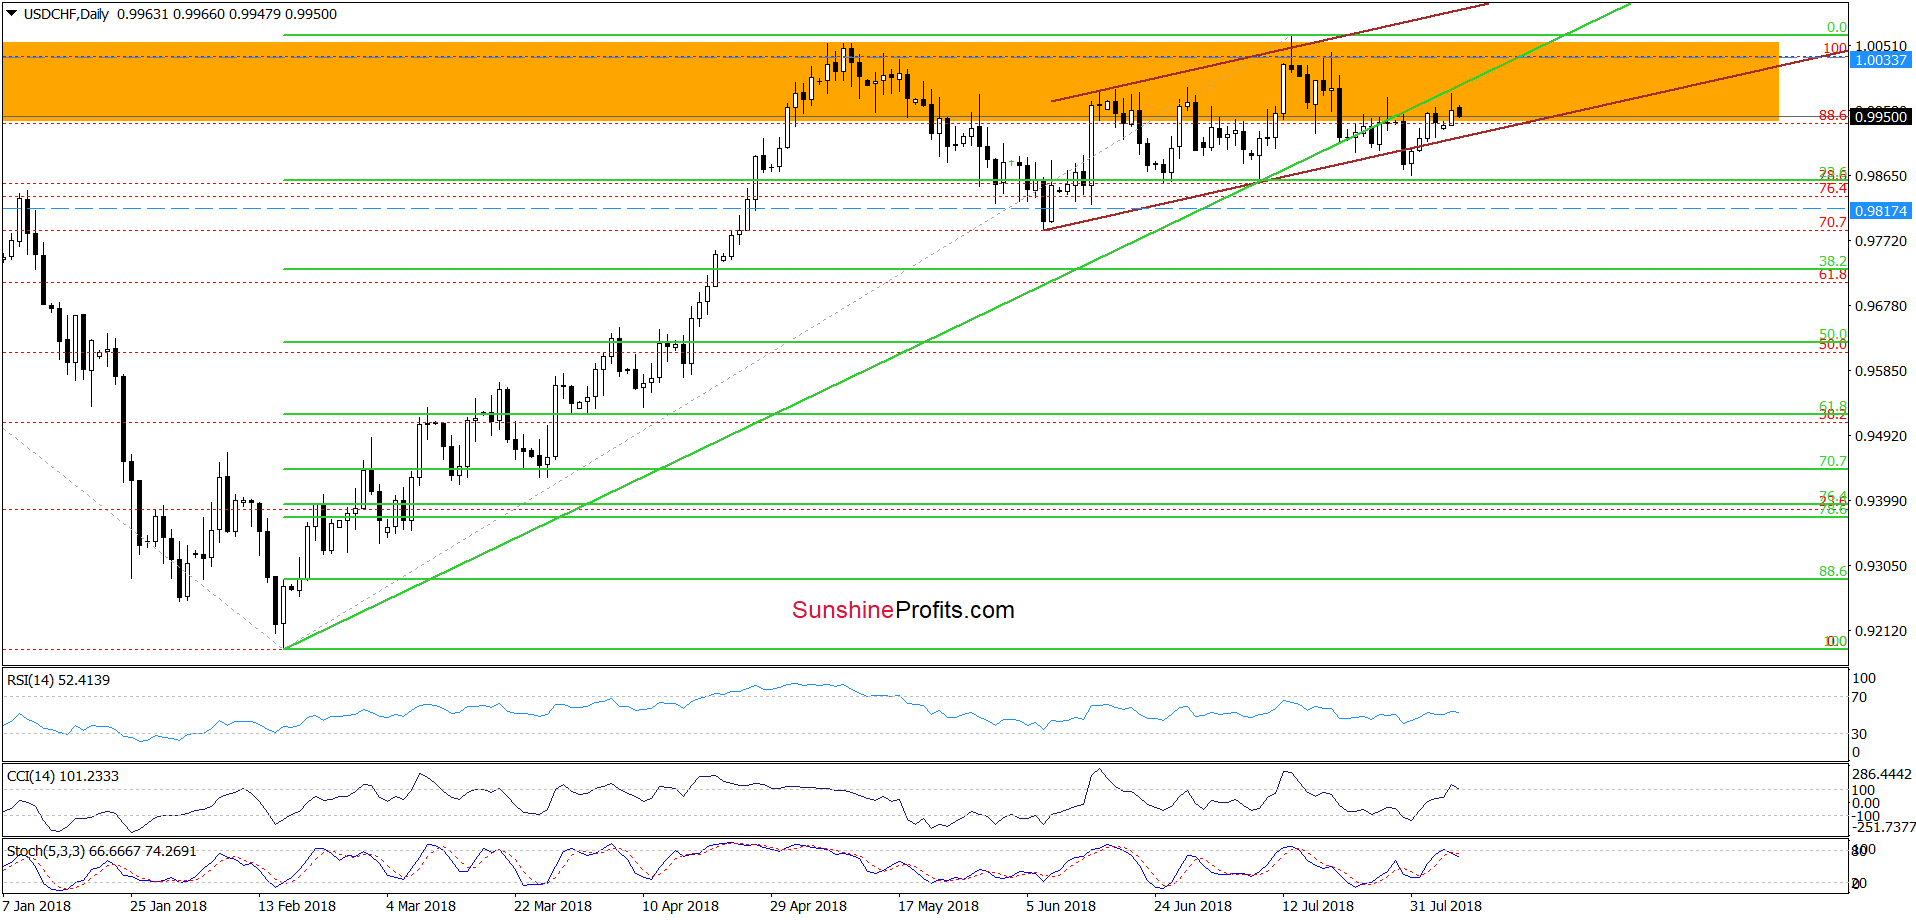
On Monday, USD/CHF extended gains above the lower border of the brown rising trend channel, which approached the exchange rate to the previously-broken medium-term green support line based on mid-February and early July lows.
Despite this improvement, currency bulls didn’t manage to take the pair higher, which resulted in a pullback. Earlier today, their opponents triggered further deterioration, which suggests that yesterday’s pica action was nothing more than a verification of the earlier breakdown under the green line.
If this is the case, we’ll likely see another not only a drop to the lower border of the brown rising trend channel, but also a test of the nearest support zone created by the 23.6% Fibonacci retracement, the last June and July lows in the following days.
Finishing today’s alert, it’s also worth keeping in mind that the CCI and the Stochastic Oscillator generated the sell signals, increasing the likelihood of the realization of the above scenario in the very near future.
If currency bears show strength in this area, we’ll consider opening short positions. As always, we’ll keep our subscribers informed should anything change.
If you enjoyed the above analysis and would like to receive daily follow-ups as soon as we create them, please subscribe to our Forex Trading Alerts.
Thank you.
Nadia Simmons
Forex & Oil Trading Strategist
Przemyslaw Radomski, CFA
Founder, Editor-in-chief, Gold & Silver Fund Manager
Gold & Silver Trading Alerts
Forex Trading Alerts
Oil Investment Updates
Oil Trading Alerts
