

In yesterday’s alert, we wrote that the situation could change quickly and that in such a case, we would send another alert. Six minutes after yesterday’s opening bell, we already posted the second alert. And for a very good reason. The USD Index took a deep dive and metals were not even close to reacting in a normal way. They were actually a bit lower. We know an extremely bearish signal when we see one and that was definitely the most bearish development for the PMs that we’ve seen this year.
Let’s take a look at what happened. This time we’ll start with the short-term USD Index chart (charts courtesy of http://stockcharts.com) as we want to show you the action of yesterday’s session.
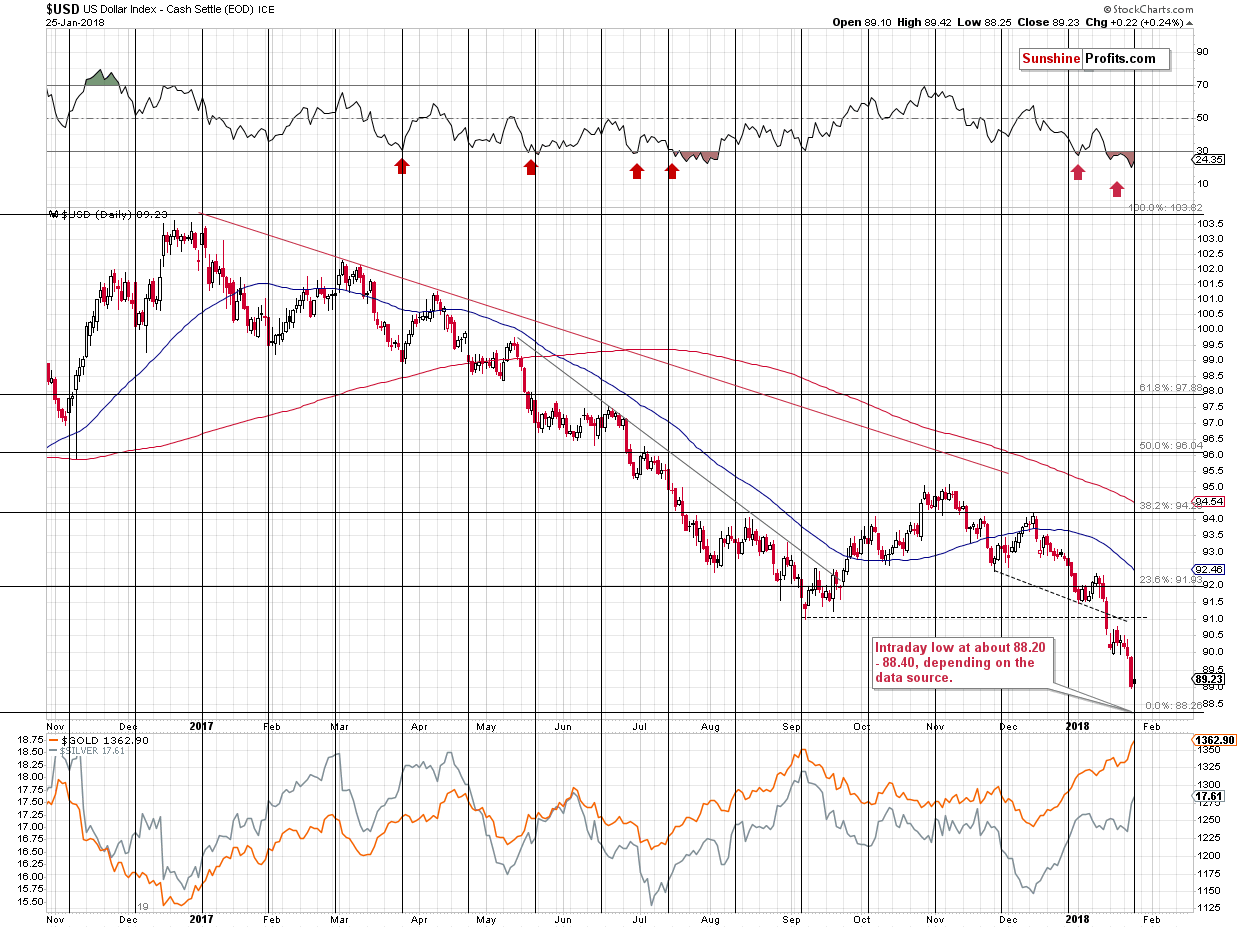
We previously wrote about 3 very strong support levels based on the previous highs (2009 and 2010) and the 50% Fibonacci retracement level based on the 2011 – 2017 rally. These levels are: 89.11, 88.71 and 88.26.
The USD Index opened yesterday’s session at 89.10, moved almost a full index point lower (Stockcharts shows 88.25 as the intraday low, while Bloomberg points to 88.438 as the low) and then rallied back up, closing the session at 89.23 (Stockcharts) / 89.391 (Bloomberg).
Please recall what we wrote about breakdowns/breakouts and their invalidations. While the former need to be confirmed / verified to be important, an invalidation is an immediate and strong signal. Now, please go through the previous paragraph again. That’s right – the USD Index broke below the key support levels on an intraday basis and immediately invalidated the breakdown, closing the session higher and above all of them. That’s a perfectly bullish combination.
The only thing that could make it more bullish is if the USD reversed under oversold conditions and close to the cyclical turning point.
Oh wait. It did.
Based on the daily RSI indicator, the USD Index was most oversold in more than a year and it reversed exactly at the turning point.
The strength of the bullish factors and the amount of them is almost breathtaking.
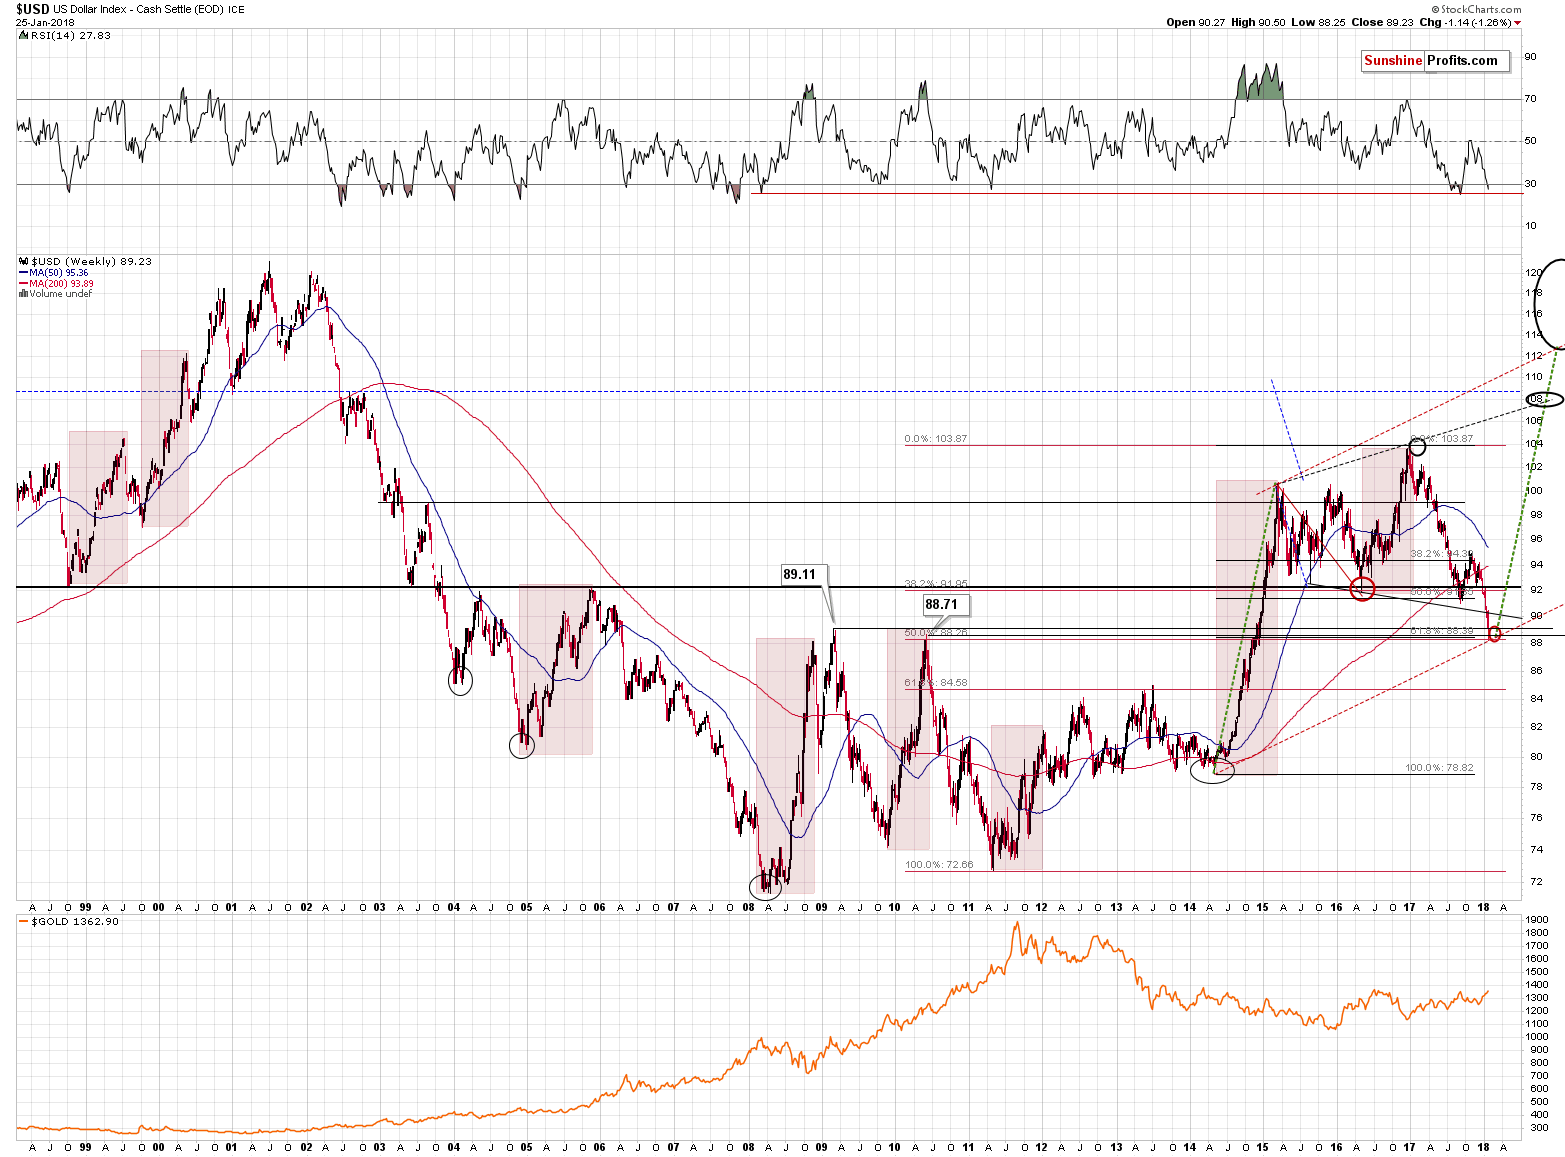
And there’s also one more. The 50% Fibonacci retracement level based on the 2011 – 2017 rally was not the only one that was reached. There is also another useful way to create the retracement and that is by basing it on the 2014 bottom. It’s definitely important as that’s when the biggest rally of the past two decades started. Consequently, retracements based on it are important as well. The 61.8% Fibonacci retracement level is at about 88.40.
In other words, the USD Index has an incredibly bullish set-up that’s strengthened by yet another important bullish factor.
The situation in the precious metals market seems even more critical, but before moving to it, let’s stay with the currencies for a while.
Europe and Japan and Their Golden Signals
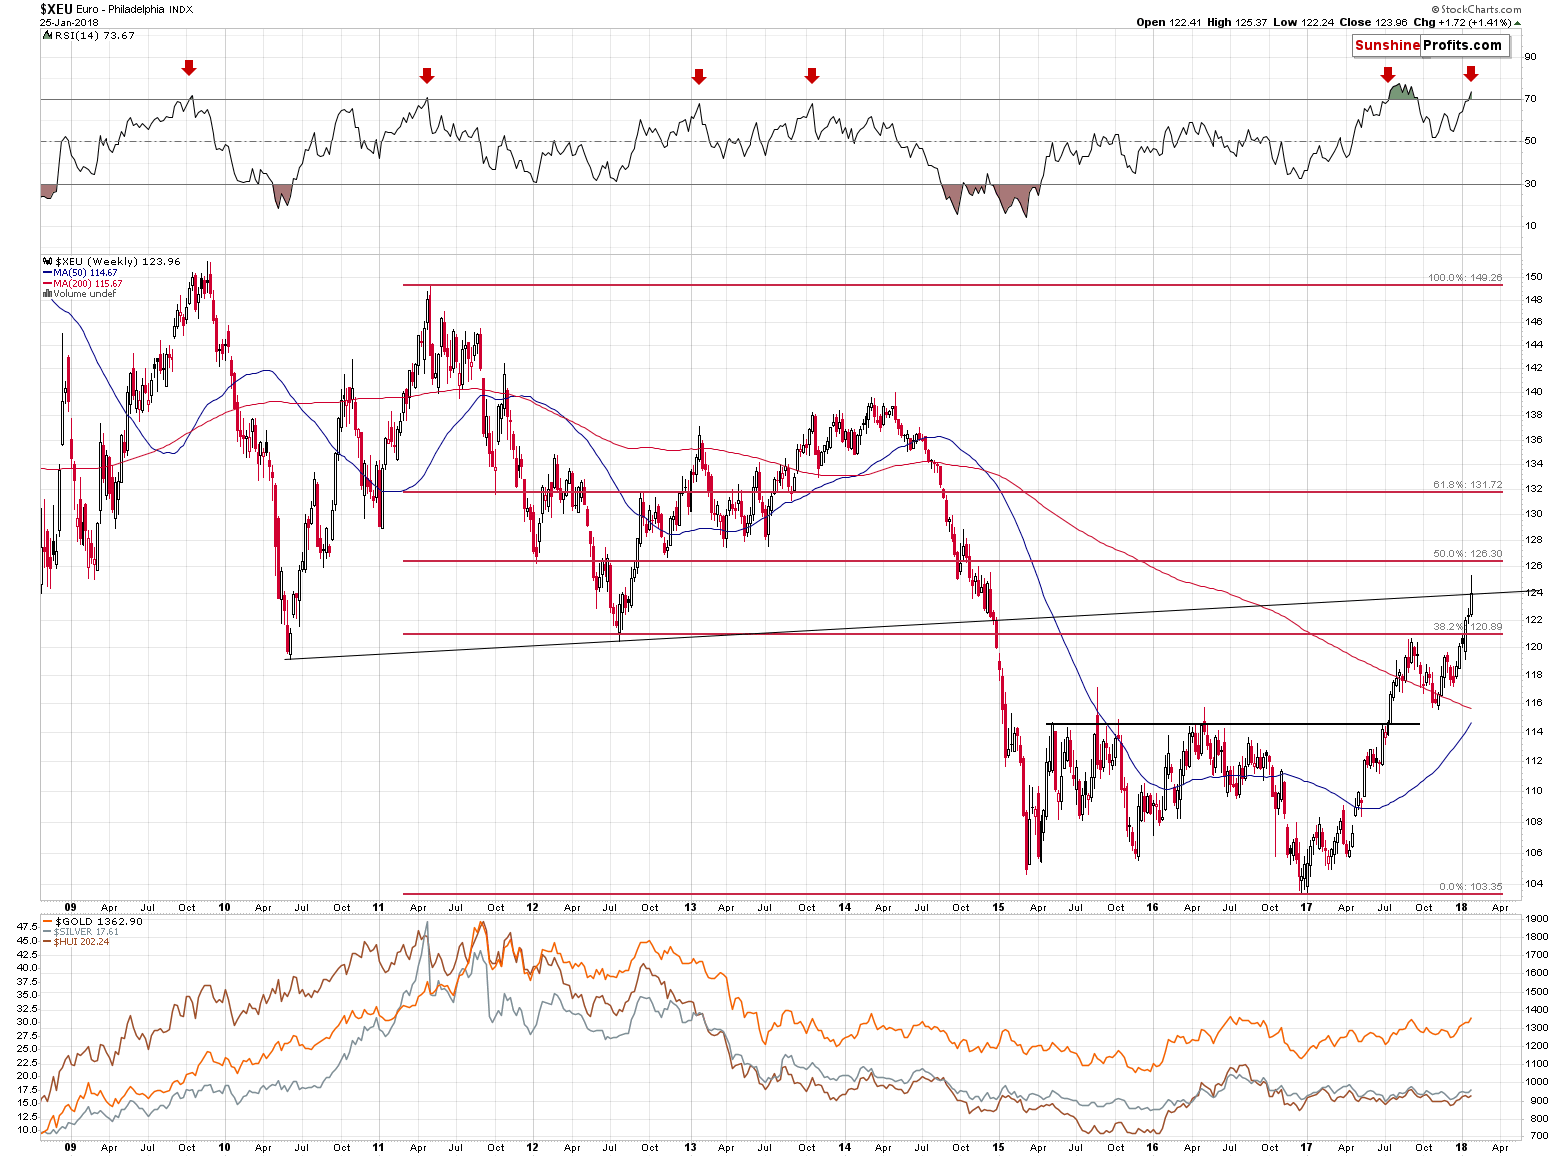
In our yesterday’s alert we noted that the Euro Index had broken above the 38.2% Fibonacci retracement level and that it had reached another resistance level. This one is created based on the 2010 and 2012 bottoms. It seems important, because its proximity stopped the decline in late 2014. It had stopped it for just a while, but still, it had showed that this line is indeed important.
We also noted the RSI indicator above the 70 level as the proximity of this level triggered bearish reversals several times in the past.
Based on yesterday’s session, the above-mentioned resistance line confirmed its usefulness once again. The Euro Index rallied above it, but it didn’t manage to hold the gains and declined before the end of the session, closing it a little below previous day’s closing price. We saw a major reversal after a major rally, while the RSI was overbought. The above serves as a perfect confirmation of USD Index’s bullish combination of signals.
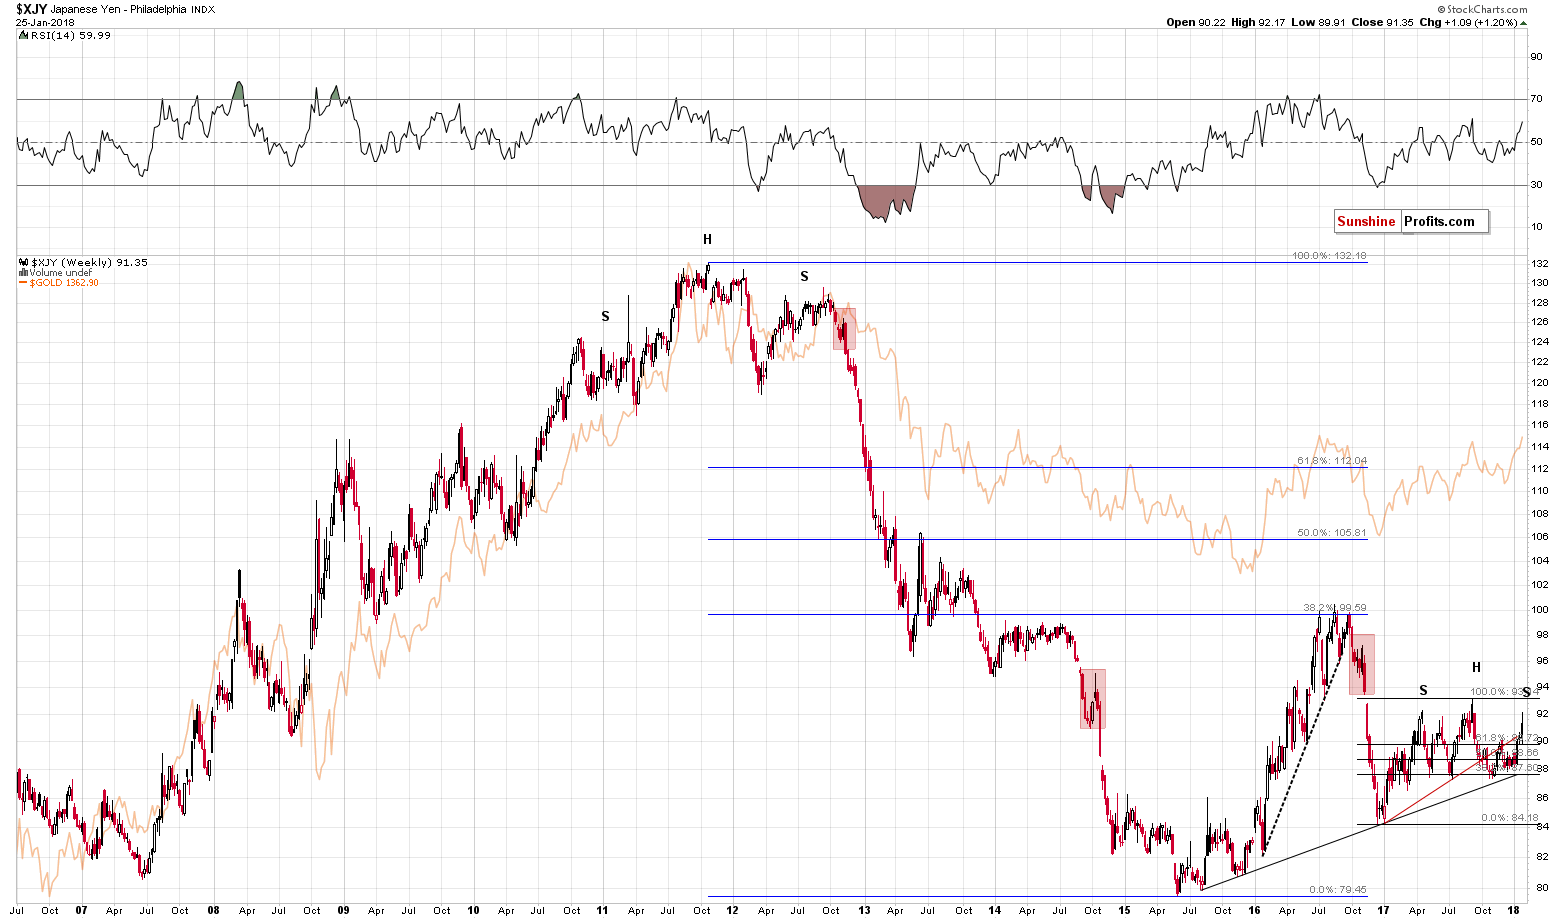
Meanwhile, the Japanese yen moved above the rising red support / resistance line. This move could still be invalidated, but it’s not that clear anymore – the yen is too much above the line for the reversal to be imminent.
So, while the short-term situation for the yen is unclear based on the long-term picture (you’ll find more short-term details in our Forex Trading Alerts), there is a – potentially – interesting development that we would like to mention. The formation is far from being complete, but it’s possible that a decline from here would result in a quite clear head-and-shoulders pattern.
What’s so interesting about it?
The 2011 tops in the yen and gold as well as the 2016 tops in yen and gold all took shape of this pattern. Moreover, the shoulders of the formations – tops – were formed at very similar price levels. The early 2011 top and the late 2012 top formed at very similar prices and we can say the same thing about the shoulder tops from late 2016.
Why is this significant?
Because yesterday’s intraday top was very close to the early 2017 tops – the first shoulder of the possible head-and-shoulders formation. This observation makes it more likely that the final top for the yen is already in or about to be in. This, in turn, makes the same more likely for the precious metals market.
Again, the above is just a possibility at this time as the head-and-shoulders formation is far from being completed, but it’s definitely something that’s worth keeping in mind.
Let’s move right to the point. The golden point. In today’s analysis we will use the GLD ETF as a proxy for gold as it seems that the data for metals from Stockcharts is not close to being correct (for instance it’s showing a price increase in silver while there clearly was a decrease yesterday).
Big-Volume Reversal in Gold
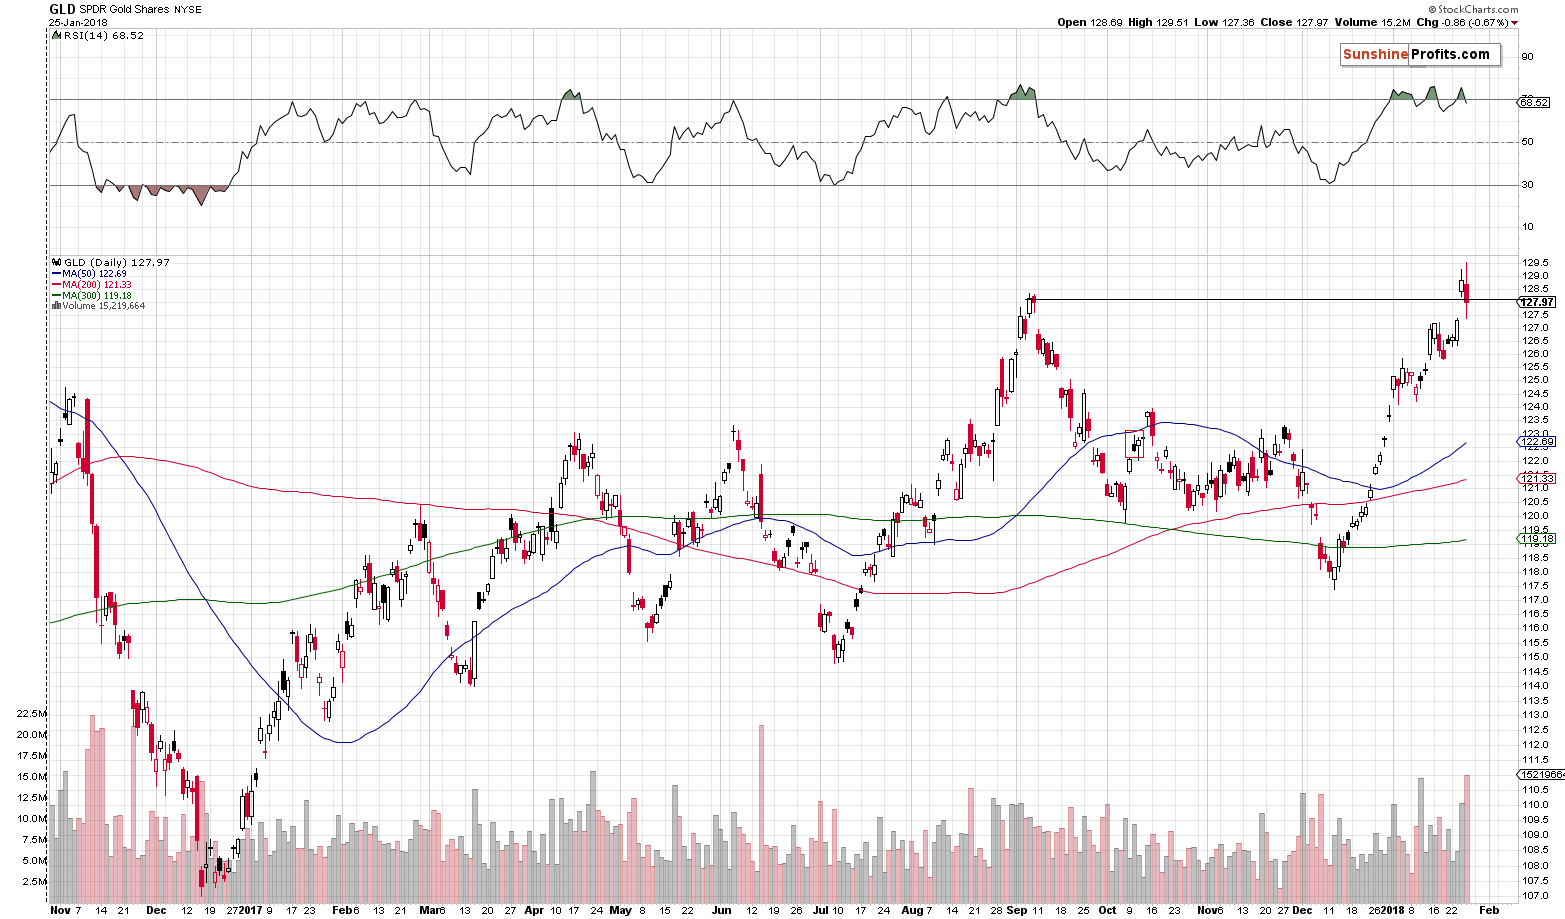
The key development is gold’s decline and close back below the highest close of September. In other word, it’s the invalidation of gold’s breakout. It took place on huge volume, which validates and strengthens the impact of the invalidation. It’s also bearish on a stand-alone basis.
The most important thing is that gold didn’t even manage to rally above $1,370 despite USD’s volatile decline during yesterday’s session. In the previous alerts we thoroughly described the likely strength of reaction in light of the possible decline in the USD and while gold moved in precise tune with it, yesterday, it didn’t even manage to do just that. Gold’s lack of strength was astonishing and that (along with the levels that the USD reached) was the factor that made us strongly increase the size of our short positions once again (they had been limited previously). The implications of the above remain bearish and today’s small pre-market upswing doesn’t change it.
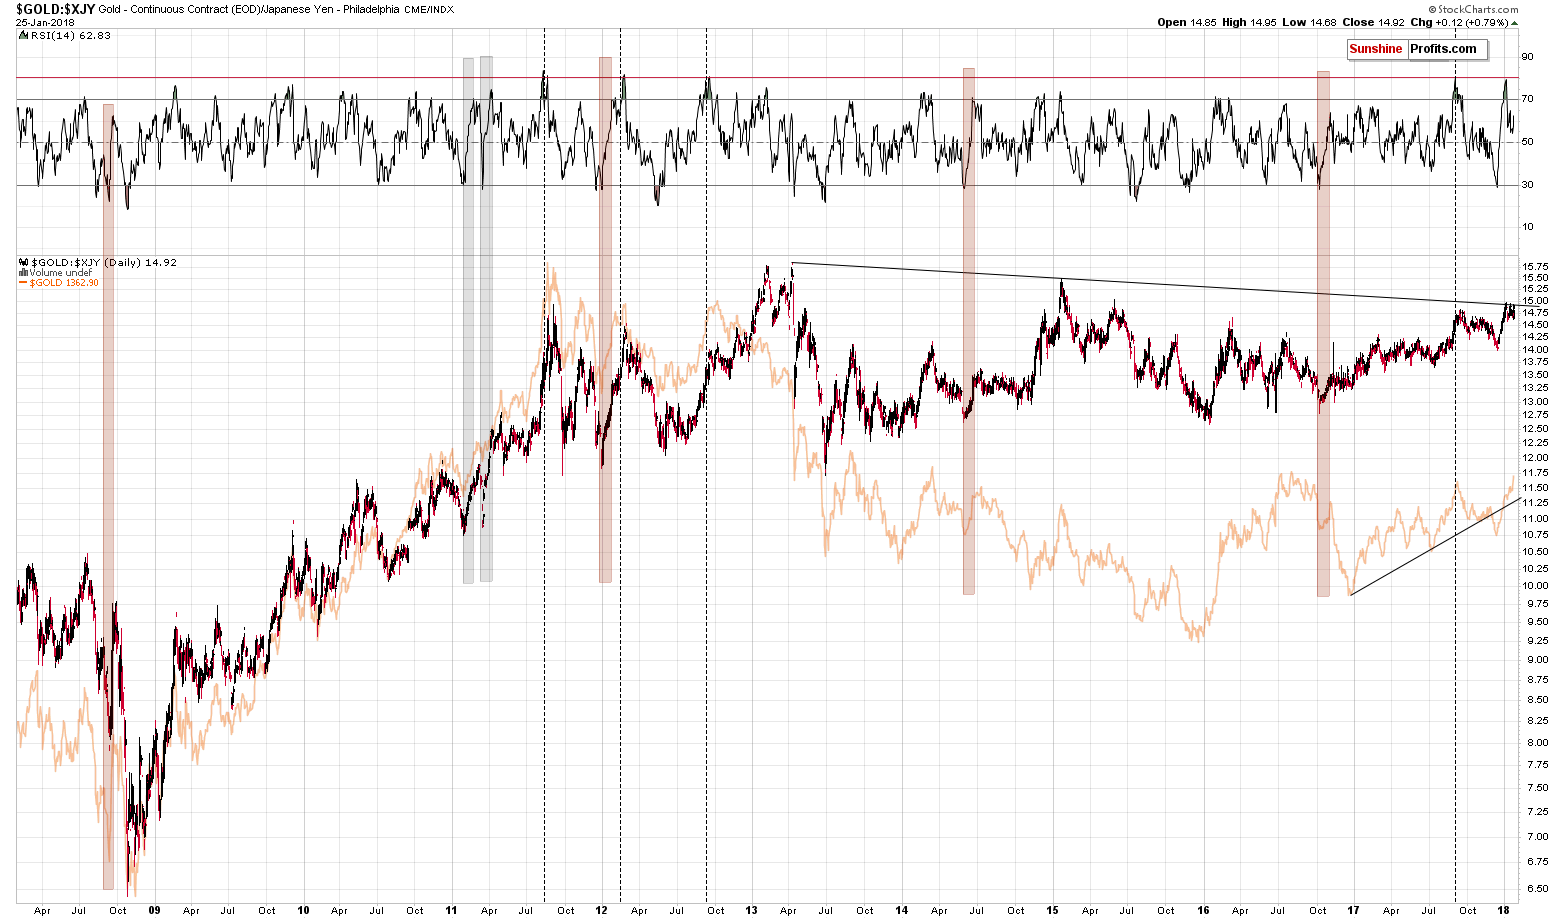
Looking at gold’s performance in terms of the Japanese yen from the big perspective, we see that there was recently no breakout at all – only another move to the declining, long-term resistance line. Since the latter was not broken, the bearish implications of its proximity remain in place.
Miners’ Clear Invalidations
Before summarizing, we have two additional charts for you. The first of them is covered quite rarely.
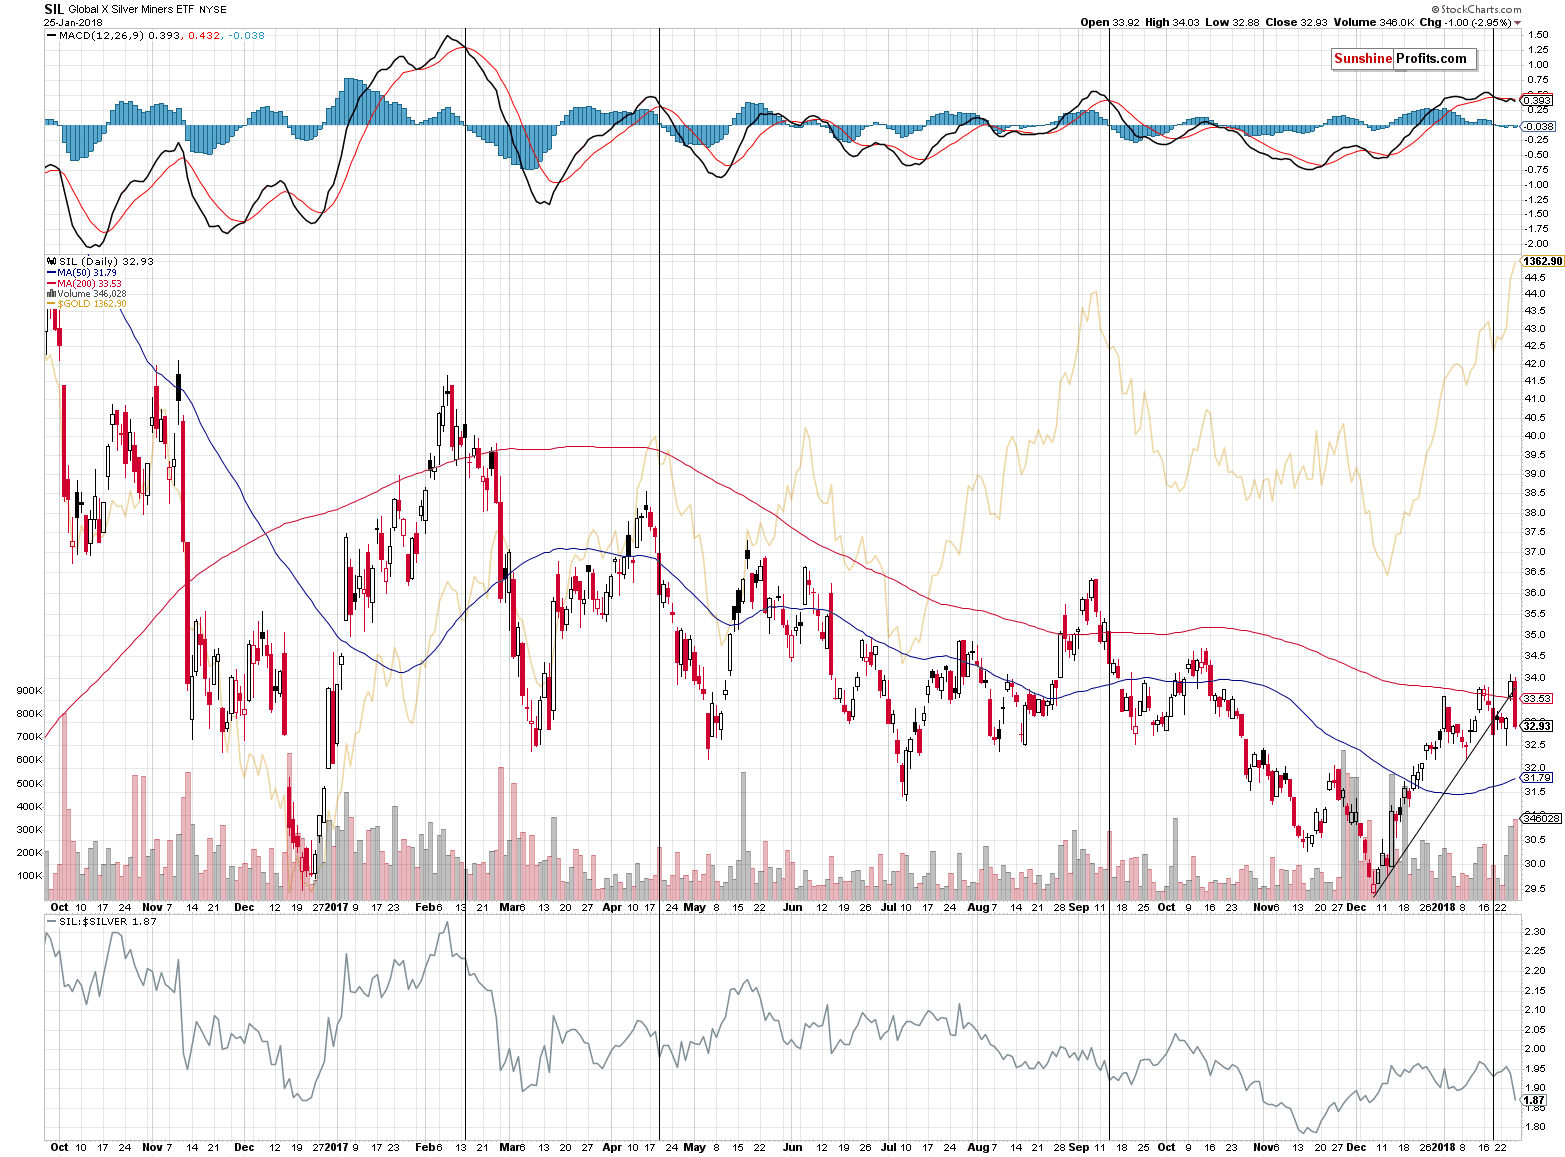
The SIL ETF serves as a proxy for silver miners. Interestingly, silver stocks invalidated an entire week of gains during just one session – the ETF closed below Monday’s opening price.
Is this something that one would expect to see during a major rally in the precious metals? No. That’s a subtle suggestion that the rally that we saw in December and previously in 2018 is nothing more than just a counter-trend correction.
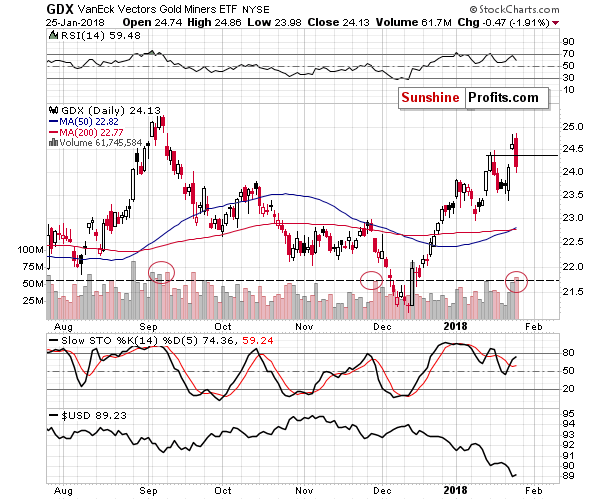
In fact, the entire mining stock sector moved lower on huge volume (biggest daily volume of 2018) and it invalidated the breakout above the previous 2018 high. The volume is very important with regard to the invalidation, but also by itself.
There were only two cases in the recent past when GDX declined on similarly big volume after a rally. We marked these situations with red ellipses. Sizable downswings followed in both cases, so the implications here are bearish as well.
Summing up, the USD’s epic turnaround along with gold’s extraordinary weakness relative to the USD’s intraday decline along with multiple bearish confirmations paint a very bearish picture for the precious metals market for the following weeks. Before calling us perma-bears, please note that we’re expecting to see gold well above its 2011 high in a few years, likely more than doubling its price. We just don’t think that the key buying opportunity is already behind us and we want to prepare you for taking advantage of it.
Naturally, the above is up-to-date at the moment of publishing it and the situation may – and is likely to – change in the future. If you’d like to receive follow-ups to the above analysis (including the intraday ones, when things get hot), we invite you to subscribe to our Gold & Silver Trading Alerts.
Thank you.
Sincerely,
Przemyslaw Radomski, CFA
Founder, Editor-in-chief, Gold & Silver Fund Manager
Gold & Silver Trading Alerts
Forex Trading Alerts
Oil Investment Updates
Oil Trading Alerts
