

On Friday, the total value of U.S. national debt surpassed $20 trillion. What does it imply for the gold market?
As one can see in the chart below, U.S. public debt approached $20 trillion in the second quarter. Last week, it finally surpassed this level for the first time in history. It means that the debt also exceeds GDP.
Chart 1: U.S. public debt (blue line, left axis) and U.S. public debt as percent of GDP (red line, right axis) between 1966 and 2017.
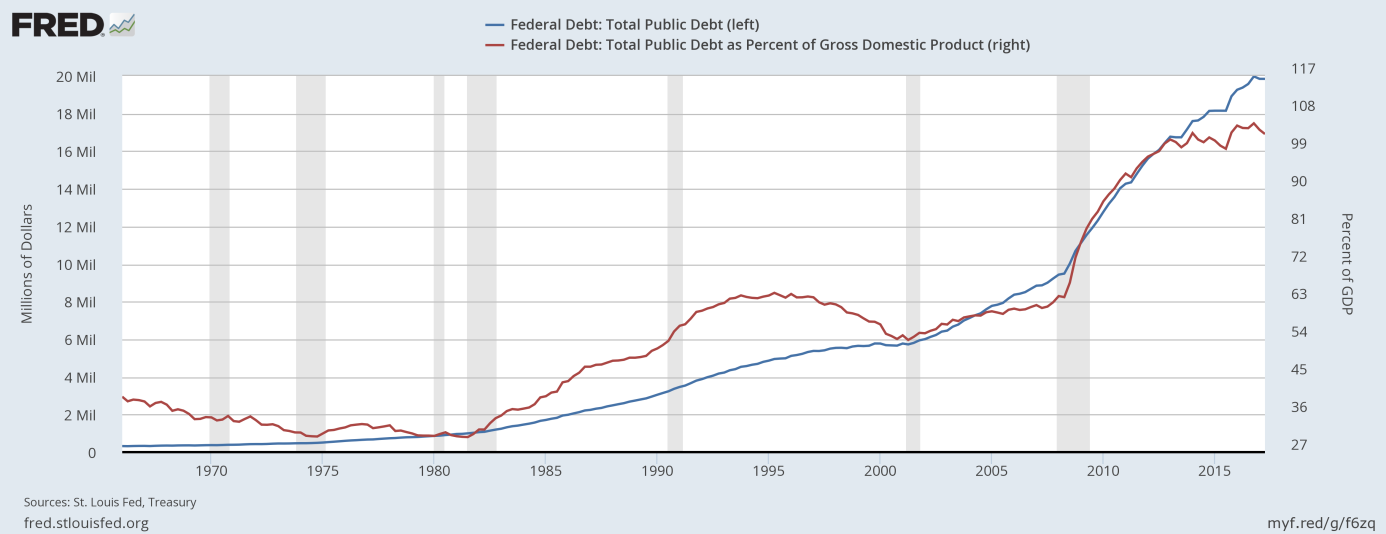
To make matters worse, the U.S. indebtedness is not likely to get better anytime soon, as the 2017 fiscal year will add another $700-billion deficit. And the possible removal of the debt ceiling will only deteriorate the situation.
What does it all mean for the gold market? Well, the worsening of the U.S. fiscal position could support gold prices, as it was during the 2000s.
Chart 2: U.S. public debt as percent of GDP (red line, left axis) and gold prices (blue line, right axis, London P.M. Fix) between 1966 and 2017.
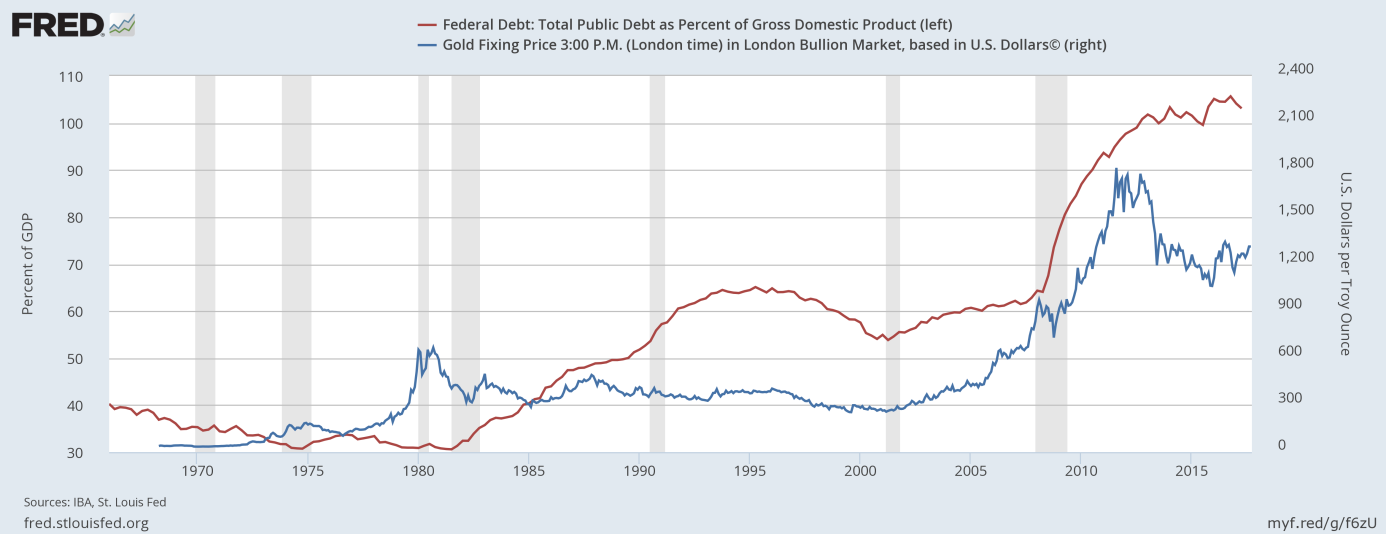
However, the long-term relationship between the U.S. public debt and the price of gold is rather ambiguous. The truth is that the ratio of public debt to GDP is not the best metric of the government’s ability to service its debt (governments do not repay debt with GDP). Moreover, what is probably more important is the level of private debt, not the public one, especially in the case of the issuer of the world reserve currency.
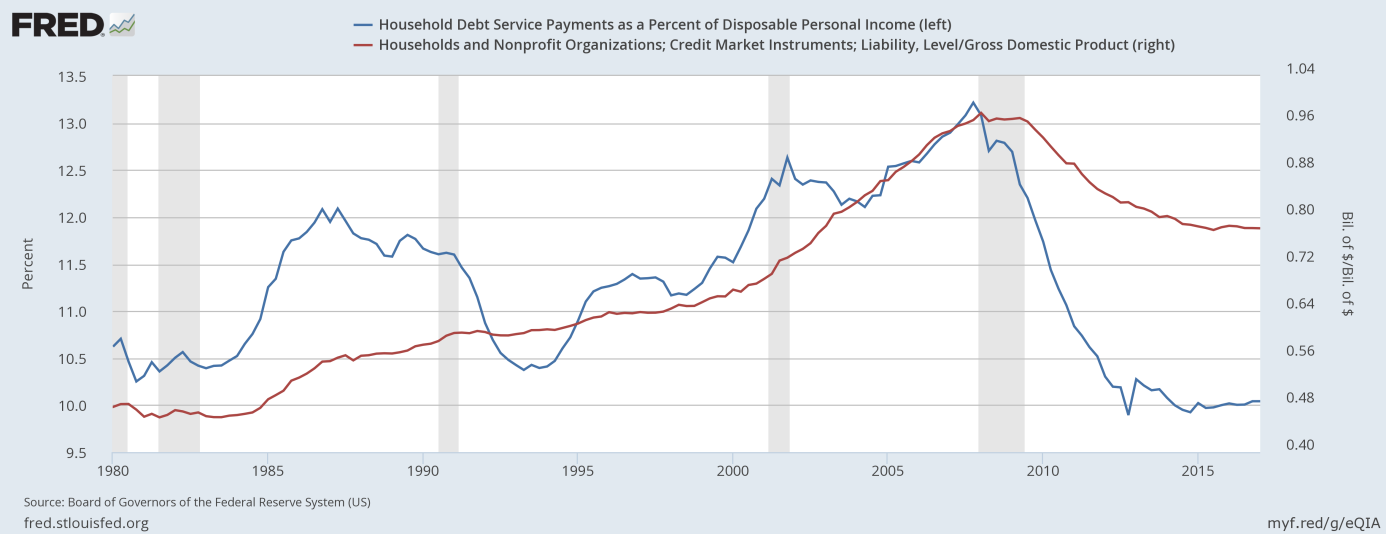
Look at the chart below. Both household debt as a share of GDP and the household debt service payments as a percent of disposable personal income have fallen dramatically in the last few years.
Chart 3: Household debt as a percent of GDP (red line, right axis) and the household debt service payments as a percent of disposable personal income (blue line, left axis) since the 1980s.
Summing up, the U.S. public debt surpassed $20 trillion. Such a level of debt in peacetime is worrisome, but investors should not panic, as the crossing of the arbitrary threshold will not automatically sink the economy, especially given that the private sector has deleveraged significantly. Hence, gold is not likely to rally because the debt reached $20 trillion, but if the high indebtedness translates into weakness in the greenback – as was the case in the 2000s – the yellow metal will shine. Stay tuned!
If you enjoyed the above analysis, we invite you to check out our other services. We focus on fundamental analysis in our monthly Market Overview reports and we provide daily Gold & Silver Trading Alerts with clear buy and sell signals. If you’re not ready to subscribe yet and are not on our mailing list yet, we urge you to join our gold newsletter today. It’s free and if you don’t like it, you can easily unsubscribe.
Disclaimer: Please note that the aim of the above analysis is to discuss the likely long-term impact of the featured phenomenon on the price of gold and this analysis does not indicate (nor does it aim to do so) whether gold is likely to move higher or lower in the short- or medium term. In order to determine the latter, many additional factors need to be considered (i.e. sentiment, chart patterns, cycles, indicators, ratios, self-similar patterns and more) and we are taking them into account (and discussing the short- and medium-term outlook) in our trading alerts.
Thank you.
Arkadiusz Sieron
Sunshine Profits‘ Gold News Monitor and Market Overview Editor
Gold News Monitor
Gold Trading Alerts
Gold Market Overview
