

Briefly:
Intraday trade: The S&P 500 index may continue to retrace its Tuesday's move up today. Therefore, intraday short position is favored again. Stop-loss is at the level of 2,460 or 5 points above Tuesday's daily high. Potential profit target is at 2,425, below Tuesday's daily gap up (S&P 500 index).
Our intraday outlook is bearish, and our short-term outlook is bearish, as we expect downward correction. Our medium-term outlook remains bearish:
Intraday outlook (next 24 hours): bearish
Short-term outlook (next 1-2 weeks): bearish
Medium-term outlook (next 1-3 months): bearish
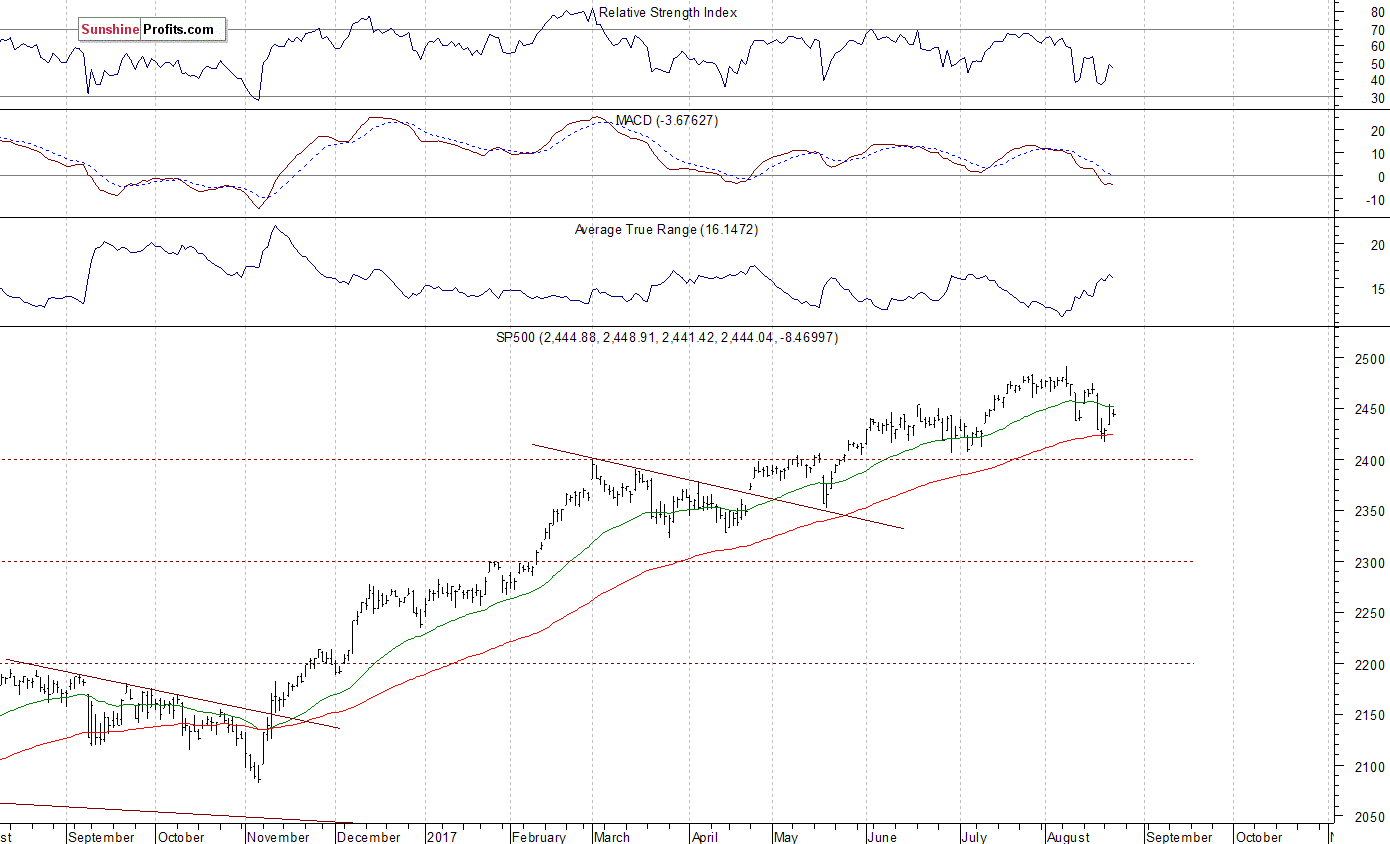
The main U.S. stock market indexes lost 0.3-0.4% on Wednesday, retracing some of their Tuesday's rally, as investors took short-term profits off the table following worse-than-expected economic data releases. The S&P 500 index bounced off support level on Tuesday, as it got back to 2,450 mark. It currently trades 1.9% below the August 8 all-time high of 2,490.87. The Dow Jones Industrial Average got close to the level of 21,800 yesterday, as it fell 0.4%. The technology Nasdaq Composite trades around 2.8% below its record high of 6,460.84. The nearest important level of resistance of the S&P 500 index is at 2,450-2,455, marked by Tuesday's local high. The next resistance level is at 2,465-2,475, marked by previous support level and local highs. The resistance level is also at 2,490-2,500, marked by the above-mentioned all-time high. On the other hand, support level is at 2.430-2,435, marked by Tuesday's daily gap up of 2,430.58-2,433.67. The next support level remains at 2,400-2,420. The market retraced some of its recent downtrend on Tuesday, but failed to extend its short-term uptrend yesterday. Is this a new uptrend or just upward correction? There have been no confirmed positive signals so far. We still can see some negative technical divergences. But will they lead to medium-term downward correction? The S&P 500 index trades within a medium-term consolidation following early June breakout above 2,400 mark, as we can see on the daily chart:
More Fluctuations
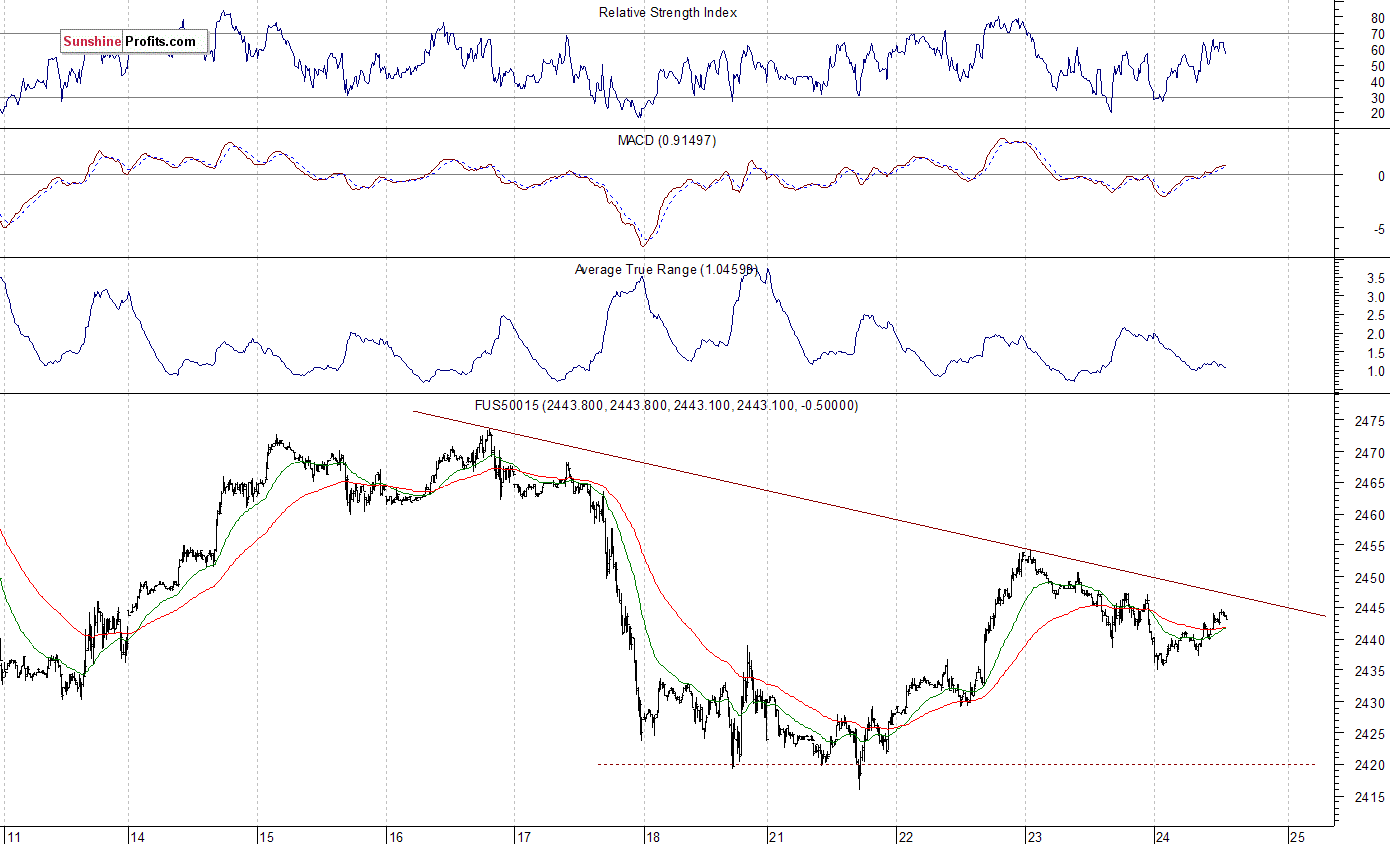
Expectations before the opening of today's trading session are slightly positive, with index futures currently up % vs. yesterday's closing prices. The European stock market indexes have gained % so far. Investors will now wait for some economic data announcements: Initial Claims at 8:30 a.m., Existing Home Sales at 10:00 a.m. The market expects that the Existing Home Sales number was at 5.55M in July. Investors will also wait for the Jackson Hole Economic Policy Symposium outcomes. The S&P 500 futures contract trades within an intraday uptrend following an overnight decline. The nearest important level of resistance is at around 2,440-2,445, marked by some short-term local highs. The next resistance level is at around 2,450-2,455, marked by Tuesday's local highs. On the other hand, support level is at 2,430-2,440, marked by previous level of resistance. Will the market continue its Tuesday's rally? Or was this just some quick bounce following recent move down?
Uptrend Or Just Bounce?
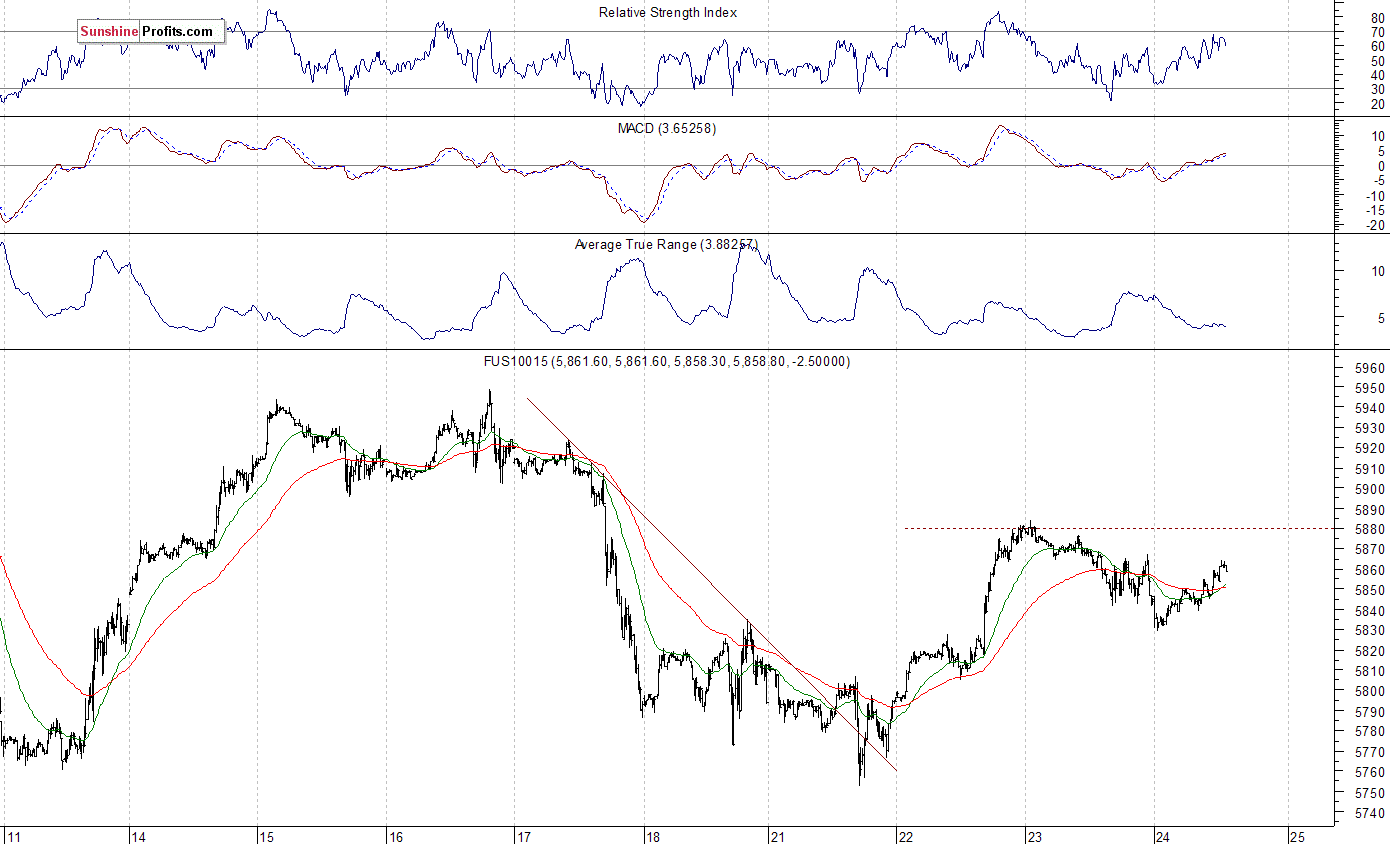
The technology Nasdaq 100 futures contract follows a similar path, as it trades within an intraday uptrend. It retraces its overnight decline. The nearest important level of resistance is at around 5,880-5,600. On the other hand, support level is at 5,800-5,850. The Nasdaq futures contract has retraced most of its last week's Thursday's sell-off. However, it trades within a short-term consolidation, as the 15-minute chart shows:
Concluding, the S&P 500 index slightly retraced its Tuesday's rally on Wednesday, as investors took short-term profits off the table. Will the market continue its recent uptrend? Or is this just a quick upward correction before another leg down? There have been no confirmed positive signals so far. We still can see some medium-term overbought conditions along with negative technical divergences.
If you enjoyed the above analysis and would like to receive free follow-ups, we encourage you to sign up for our daily newsletter – it’s free and if you don’t like it, you can unsubscribe with just 2 clicks. If you sign up today, you’ll also get 7 days of free access to our premium daily Gold & Silver Trading Alerts. Sign up today!.
Thank you.
Paul Rejczak
Stock Trading Strategist
Stock Trading Alerts
