Our pairs with open positions moved like clockwork yesterday. And not only the Australian dollar, where we took some nice profits off the table late last week. It’s wise to ring the cashier’s bell when the markets offer us profits. And it‘s even better to do so in a well-justified chart position. Let‘s take a look what we mean by that.
EUR/USD – Approaching the Support
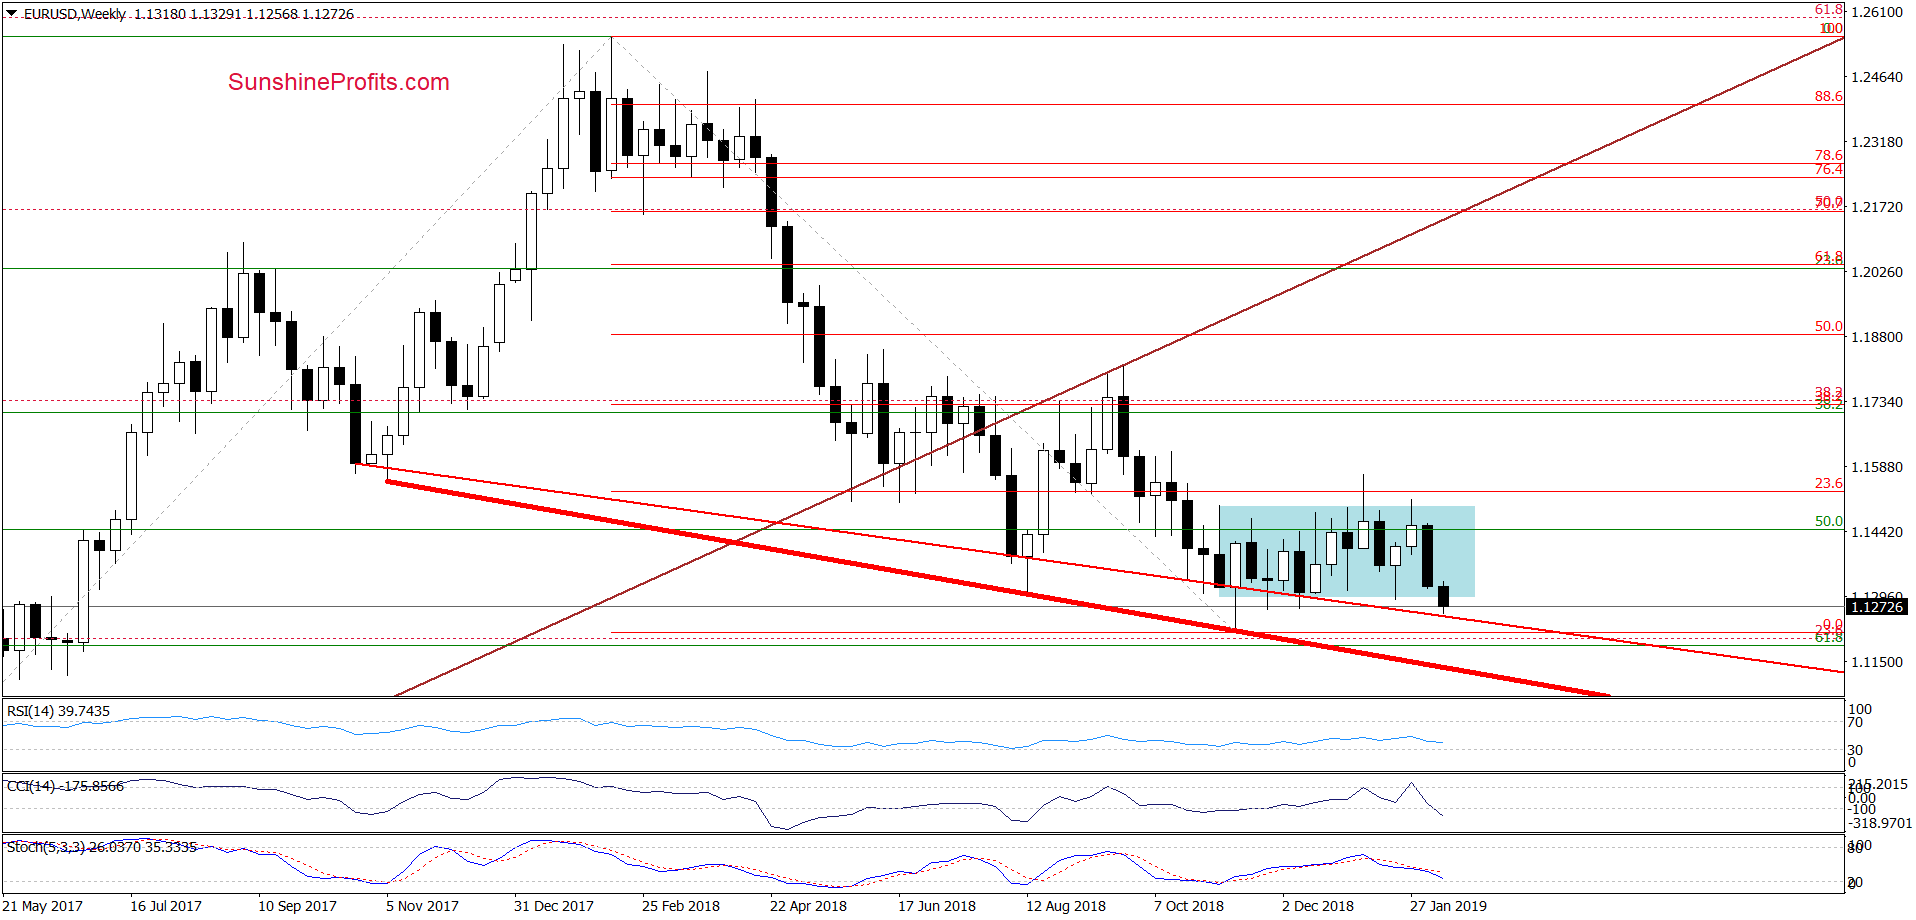
We’ll start with the weekly chart. Yesterday, we wrote:
(…) As the CCI issued its sell signal and the Stochastic Oscillator’s sell signal is on, we are of the opinion that further deterioration is still ahead of us.
The situation developed in line with our assumptions and EUR/USD moved lower during yesterday’s session. Thanks to this decline, the exchange rate broke below the lower border of the blue consolidation and approached the long-term red support line based on October 22, 2017 and August 5, 2018 lows.
This line managed to stop the sellers several times in the past, which increases the probability that we could see a similar price action in the very near future – especially when we factor in the short-term view. What do we mean by that?
Let’s recall yesterday’s quote again:
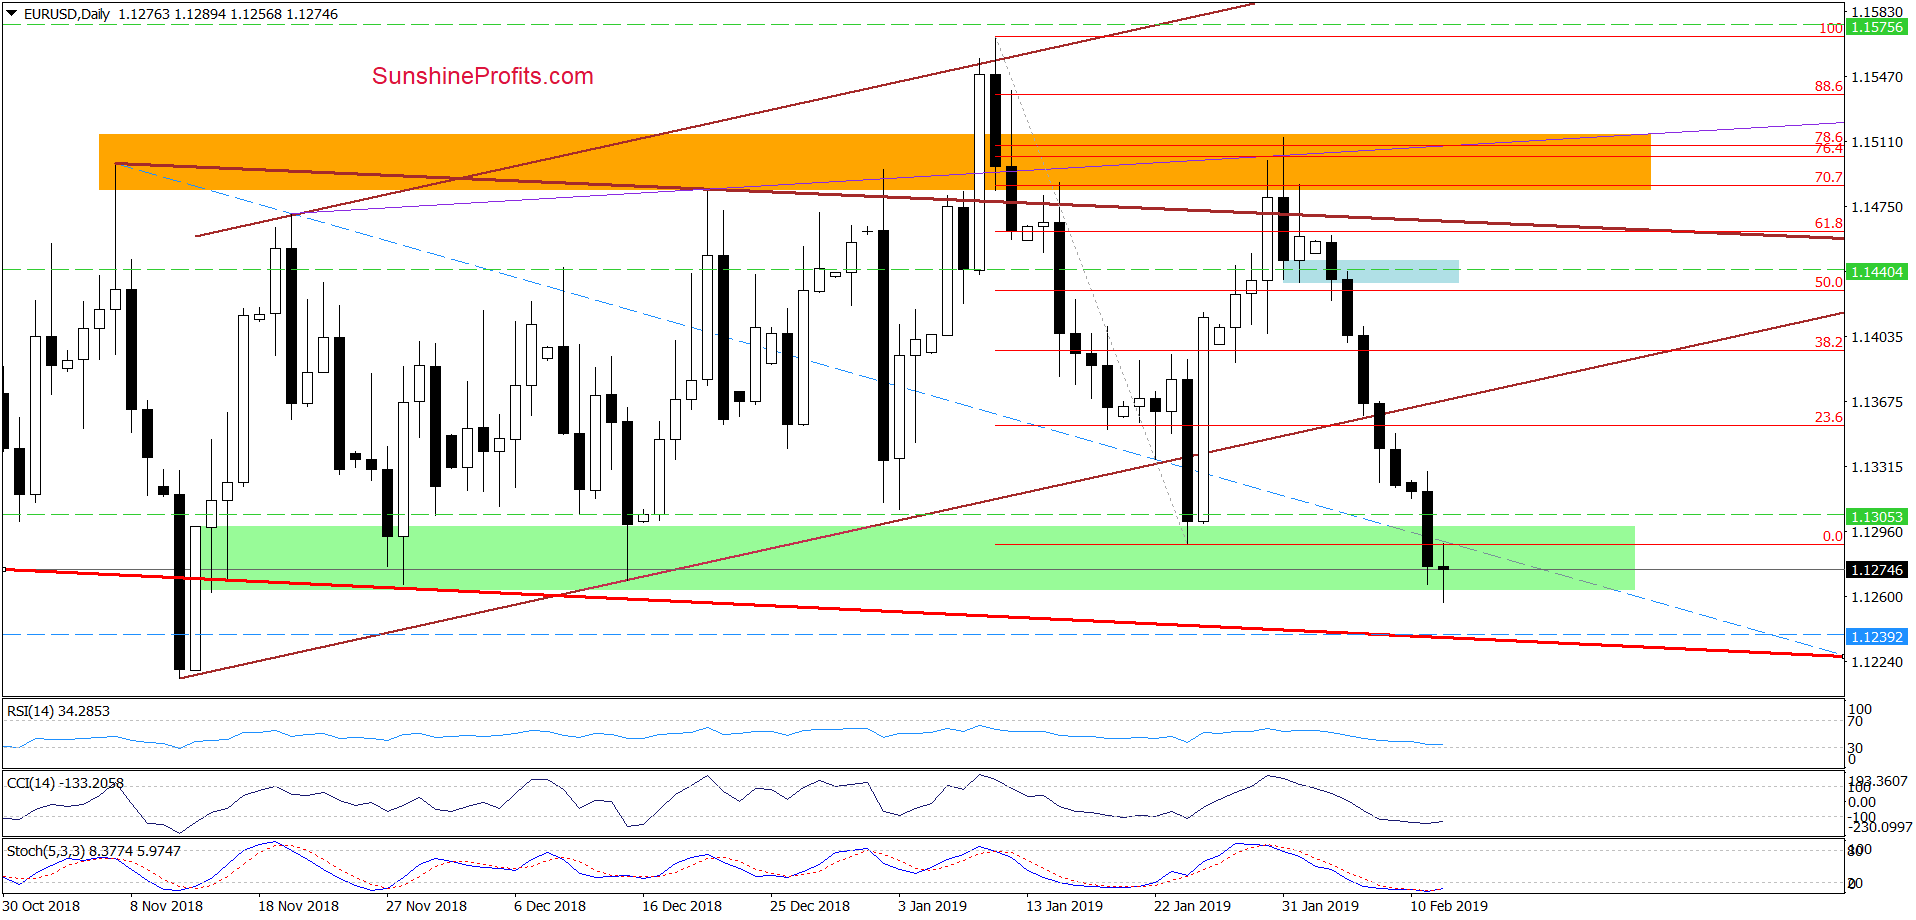
(…) EUR/USD finished another session below the lower border of the brown rising trend channel. As there are no buy signals generated by the daily indicators, the probability of another attempt to move lower remains high.
Taking this fact into account, we believe that (…) we’ll see a realization our pro-bearish scenario:
(…) EUR/USD will likely turn south and re-test the lower border of the brown triangle or even the green support area, which stopped the sellers several times in recent weeks.
Finishing today’s commentary on this currency pair, we would like to add that we decided to move our stop-loss order below the entry price to protect some of our profits. Additionally, if the exchange rate drops to our initial downside target, we’ll close half of the current position and take profits off the table. The other half will stay in play with the lowered stop-loss order.
Our subscribers were prepared and from today’s point of view, we see that EUR/USD moved sharply lower during yesterday’s session. The pair closed well below our initial downside target. In this way, half of our positions was closed with a profit and the other half became even more profitable (as a reminder, we opened them in the vicinity of the declining brown line within the trend channel, see here).
Earlier today, the pair initially moved even lower, which suggests that we could see a test of the lower border of the red declining trend channel. This can be seen more clearly on the chart below.
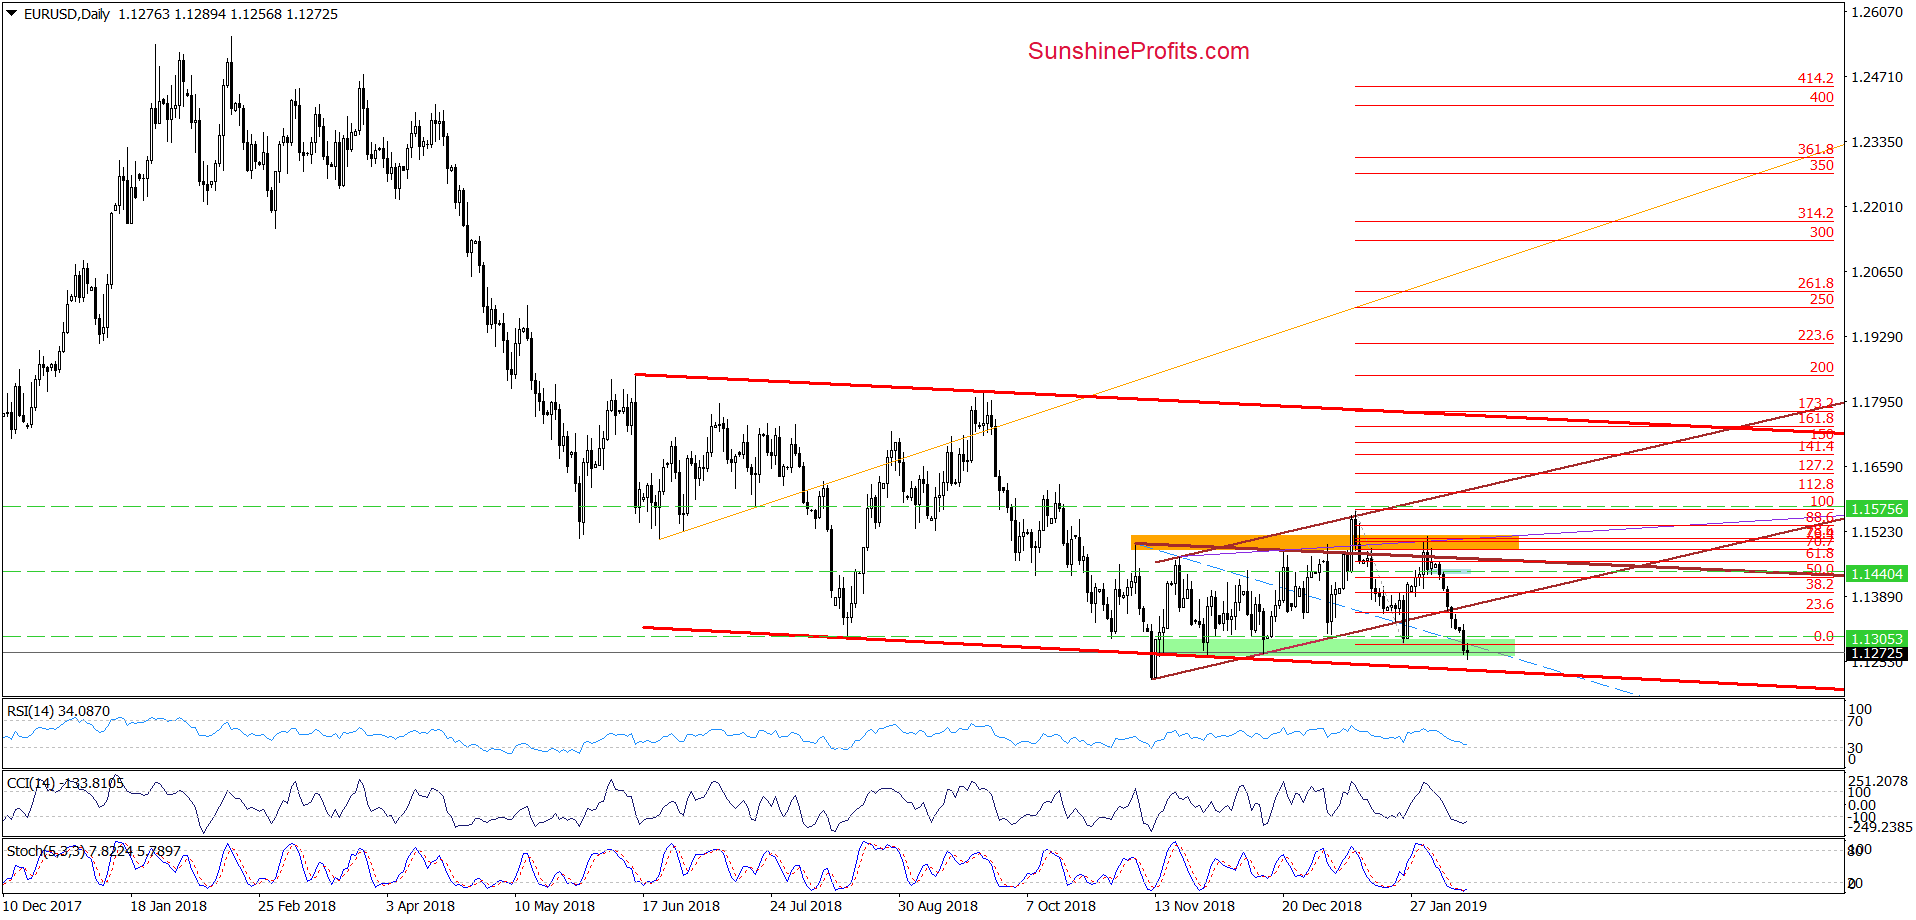
Considering this fact, we decided to move our downside target lower (details are reserved for our subscribers) – slightly above this important support. What’s next for the exchange rate?
Taking into account the proximity to the above mentioned long-term support line, the lower border of the red declining trend channel and the current position of the daily indicators, we think that the space for declines may be limited. A reversal in the coming day(s) can’t be ruled out.
Therefore, we decided to also move our stop-loss order lower to protect our profits. Again, details are reserved for our subscribers - we’ll keep them informed should anything change, or should we see a confirmation/invalidation of the above.
GBP/USD – At the Support
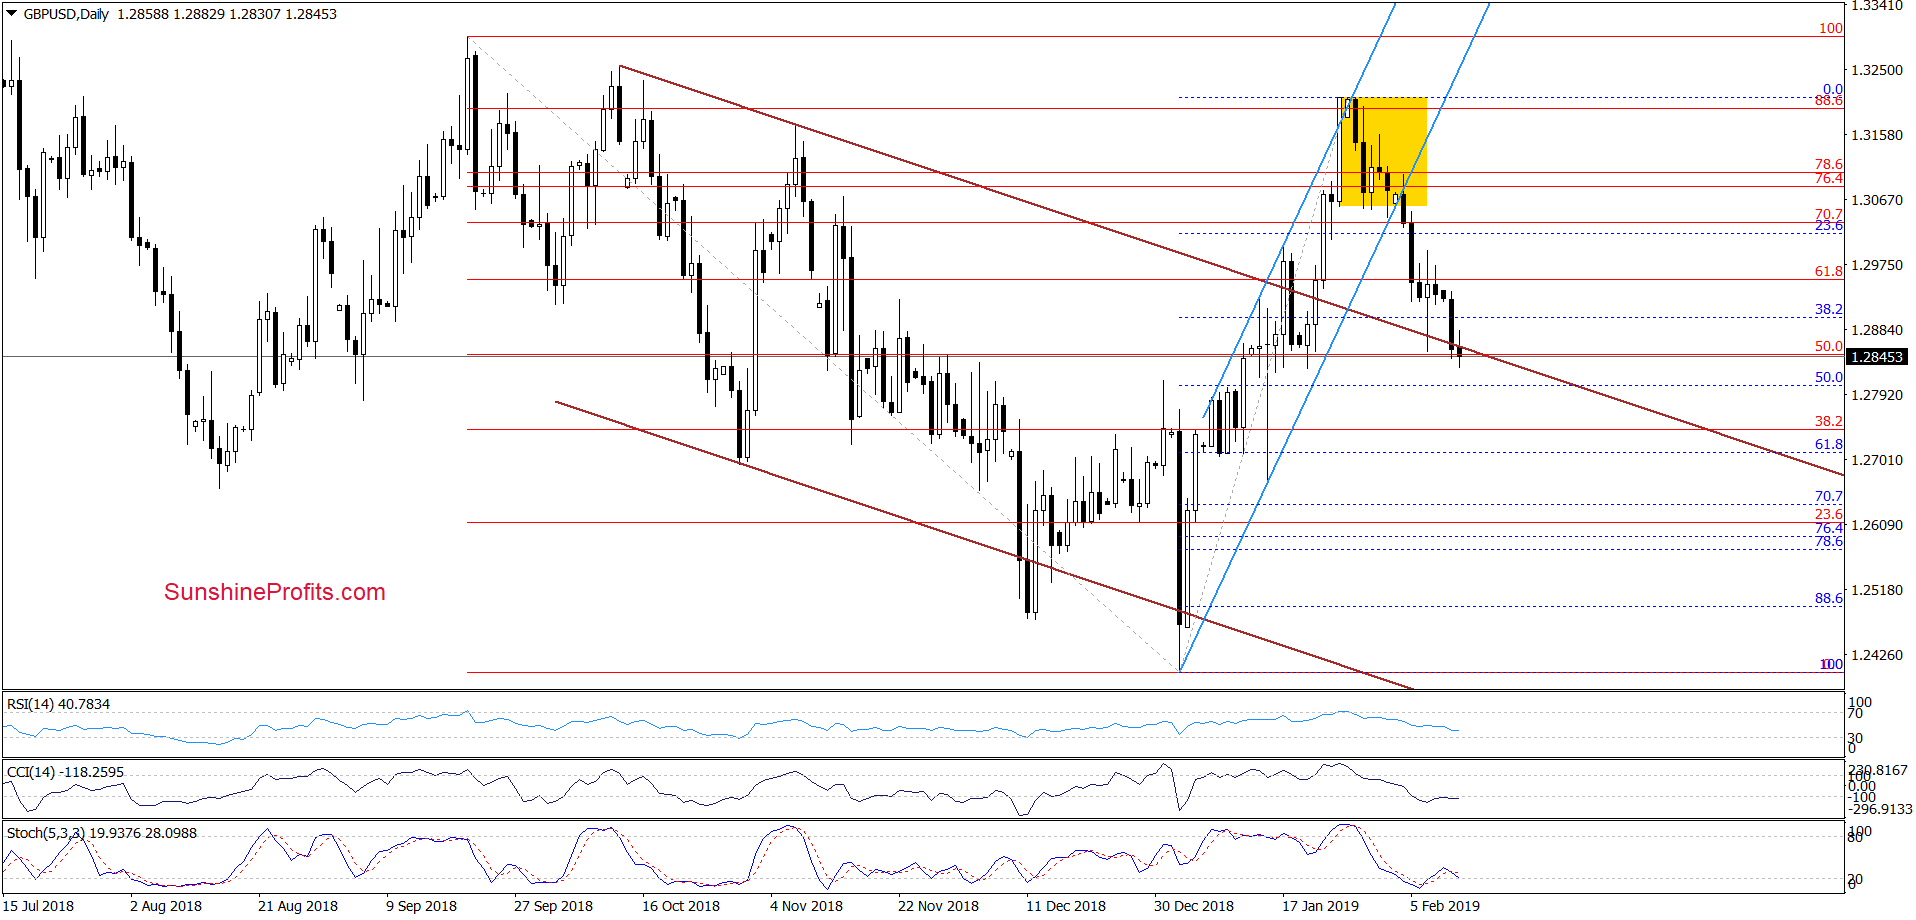
Although GBP/USD bounced off the previously-broken upper border of the brown declining trend channel, the buyers didn’t manage to trigger further improvement. There was no comeback to the lower line of the yellow consolidation.
This show of weakness encouraged the bears to act, which translated into another move to the downside. As a result, the exchange rate closed yesterday’s session below the upper line of the brown channel, which doesn’t bode well for the higher values of the rate down the line.
Earlier today, the pair initially extended losses, which suggests that we could see further deterioration (even to the 61.8% Fibonacci retracement). Nevertheless, when we zoom out and take a look at the weekly chart, we can see that currency bulls have one ace up their sleeves – the previously-broken resistance-turned-support orange line.
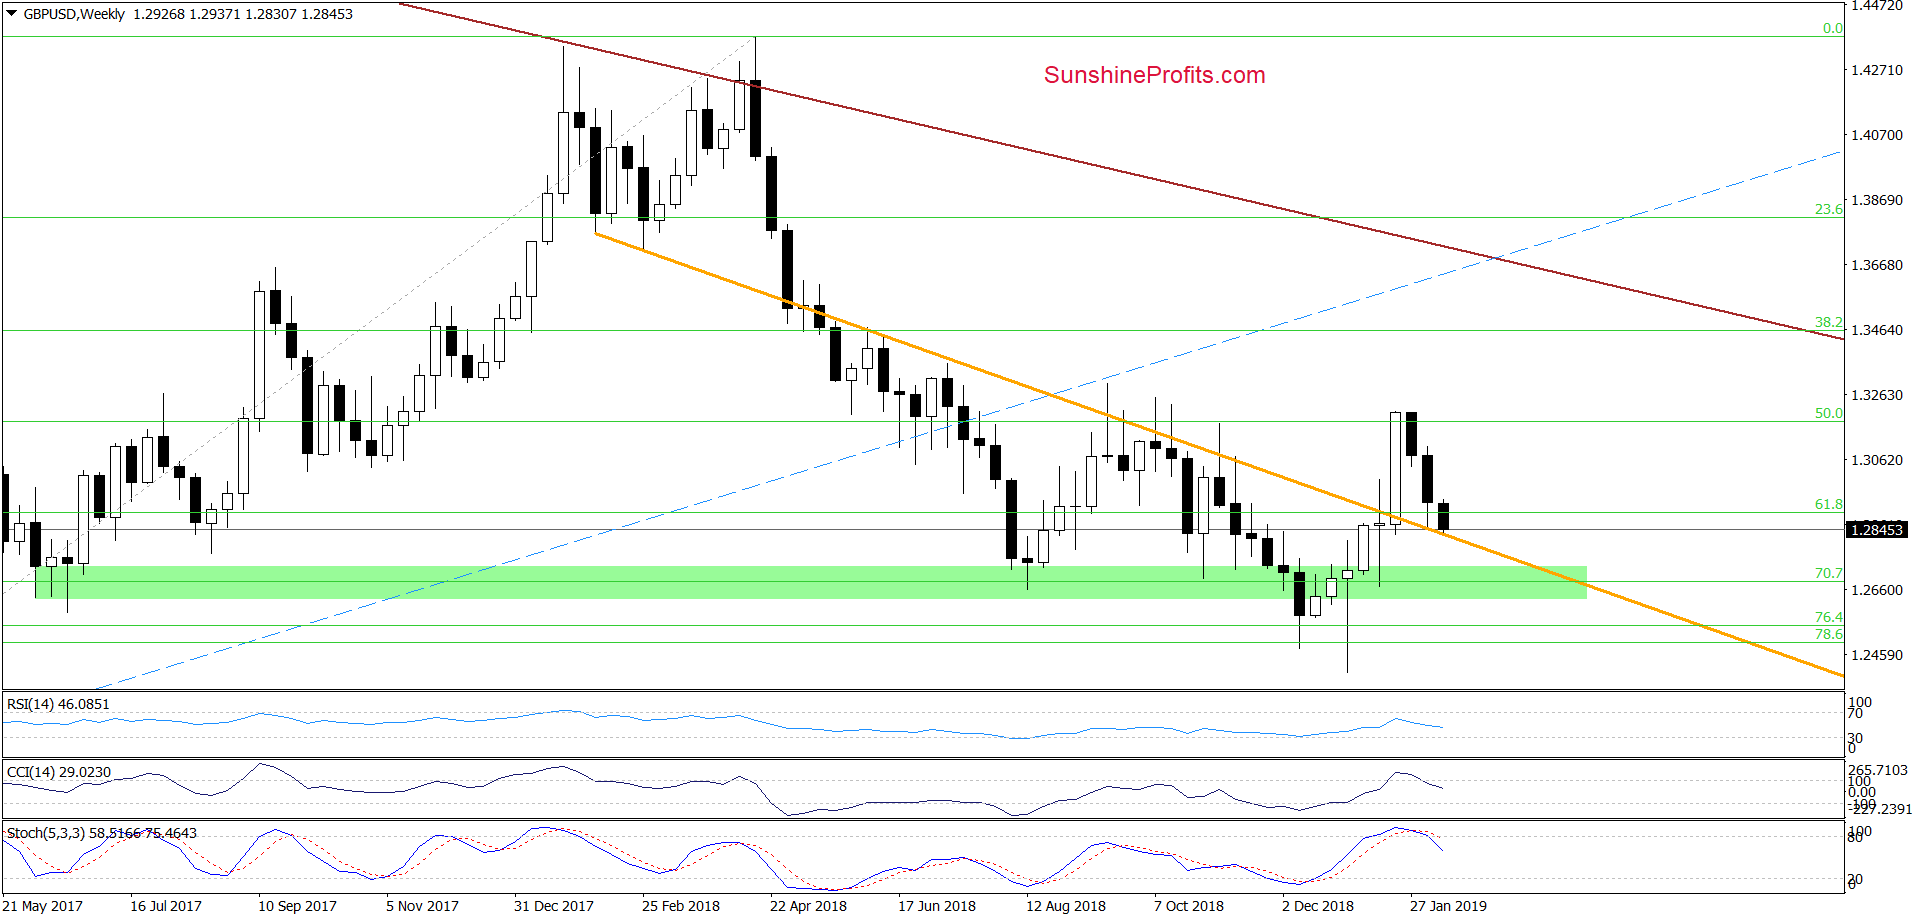
This line was strong enough to stop the sellers many times in the past. It suggests that it could stop them for the second time in a row now – just like a week ago.
If it holds, the path to the above-mentioned 61.8% Fibonacci retracement on the daily chart would be open. If it doesn’t hold, we’d consider opening short positions.
USD/CHF – On the Verge of Reversal
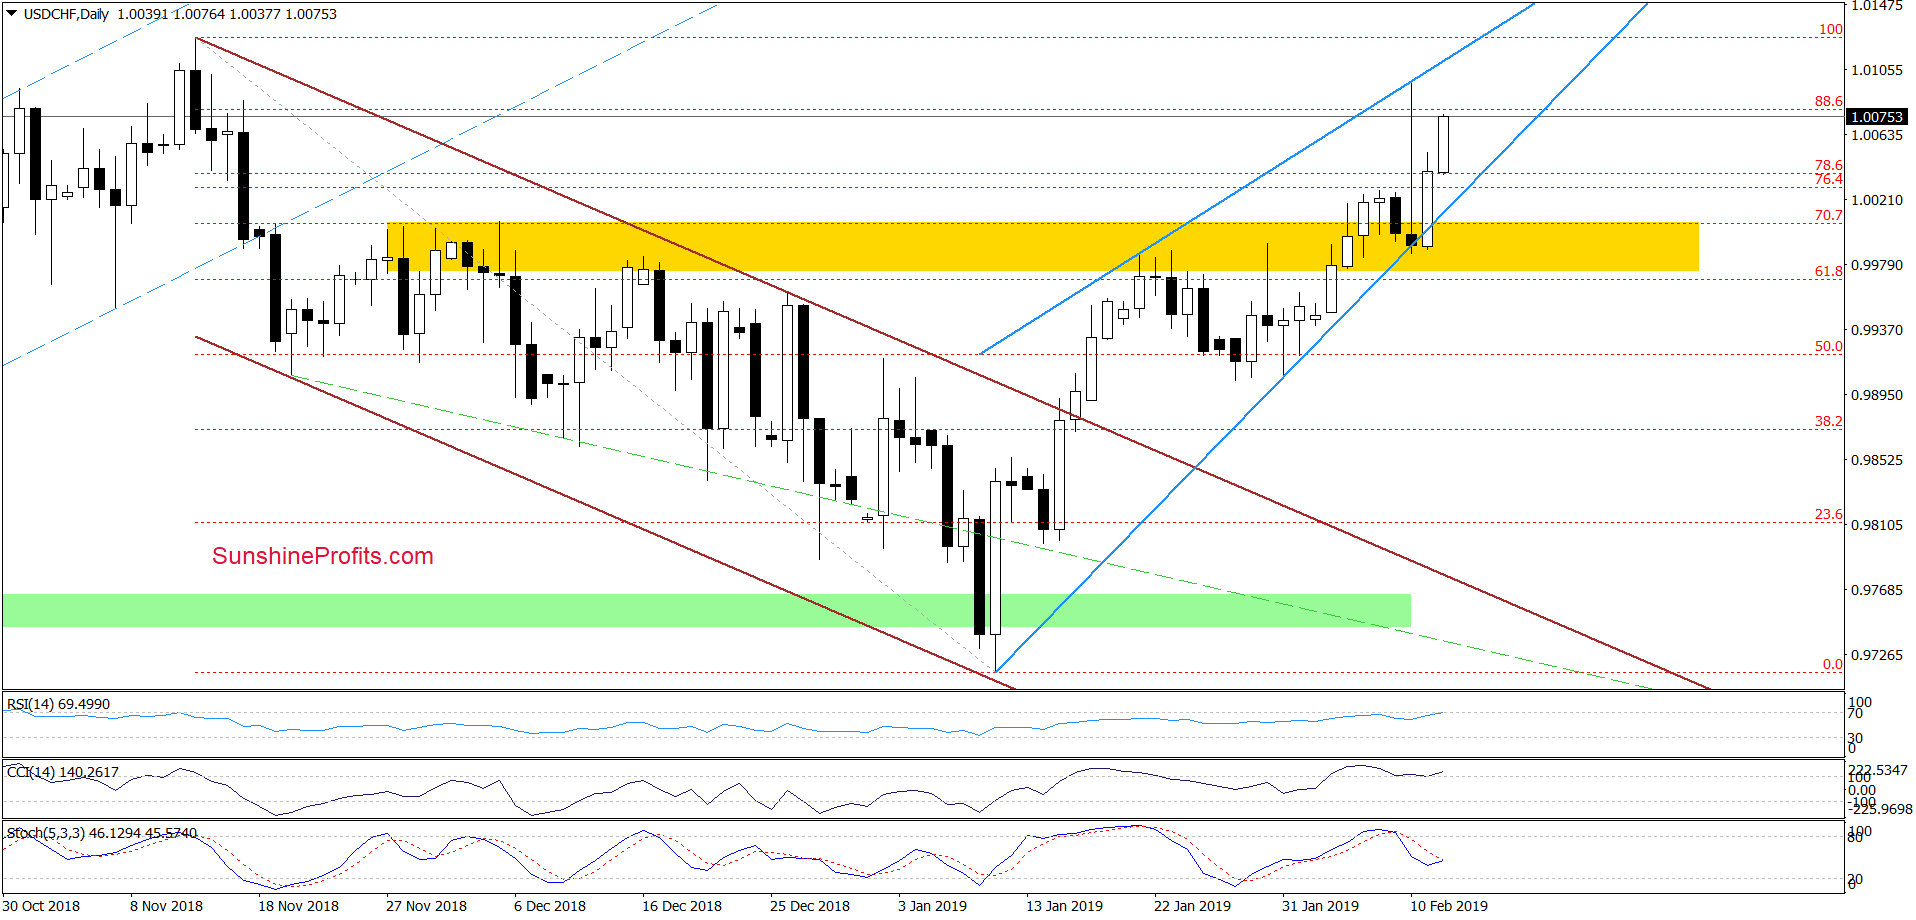
On the daily chart, we see that although currency bears pushed USD/CHF below the lower border of the blue rising wedge, this tiny breakdown was quickly invalidated. A sharp move to the upside followed.
Earlier today, the exchange rate extended gains, which suggests a possible test of the upper border of the rising wedge formation in the very near future. Inspecting the current position of the RSI and the CCI, it seems that the space for gains may be limited and reversal in the following days should not surprise us. If we see any signs of the bulls’ weakness, we’d consider opening short positions.
If you enjoyed the above analysis and would like to receive free follow-ups, we encourage you to sign up for our daily newsletter – it’s free and if you don’t like it, you can unsubscribe with just 2 clicks. If you sign up today, you’ll also get 7 days of free access to our premium daily Oil Trading Alerts as well as Gold & Silver Trading Alerts. Sign up now!.
Thank you.
Nadia Simmons
Forex & Oil Trading Strategist
Sunshine Profits - Effective Investments through Diligence and Care


