
This essay is based on the Premium Update posted on August 20th, 2010. Visit our archives for more gold articles.
This week we have sent out several messages to our Subscribers regarding the current market situation. Now, the markets have calmed down for the weekend, and we are able to provide you with a report summarizing precious metals performance over the whole week, and - to some extent - provide you with our thoughts regarding gold's next move.
Specifically, we will comment on the link between gold and the U.S. Dollar, and in the following part of the essay, we will also comment on the price of gold directly.
We will start with the long-term USD Index chart (charts courtesy by http://stockcharts.com.)
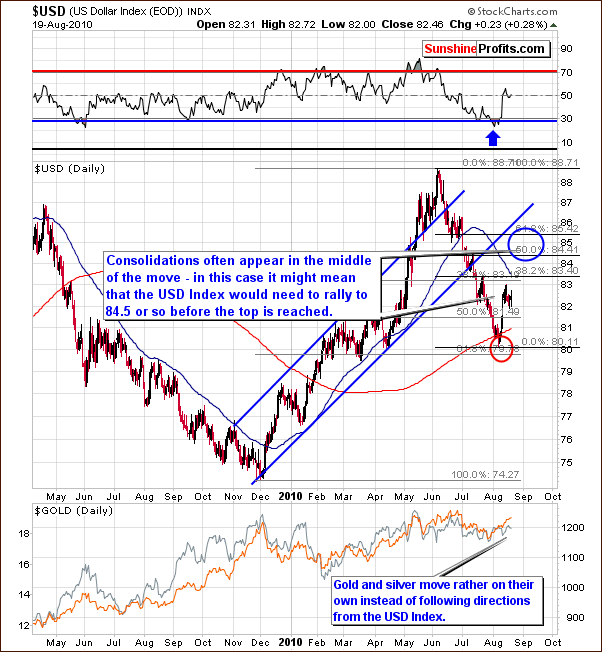
In this week's long-term USD Index chart, we see some consolidation after last week's small rally (reflection of the current consolidation in the Euro Index). Since these consolidations often take place in the middle of the move, we might expect the recent rally to take the dollar higher to 84.5 or so. Similar examples can be seen - in a bigger way - in the recent December to June prolonged rally.
The rally itself lasted for nearly seven months and it included one big consolidation - from Feb to April 2010, which was right in the middle of the move.
Again, it is likely that the USD Index will move higher very soon. The probable downtrend for the euro, which we discussed previously, is an important contributing factor to the dollar's likely near-term direction. By comparing the current rally with that seen earlier in 2010, a target for the top of this USD Index rally seems to fall in the 84-85 range. The main determining factor here is the assumption that this current consolidation period is somewhat near the mid-point of the rally. It is important to note that the term mid-point refers to index levels which may or may not correspond to mid-points in time.
Precious metals have, for the most part, been moving on their own lately. It is possible, however, that their turning points could coincide with those of the USD Index.
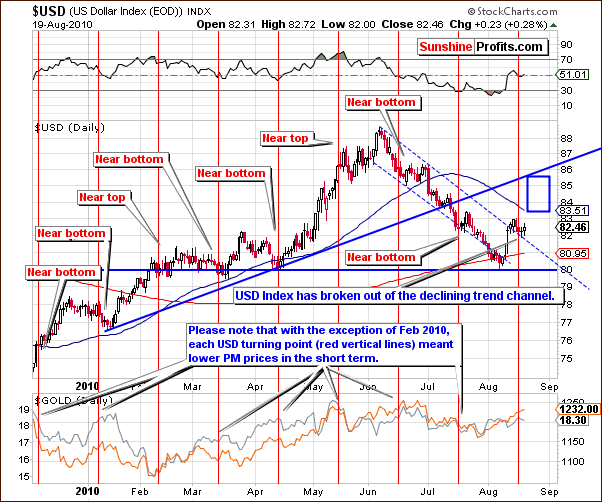
In this week's short-term chart, there are two developments worthy of note. First, the break above the declining trend channel has been verified this week. We have seen several consecutives closings above this level, which was surpassed last week. It is likely that the dollar will rally from here.
The second observation clearly seen in this chart is the vertical red line which indicates a likely turning point to the upside for the USD Index. A close inspection of recent turning points reveals that in seven out of the last eight, gold and silver declined either immediately thereafter or in the next few days. Since we are in this position today, it is something which cannot be overlooked in our precious metals analysis and a decline in gold, silver and mining stocks therefore appears quite likely for the near-term.
The likely short-term trend for the Euro Index appears to be down. As is normally the case, this is bullish news for the USD Index and a rally may very well be seen here soon. Gold, silver, and mining stocks will likely see lower prices in the close future. Speaking of gold, let's check how did the yellow metal perform in the previous weeks.
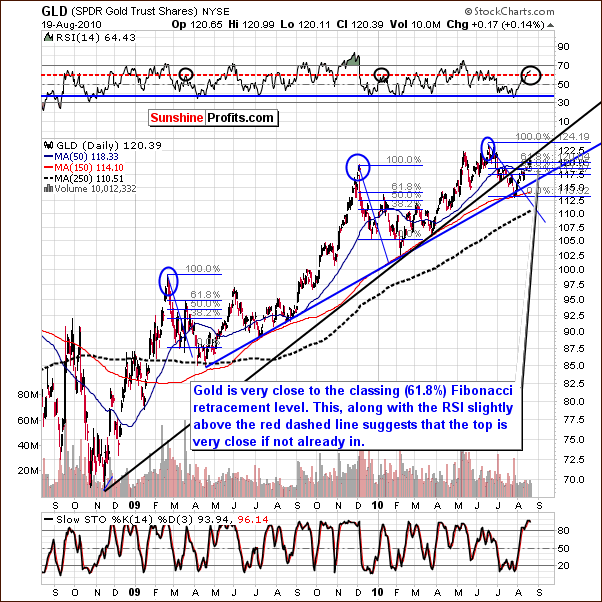
The long-term chart for gold this week provides some evidence in support of a soon-to-be-seen local top. The RSI has risen to levels which often marked previous local tops. The GLD SPDR level is presently only slightly above the 61.8% Fibonacci retracement level, and the long-term resistance line (rising thick black line) is being touched right now.
The situation is quite similar from the non-USD point of view.
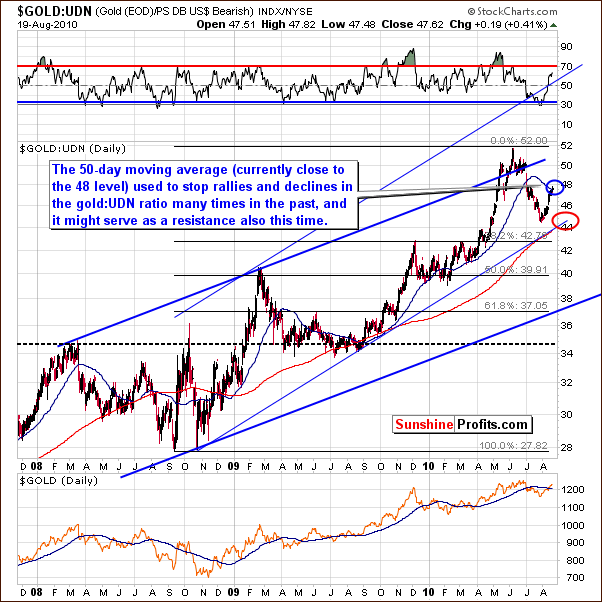
From a non-USD perspective (valuable for instance to Investors/Traders watching gold priced in the euro, sterling, or rupee), it also seems that gold is approaching a local top as is gold in USD. The 50-day moving average seems to be a resistance level. This average has provided strong support or resistance on many past occasions, so we shouldn't ignore it here.
Keep in mind that gold in non-USD currencies will likely trend similar to USD gold markets, that is local tops may very well coincide.
Before summarizing, we would like to comment on one of the questions that we've received this week (thank you for your feedback, we really appreciate it).
The question came from an Investor, who purchased shares of a silver producing company in order to profit from a speculative trade that was supposed to take only a few days (this was a bet on good earnings report). The company didn't do well, and this Investor finally end up with about 1/3 portfolio allocated in this company's shares. The question is what to do given the current market environment. Our reply is that if it was our money on the table, we would close the position right away, not only because of the possibility of a correction from here. We would do that mainly because the factor that made us open this position in the first place is no longer valid and because we would not open such a position if we didn't own any shares - at least it would not be this big.
If - at any point - you are not sure if you should hold on to a position that you currently have (and there are low transaction costs), all you need to do is ask yourself a different question - would you open this position at current market price in the amount that it currently equals to in your portfolio. If the answer is no, then you have just told yourself to close the position.
Summing up, it is likely that the local top for gold is in or very close to being in. Bearish indicators are in place for the near-term and if the expected downturn does not begin immediately, we expect it will be seen very soon. Much of the doubt present today will be erased once the downturn is confirmed. Additional information, detailed price/time targets and explanations are available to our Subscribers along with the in-depth description of a new way to analyze the gold market.
To make sure that you are notified once the new features are implemented, and get immediate access to my free thoughts on the market, including information not available publicly, I urge you to sign up for my free e-mail list. Sign up today and you'll also get free, 7-day access to the Premium Sections on my website, including valuable tools and charts dedicated to serious PM Investors and Speculators. It's free and you may unsubscribe at any time.
Thank you for reading. Have a great weekend and profitable week!
P. Radomski
--
Was that the top or is the rally going to take us further? While the previous messages provided you with trading signals and brief explanation, this week's Premium Update supplements this information with many detailed charts that thoroughly illustrate points made earlier this week. Even though it might sound so, it's not the biggest news this week.
The biggest news is that while analyzing market's this week, we have developed a new way to analyze the gold market that involves the ratio that we've never used before. In this week's report we have described the login behind it, commented on the possible ways that it can be effectively utilized. Of course - we also applied it also to the current market situation and found very interesting signals.
Additionally, we've answered several question from our Subscribers: Is gold currently a better investment than silver? What should one do with a speculative trade that turned to a long-term investment? What about the situation in Iran? Is hedging one's position justified at this point? - and more.
We encourage you to Subscribe to the Premium Service today and read the full version of this week's analysis right away.
