
Based on the March 1st, 2011 Premium Update. Visit our archives for more gold articles.
High volatility seen in commodities market in the past week attributes toward ongoing social and economical developments in the Middle East. There are ominous reports of thousands of people killed in Tripoli as anti-government protests reached the Libyan capital for the first time. The Libyan government attacked protesters, and rebels claimed control of the second-biggest city, Benghazi. Tens of thousands of Bahraini protesters marched in the capital demanding democracy.
Commodity markets react to the changed outlook for the region and the global economy. Higher commodity prices will be seen along with greater risk aversion in the equity and credit markets. The latest rumors on attacking oil pipelines induce massive speculations in energy commodity markets. These, coupled with the currency market uncertainties impact current gold and silver market sentiment.
At this juncture of commodities markets react to the social and economic disturbances heavily, lets have some talk on the relationship between general stock market and precious metals. Backed by the strong historical correlation between silver and stock market, forecasts in stock market would be a gauge to measure the strength in silver moves. Lets start this weeks technical part with the analysis of the S&P 500 Index (charts courtesy by http://stockcharts.com.)
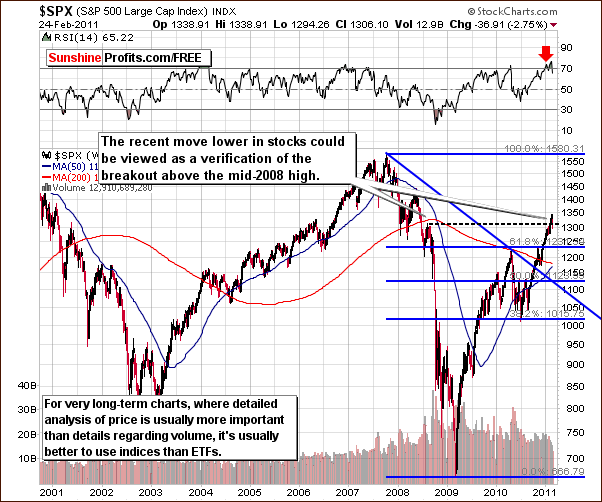
On the above chart we see some volatility; however it is important to note that the downturn has not moved to levels below the mid-2008 highs. It seems at this point to be nothing more than a form of verification of the breakout above these highs.
The RSI is not severely overbought any longer. Its still relatively high compared to its historical average, but its definitely not above the 70 level. This is one of the positive results of the recent slight decline and a few more days of sideways price action could cause further reduction in the RSI. This could be a gathering of strength for a subsequent rally.
Overall,the situation in the general stock market still appears bullish even though some declines have been seen last week. It is quite probable that we have simply seen a slight correction a verification of the breakout above the mid-2008 highs.
Amid the short-term volatile stock market fluctuations, lets have a look into inter- as well as intra market correlation exhibited by precious metals in the recent past.
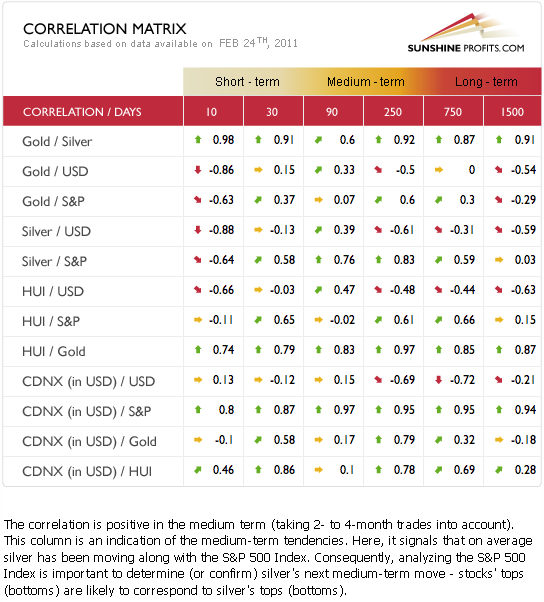
The implications continue to show stocks moving more or less in tune with silver. Note the high correlation coefficients in the medium-term columns. The general stock market is still above mid-2008 highs and this is bullish for silver and thus also indirectly for the rest of the precious metals sector.
Mining stocks have moved above their mid-2008 highs and are verifying this breakout. The same situation also applies to the white metal. No other significant correlations of the US dollar or stocks are seen here in the short run. Both gold and silver have been highly negatively correlated with the dollar but only in the 10-day column. This is simply a situation to watch at this point, not to draw significant conclusions based on that column.
Lets leave silver for a few seconds and have a look at the ratio between the price of gold and corporate bonds. This will allow us to keep the proper perspective.
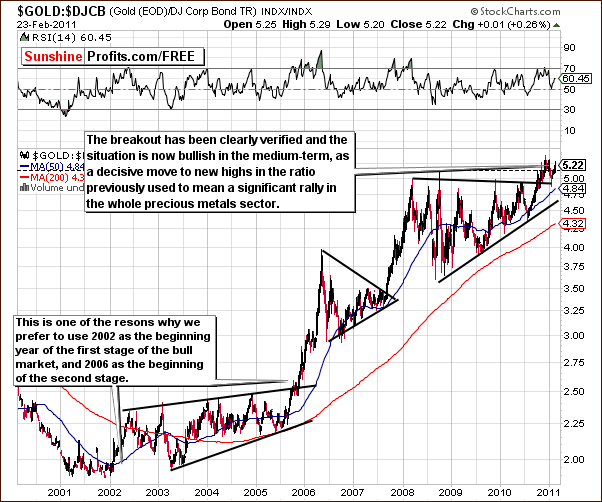
The recent breakout has been verified and the rally continues. Notice that the Gold: Corporate Bonds ratio moved sharply higher after reaching a local bottom a few weeks ago. It now appears about ready to take out its previous highs and it seems this is likely to happen soon. If so, a significant upswing throughout the precious metals sector is likely to follow - just like it was the case in 2005/6 and 2007/8.
Although there is always a possibility that such a trend could be invalidated, it seems more likely that the ratio will continue to move upwards. For this reason, we believe the medium-term outlook for gold, silver and mining stocks is bullish at this time. So, now lets take a look at the very long-term chart for gold
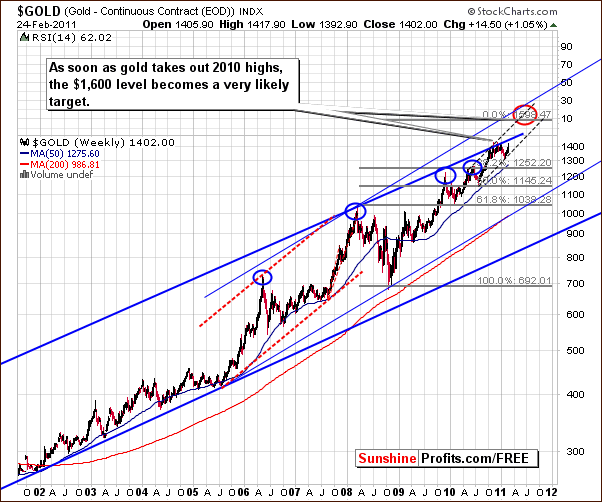
On the above chart we clearly see that the price of gold is once again moving close to the rising resistance line (upper border of the very long-term trading channel). Several months ago, the upper border of the rising trend channel was approached but not broken.
In the October 1st, 2010 Premium Update, we wrote the following:
Before the lower, less steep line is surpassed, it is likely that gold will first reach a local top and then go through a quick consolidation. This will most likely result in a greater strength and increase the odds of a further rally being sustained.
Since that time gold moved considerably lower and bounced. This action is clearly visible from the very long-term perspective, so the gold market appears ready to move above the aforementioned resistance level. The higher light blue line will then likely become the next resistance level. It seems that this is the most probable outcome going forward and target level of $1,600 or higher would then be valid.
Before summarizing, lets take a look at the recent developments in gold stocks.
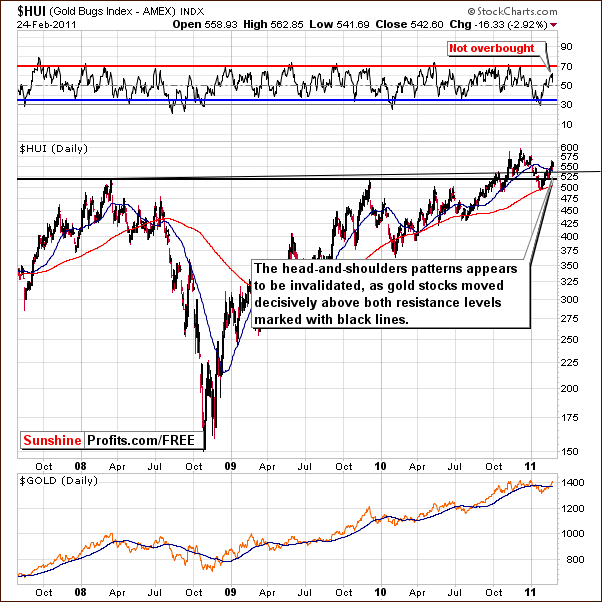
In the HUI Index (HUI index indicates a portfolio of 14 major un-hedged gold mining companies), chart we see the index level is above both resistance levels marked with black lines and the breakout is in the process of being verified. The head-and-shoulders pattern which was under development last week has nearly been invalidated. This would of course be a bullish development.
It is our opinion that the breakout will likely be verified and it is therefore probable that the head-and-shoulders pattern will not be completed.
Summing up, the general stock market is verifying a breakout above previous highs and the same situation is also seen for silver. We mentioned the possibility of small consolidation periods in the precious metals markets our recent commentary, so seeing this now leads to us to refrain from any serious bearish sentiment. Conversely, the situation remains bullish.
To make sure that you are notified once the new features are implemented, and get immediate access to my free thoughts on the market, including information not available publicly, we urge you to sign up for our free e-mail list. Sign up for our gold & silver mailing list today and you'll also get free, 7-day access to the Premium Sections on my website, including valuable tools and charts dedicated to serious PM Investors and Speculators. It's free and you may unsubscribe at any time.
Thank you for reading. Have a great weekend and profitable week!
P. Radomski
--
Its only two months into the New Year and already we have had several attempted revolutions in the Middle East with two successful and another on the brink. All this has major ramifications for the price of oil, precious metals and currencies as we have seen in this weeks market action.
The USD Index declined, but at this point the implications for precious metals Investors are not really important. The opposite is the case with the general stock market and the current volatile action, as the way things play out here, could heavily impact silver, and thus also other parts of the precious metals sector. That's why we explain this situation in detail by featuring S&P 500 Index, Dow Jones Transportation Average (note the huge volume in the latter), and the financial sector.
Gold, silver and mining stocks moved sharply lower recently, but what really changed? In addition to providing you with our assessment of this week's price action (also from the non-USD perspective), we discuss mining stocks performance relative to other stocks, and price of gold from the Australian perspective.
We encourage you to Subscribe to the Premium Service today and read the full version of this week's analysis right away.
