
This essay is based on the Premium Update posted on February 11st, 2011. Visit our archives for more gold articles.
Inflation vs. market fluctuations is always a hot topic in precious metal markets. Inflation is good for gold, which has a long history of acting as a hedge against it. With rising inflation it is likely that there will be a corresponding rise in the price of precious metals; that brings us to the question, how do you value gold? It is evident that there is no scientific method for valuing gold since its a non-earning asset. Perhaps we should value gold by 1/n, where n is investor confidence in paper currencies. But how do you measure n? Lets have a look into the history.
In Babylonian times it was said that an ounce of gold bought some 350 loaves of bread. According to our source known as The Bread Lady in Miami, the average price of a loaf of bread in the U.S. is about $1.70, which suggests a fair price for gold of about $595. But hold on! We are not sure this comparison is valid. The Babylonians had organic whole wheat bread, which would cost a lot more today than $1.70, more like $5.00 per loaf, which would make the price of gold $1,750.
Another rule-of-thumb says an ounce of gold could purchase a decent mens toga in Roman times and a gentlemans suit today. The quality of tailoring is not spelled out but you can certainly get a good quality suit for over $1,300.
Since 1900, an ounce of gold on average (which means that during declines in precious metals silver declined more, and during upswings silver rallied more and the ratio was more favorable to silver investors than 50 to 1) could purchase 50 times its weight in silver. After last years run-up of silver, this ratio has fallen to 47 times. The price of gold in terms of oil has also been fairly constant. Since 1900, an ounce of gold has purchased on average 13.4 barrels of oil. Today, the same ounce buys 15.5 barrels.
These are the historical explanations for gold valuation. However in the recent past, interest in analyzing influence of currencies and bonds on gold prices has increased substantially. One of our Subscribers recently asked if the current breakout in the yield spread between short-term and long-term bonds is meaningful to precious metals investors. He further asked if it changes anything from the fundamental perspective, for instance that inflation was no longer a threat to the economy.
Our comment here is that long-term fundamentals are driven by the fundamental situations of the markets themselves not the short-term technical signs. These are used to time the market not analyze the economy. The economy is analyzed by economic indicators, major trends, demographics, industry analysis and other analyses which is more of a top-down approach. Prices reflect not only fundamental but also emotional factors, and thats why technical analysis is so useful while timing the market.
However, it cannot by itself change the fundamental outlook. Once we see a breakout, we cannot automatically infer that it was because of a change in fundamentals it could have been caused by emotional factors, or it could have been just an accident. Printing presses around the world are hot from printing money and the inflation remains a long-term threat.
Lets begin this week's technical part of our analysis by taking a look at the chart featuring aforementioned yield spread between short-term and long-term bonds (charts courtesy by http://stockcharts.com).
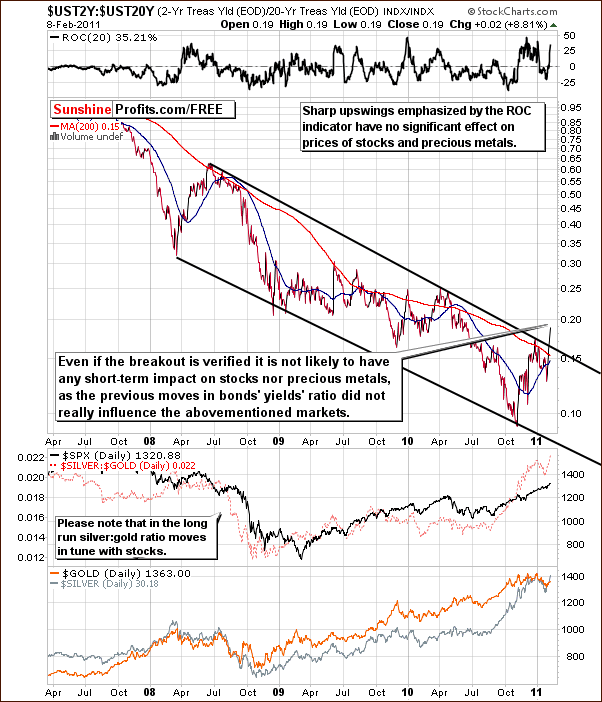
We took a lot of time to thoroughly review the chart above and even analyzed it from the perspective of the rate-of-change indicator for the bond yield spreads. No important implications were uncovered for stock, nor Precious Metals Investors.
There were times when such a quick rally meant a local bottom for metals; there were times when it meant a local top, and times when it meant absolutely nothing. Consequently, seeing such event doesnt provide us with much information. Overall, we infer that the analysis of the yield spreads does not appear to be a useful analytical tool for the Precious Metals Investors as far as timing is concerned.
However, there are other markets that have had - at times - key influence as far as timing is concerned. One of these markets is the currency market and the USD-EUR pair. Lets start true technical discussion with the current influence of Euro USD indices on gold moves.
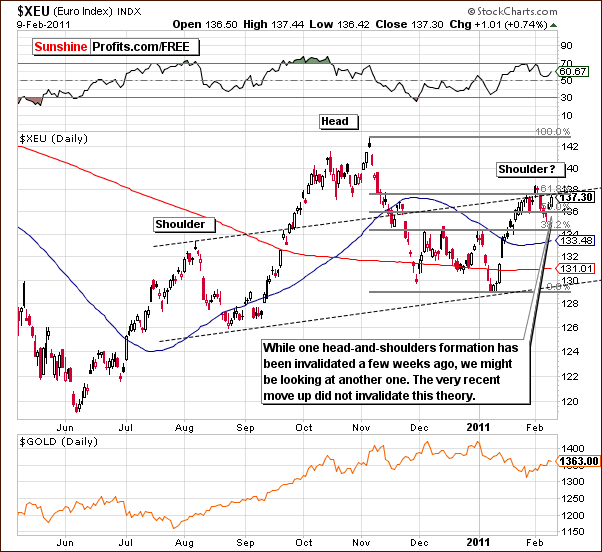
In the short-term Euro Index chart this week we see sideways movement and there remains a bearish outlook. A small increase in index levels that weve seen this week should not be viewed as bullish, in fact, it resulted in the right shoulder of the bearish head-and- shoulders pattern being formed. These implications will naturally result in a bullish sentiment for the USD Index as seen on the next chart.
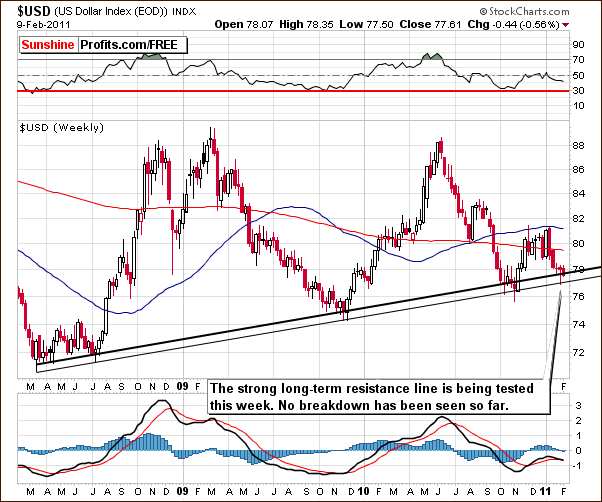
In the long-term USD Index chart this week we can see that index levels have barely moved since last weeks update. We have, however, seen a small decline which appears to be verifying the upper support line and is therefore not a bearish indicator. No breakdown has been seen. At this point the bottom appears to be in and the trend appears bullish. Based on the strong correlation between gold and USD in recent weeks, short-term suggestion is a definite buy for gold.
Next, lets see what would bonds proffer at this juncture - however not in terms of spread between yields, but as a ratio - bonds relative to gold prices. The ratio between the price of gold and corporate bonds once again provides us some valuable insight into the latest developments. The following chart describes the ratio between gold and Dow Jones Corporate Bond Index.
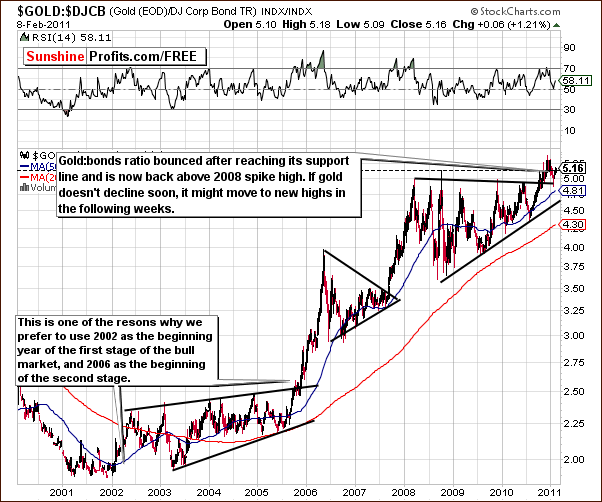
The ratio has recently touched a support line and has now moved higher, actually exceeding the 2008 spike high. This is an important development and from this point the odds slightly favor a continuation of the big rally that we've seen in the second half of 2010.
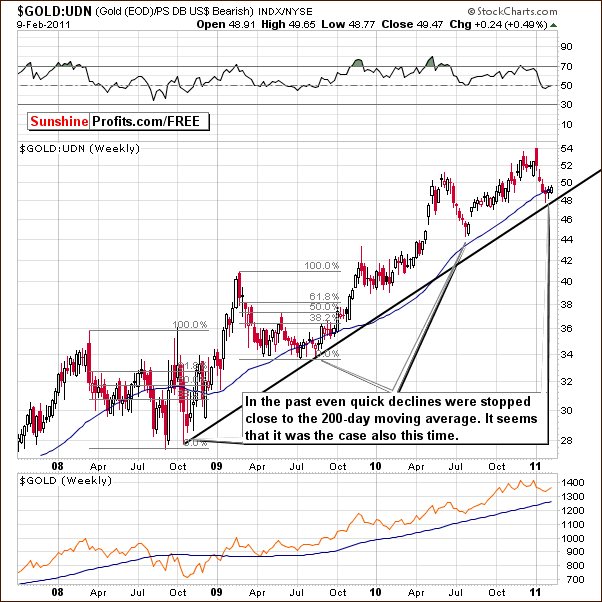
Moreover, from a non-USD perspective, gold has bottomed close to the rising long-term support line and also close to the 50-week moving average. This is a trend, which has been seen fairly often in the past and usually points to a subsequent rally. Most importantly, no evidence of a breakdown has been seen and the outlook for gold from a non-USD perspective is therefore bullish for the short term.
Summing up, once again the outlook is bullish for the USD Index and slightly bearish for the Euro Index. Since precious metals have been trending with the dollar in recent weeks, the implications for gold, silver and mining stocks are also short-term bullish. Gold:bonds ratio also suggests that the previous rally might continue. Of course there's more to the golden story this week, but we will leave that part of our analysis to our Subscribers.
To make sure that you are notified once the new features are implemented, and get immediate access to my free thoughts on the market, including information not available publicly, I urge you to sign up for my free e-mail list. Sign up today and you'll also get free, 7-day access to the Premium Sections on my website, including valuable tools and charts dedicated to serious PM Investors and Speculators. It's free and you may unsubscribe at any time.
Thank you for reading. Have a great weekend and profitable week!
P. Radomski
--
Next week well find out if the Big Guns are still investing in gold when the U.S. Securities and Exchange Commission will release information on their stakes on Feb. 14. Also, we ran into two bright MIT economists who have found a new way to measure inflation ahead of the governments Consumer Price Index.
Today's Premium Update features 24 charts including 6 gold charts (one of them illustrates a breakdown), 4 silver charts and 2 charts dedicated to the gold:silver ratio (what does high volume in the ratio mean?). We also covered the recent breakout in the yield spread between short- and long-term bonds, and seasonal patterns for gold in February. Additionally, we've analyzed the current situation on the palladium market.
The general stock market appears to have a significant impact on the situation in precious metals, especially silver - today we provide details on what to look for as an indication that silver will indeed rally or plunge from here.
We encourage you to Subscribe to the Premium Service today and read the full version of this week's analysis right away.
