
This essay is based on the Premium Update posted on June 27th, 2009. Visit our archives for more gold & silver articles.
I am often asked at this time whether it is a good idea to be in the precious metals market during the summer period known as the Summer Doldrums, in which demand for gold dries up temporarily while farmers in India plant crops and wait for the Monsoon rains. When they harvest in the early September, demand for gold picks up again as they are anxious to convert their profits into gold. After looking at the seasonal effects on gold one might think it prudent to wait through the summer in hopes of entering the market at lower prices. However, after considering important fundamental factors such as the increase in the money supply, it is clear that it is not a good idea to wait until summer's end to enter a market that rather sooner than later is heading higher. Naturally, there will be pullbacks along the way, but the potential cost of being completely out of the market is too steep.
The technical side of the market helps us estimate the most probable direction and range of the next move. This week we begin with gold. (charts courtesy of http://stockcharts.com)
Gold
In the June 6th Premium Update I included a chart for my subscribers that featured non-USD gold. Several weeks have passed since then and I believe an update on this topic will be helpful, especially for those who cover their living expenses in currencies other than the dollar.
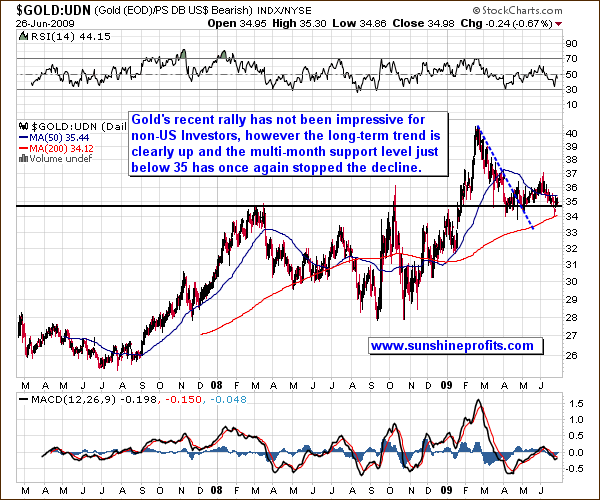
This chart features the gold to the UDN ratio. The latter is the symbol for PowerShares DB US Dollar Index Bearish Fund, which moves in the exact opposite direction of the USD Index. Since the USD Index is a weighted average of the dollar's currency exchange rates with world's most important currencies, we may use the gold:UDN ratio to estimate the value of gold prices in "other currencies".
The June downleg in the precious metals is visible also in other currencies, but the price reversed very quickly once it briefly broke below the multi-month support level (ratio below 35) and touched its 200-day moving average. The very temporary breakdown and rapid comeback above the support level is a bullish development.
This means that the buying pressure was very strong indicating potent demand that will prevent gold from going much lower right now. Additionally, since the breakout above the previous highs (corresponds to the abovementioned 35 level) has been verified twice and took several months, it seems that we are now ready to advance further. (In the USD the price of gold did not break though its previous highs earlier this year.)
We need to zoom in to see more details.
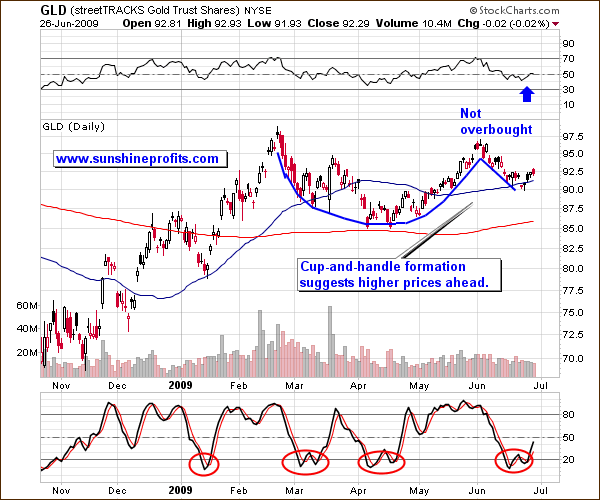
Using the GLD ETF as a proxy, medium-term gold looks bullish. The local bottom that I predicted in past updates has materialized, and both visible indicators (Relative Strenght Index and the Stochastic Indicator) suggest higher prices are likely. The Stochastic Indicator has put in a bottom and the RSI is at levels that do not suggest a plunge. Therefore, anyone holding gold right now should sleep rather well.
The cup-and-handle formation, to which I referred several times in the past , seems to be completed, and the handle, which formed during June, is now clearly visible. Ideally, I would like to see the volume shaped similarly to the way price shaped during the mid-Feb to June time frame, as this would perfectly confirm this bullish formation. But this is not the case. The volume was much higher in the middle of the February top than it was at the beginning of June.
Still, the lowest values of volume were in the mid-April during the bottoming process, and the volume declined during the "handle" phase, so I decided to include this formation in my analysis. Volume is not ideally confirming this bullish formation, but it is also not invalidating it
Summing up, gold is likely to take a small pause here, which will also correspond to the summer doldrums, but based on the current charts, it seems that this move will be insignificant, so I do not plan to trade it for myself.
Silver
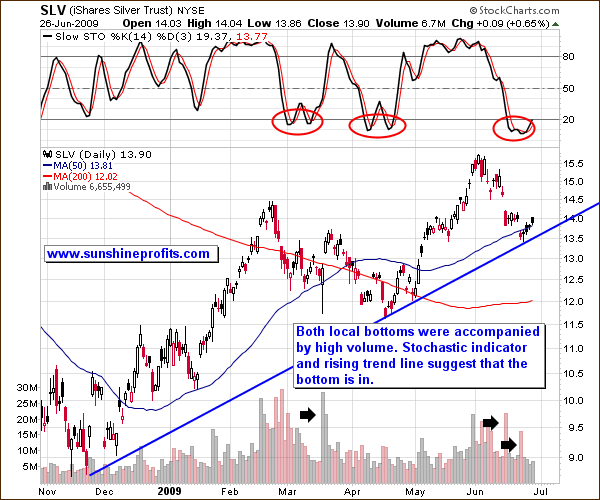
The silver market appears to have bottomed as well. We saw the pattern in the Stochastic indicator, which is usually visible during bottoms, and we touched the support level on high volume. The silver chart confirms the points raised earlier - the most probable direction for price to go is up.
Correlations
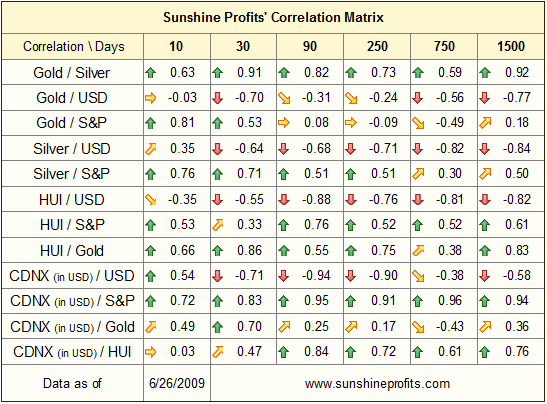
As I indicated a week earlier, the correlation between USD Index and the precious metals market has weakened recently and for the past few weeks they have been trading somewhat independently from each other. Since I first wrote about it, the correlation has become even weaker. Although that is a short period of time on which to base any conclusions, it might tell us that uncertainty about the short-term outcome in the USD market does not automatically need to translate into uncertainty in the gold market.
The precious metals sector is still in a favorably technical and fundamental situation and it does not "require" the dollar to plunge in order to move higher.
Summary
Summing up, the historical tendencies favoring the summer doldrum scenario may not play out this year, as many significant developments, such as the tremendous increase in the money supply, suggest higher prices ahead. The traditional negative correlation between the dollar and precious metals has become barely visible in the past two weeks, but that does not seem to matter much, as gold, silver, and mining stocks are likely to rise even without significant influence from the USD Index. Still, we may experience a pause in rise of gold prices.
To make sure that you get immediate access to my thoughts on the market, including information not available publicly, I urge you to sign up for my free e-mail list. Sign up today and you'll also get free, 7-day access to the Premium Sections on my website, including valuable tools and charts dedicated to serious PM Investors and Speculators. It's free and you may unsubscribe at any time.
P. Radomski
--
This week the traditional negative correlation between the dollar and precious metals continues to weaken, but this time it is not necessarily bearish for gold, silver, and mining stocks. In addition to explaining this phenomenon, I comment on the seasonal patterns that this week may be of little less importance than usually.
In the previous commentary I stated that there is a possibility that we would have a double bottom (GLD), and this is what we have just seen. Are the prices likely to move sharply higher, or will we soon experience another buying opportunity? In this week's free commentary I deal with this key question, however the most important details are available to the Premium Service Members only.
