
Based on the November 26th, 2013 Oil Investment Update
In our commentary from Nov. 14, you could read about the connection between oil stocks and the general stock market. Back then, we wrote the following:
(…) we clearly see that the XOI and the S&P 500 have moved roughly in the same direction in the recent years (…) a strong positive correlation remains in place also on a short-term basis.
Since that essay was published, both indices have moved higher and hit fresh annual highs. They have also broken above their psychological barriers - 1,500 in case of the oil stock index and 1,800 in case of the S&P500. Taking this fact into account, we‘ve decided to examine the relationship between the general stock market and crude oil to check if it confirms or invalidates the conclusions of the analysis of the oil-stocks-to-oil ratio.
Let‘s begin with the long-term chart (charts courtesy by http://stockcharts.com).
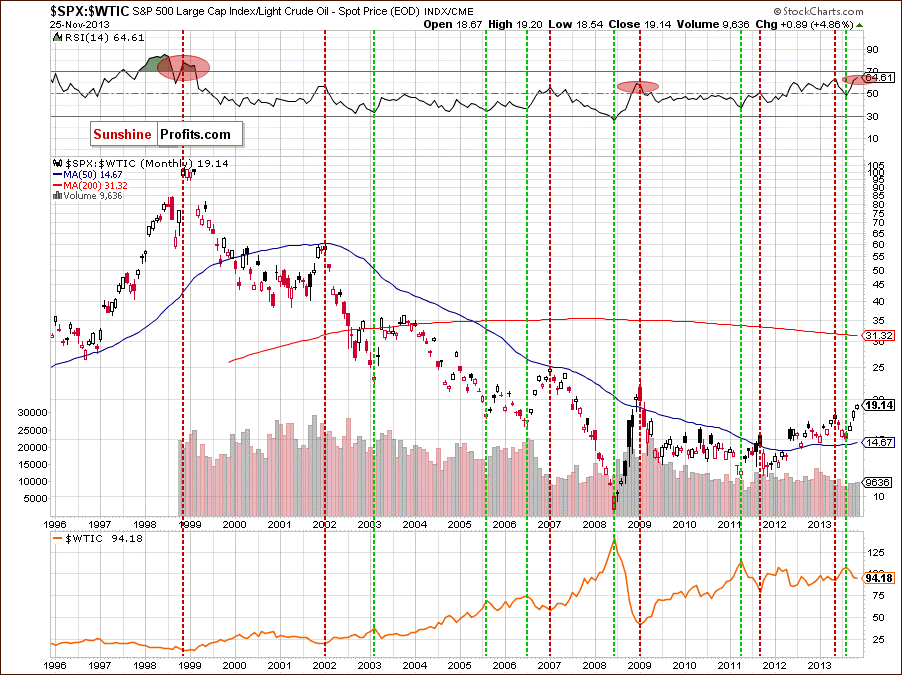
Similarly to what we saw in the case of the oil-stocks-to-oil ratio, the first thing that catches the eye on the above chart is a strong negative correlation between the ratio and the price of light crude. When we go back to 1999, we clearly see that the annual low in crude oil was preceded by the ratio’s 1999 high. We could see this strong relationship also in 2009, when the annual low in crude oil corresponded to the ratio’s 2009 high (marked with a red ellipse). In the following months, the ratio declined heavily, which led to higher oil prices.
Just like in the oil-stocks-to-oil ratio, the stocks-to-oil ratio’s 2011 high was in tune with the bottom of the corrective move that we saw in crude oil. We noticed similar price action also in May 2013. In both cases, declines in the ratio triggered increses in light crude. What’s interesting, the ratio’s lows corresponded to crude oil highs (marked with the green lines). We saw such situations in 2003, 2005, 2008, 2011 and also in 2013.
Looking at the above chart, we see that the RSI has reached its highest level since 1999. Although it is not overbought, we can notice that lower readings on the indicator triggered downswings in the ratio, which resulted in higher prices of light crude.
Taking the above into account, if history repeats itself once again and the ratio declines, we will likely see improvement in crude oil.
Now, let’s zoom in our picture and examine the weekly chart.
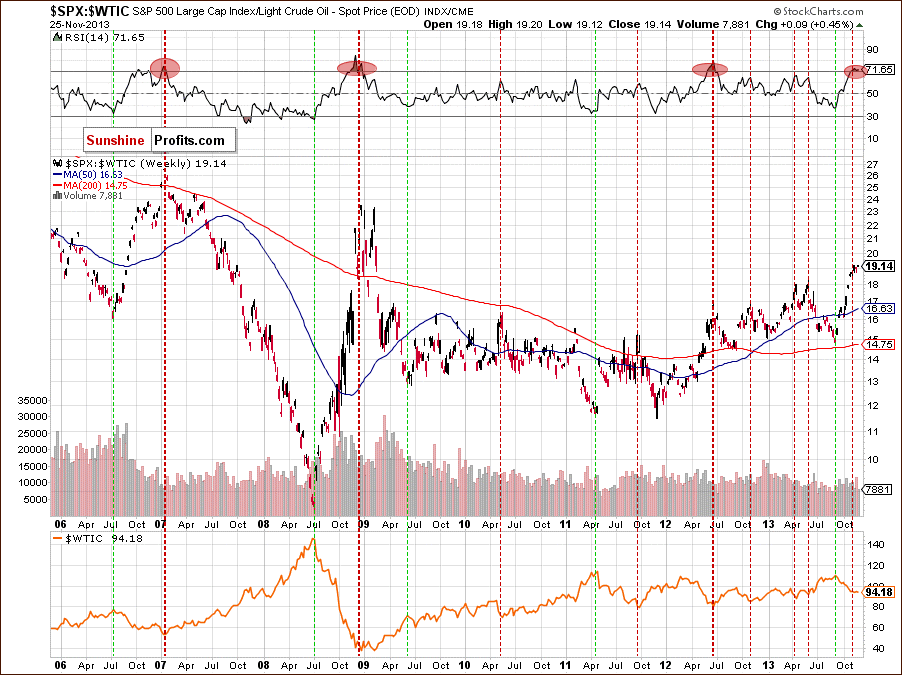
Looking at the above chart, we see the same price action - most of the ratio’s tops have corresponded to the crude oil’s lows. In this case, the ratio’s lows didn’t indicate crude oil’s lows precisely. However, major lows in 2008, 2009, 2011 and 2013 were in tune with major light crude’s tops.
When we take a closer look at the position of the RSI, we clearly see that the indicator has moved above the 70 level. We saw such situations in 2007, 2008 and again in 2012. Back then, such high readings on the RSI preceded moves down in the ratio and up in crude oil. If history repeats itself once again, we may see a move higher in crude oil in the near future.
Now, let’s check the short-term outlook.
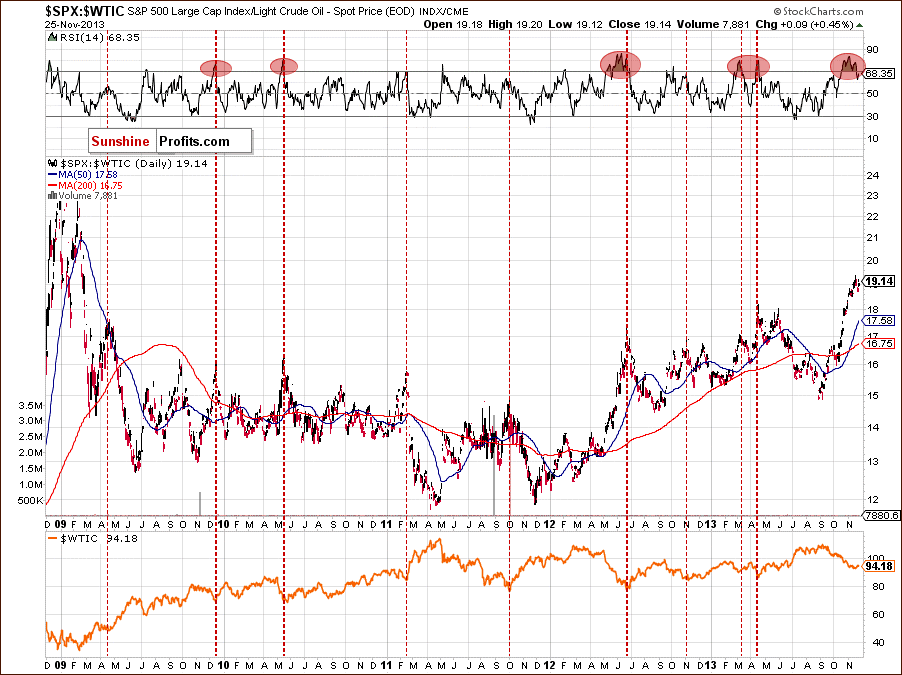
On the above chart, we see that the ratio has rallied since September, which is in perfect tune with declines in crude oil. At the beginning of the previous week, the ratio moved higher once again and hit a new 2013 high. Despite this increase, we didn’t notice a new high in case of the RSI. When we take a closer look at the above chart, we clearly see a negative divergence between the ratio and the position of the indicator.
At this point, it’s worth mentioning that there were similar situations in the past – for example in June 2012 and March 2013. Back then, such divergences preceded declines in the ratio and had a positive impact on crude oil.
Please note that lower readings on the RSI in May and August triggered downswings in the ratio and pushed the price of light crude higher. Taking the above facts into account, we can assume that a bigger pullback in crude oil is just around the corner.
Summing up, looking at the situation in the ratio we clearly see that the stocks-to-oil ratio confirms the conclusions of the analysis of the oil-stocks-to-oil ratio. Similarly to what we saw earlier, the stocks-to-oil ratio is also oversold (not only on a short-term basis, but also from the medium-term perspective) as indicated by the RSI. Therefore, we may see further deterioration in the ratio in the near future, which will likely trigger an upswing in light crude.
Thank you.
Nadia Simmons
Sunshine Profits' Crude Oil Expert
Oil Investment Updates
Oil Trading Alerts
