

The French Revolution of 1849 gave us this saying: the more things change, the more they stay the same. Let's look at its usefulness for current situation in gold. In Friday's Alert, we wrote that the turn of the month and the corresponding reversal is most likely to be a topping action, instead of a bottom and that the next meaningful bottom is going to take place at a later date. Gold rallied, and so did the mining stocks. The volume was huge, so the question is if the upswing really ran out of steam on Friday? Gold just moved to new highs in early pre-market trading, so...
So, it could be following the regular huge-volume pattern and top today. Let's take a look at the chart for more details.
Seemingly Bullish Gold Rally
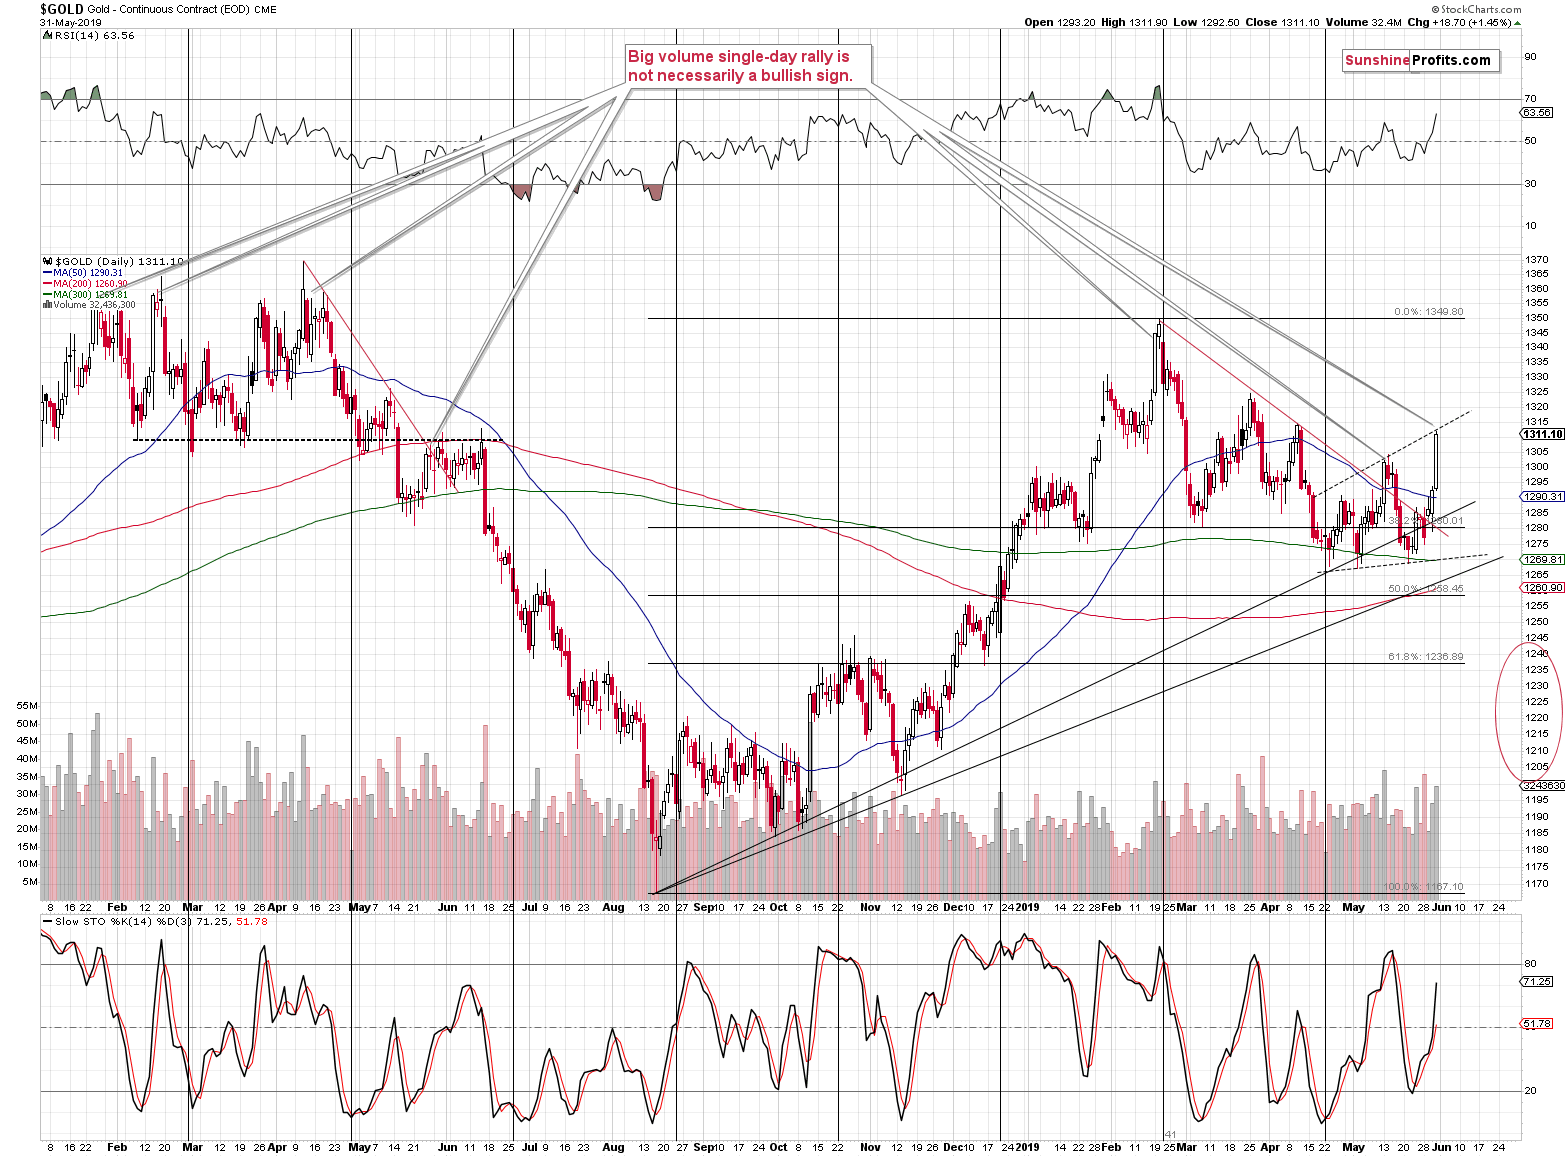
The yellow metal moved higher and closed the day visibly above the $1,300 level, and at the moment of writing these words, gold's continuous futures (that's what the above chart represents) is trading at $1,319, which is more or less the March high. The latter means that a resistance was just reached.
While the move above $1,300 was sharp and took place on big volume, the question is whether it will result in further gains. Not necessarily. The geopolitical news tends to trigger only brief rallies in gold, especially if they are based on news or announcements that are likely to be reversed (just like the tariff threats regarding Mexico that are unlikely to be really imposed - and if so they are likely to be cancelled relatively quickly).
Price moves are usually confirmed within the next 2 days after the breakout or breakdown, so today's and tomorrow's closing prices will be important. Will gold invalidate yesterday's rally by that time?
It seems quite likely and even if it doesn't manage to do that by that time, it's likely to head south within a week or two anyway. That's particularly likely because the big-volume daily rallies were quite often seen at the final part of the rally and right before the turnaround. In fact, all major tops of 2018 and 2019 formed in this way. At times, there was one or two more (smaller) daily rally / rallies thereafter and at times, the slide followed right away but the overall tendency remained intact. Big-volume rallies in gold that we see after a calmer rally is not something as bullish as the technical-analysis-101 books would have one believe. Gold market reacts in its own way and what was saw yesterday looks like an indication of a top - either right away or (which is more likely given today's pre-market upswing) shortly.
Let's keep in mind that these are only the short-term factors pointing to lower prices. There are also multiple medium-term bearish confirmations that we are not discussing today, but that we have discussed in the previous days and weeks.
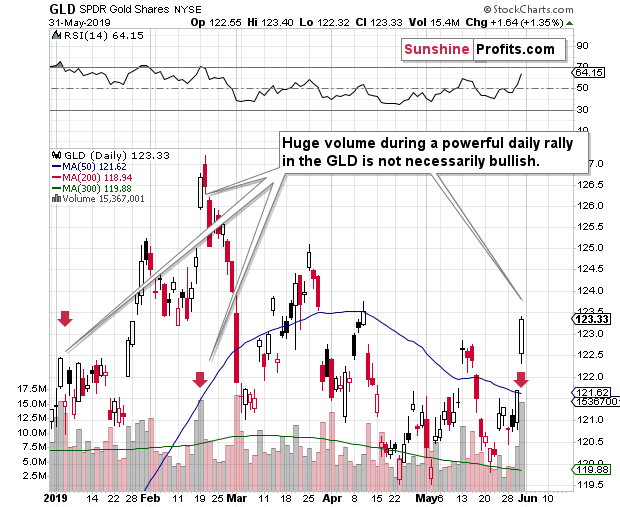
The GLD ETF shows that the volume moved sharply higher on Friday, but - just like what we wrote about gold - this is not necessarily a bullish sign. Theoretically, big daily rallies on huge volume should be a sign of strength. So far this year we saw two very similar cases. One at the beginning of January, and the second in mid-February. In the former case, we saw about 3 weeks of consolidation and in the second case it was the 2019 top in terms of the closing prices. There was just one day after this daily rally when we saw higher prices, but that was the case only on an intraday basis and it seems that unless one engaged in day trading, it was impossible to take advantage of this small move. The ETF closed below the previous days price.
All Calm on the Silver Front
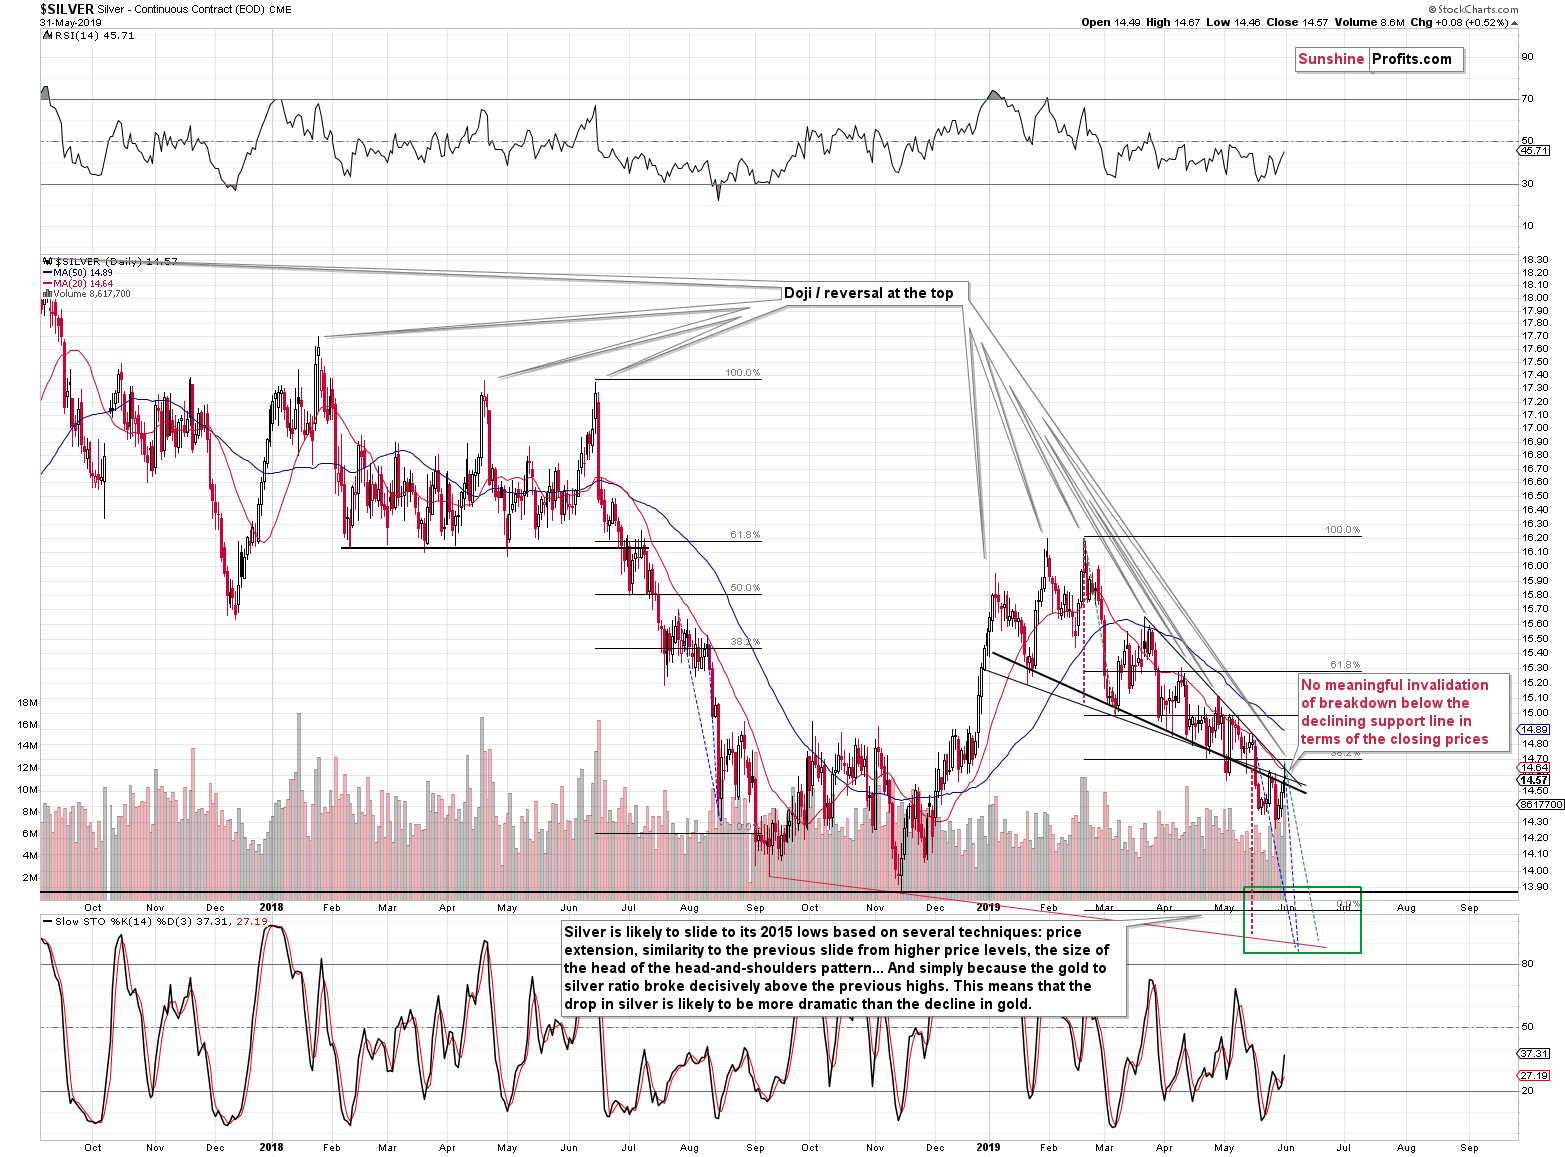
Silver hasn't done much. It moved higher, but ultimately closed less than 10 cents higher - nothing to call home about. Silver is much more of an industrial metal and the decline in the US-Mexico trade could decrease the demand for all industrial metals - that's why silver's reaction was likely limited. This means that once this news gets cancelled or it becomes obvious that nothing like that is going to happen, silver is likely to give away their recent gains (just like gold and mining stocks) - but this time the quick decline in silver will likely be smaller. This should not be viewed as a sign that silver's underperformance ended - it will be a normal reaction given the string of recent news.
Technically, silver remains below the key medium-term resistance lines in terms of the closing prices and the outlook remains clearly bearish for the white metal. The recent breakout in the gold to silver ratio continues to have important implications for silver's performance, just like we had outlined.
Having said that, let's take a look at the mining stocks. We usually start with the big picture and then zoom in, but today we'll analyze this market starting from the details as that's where the real action appears to be - at least at the first sight.
Mining Stocks in the Spotlight
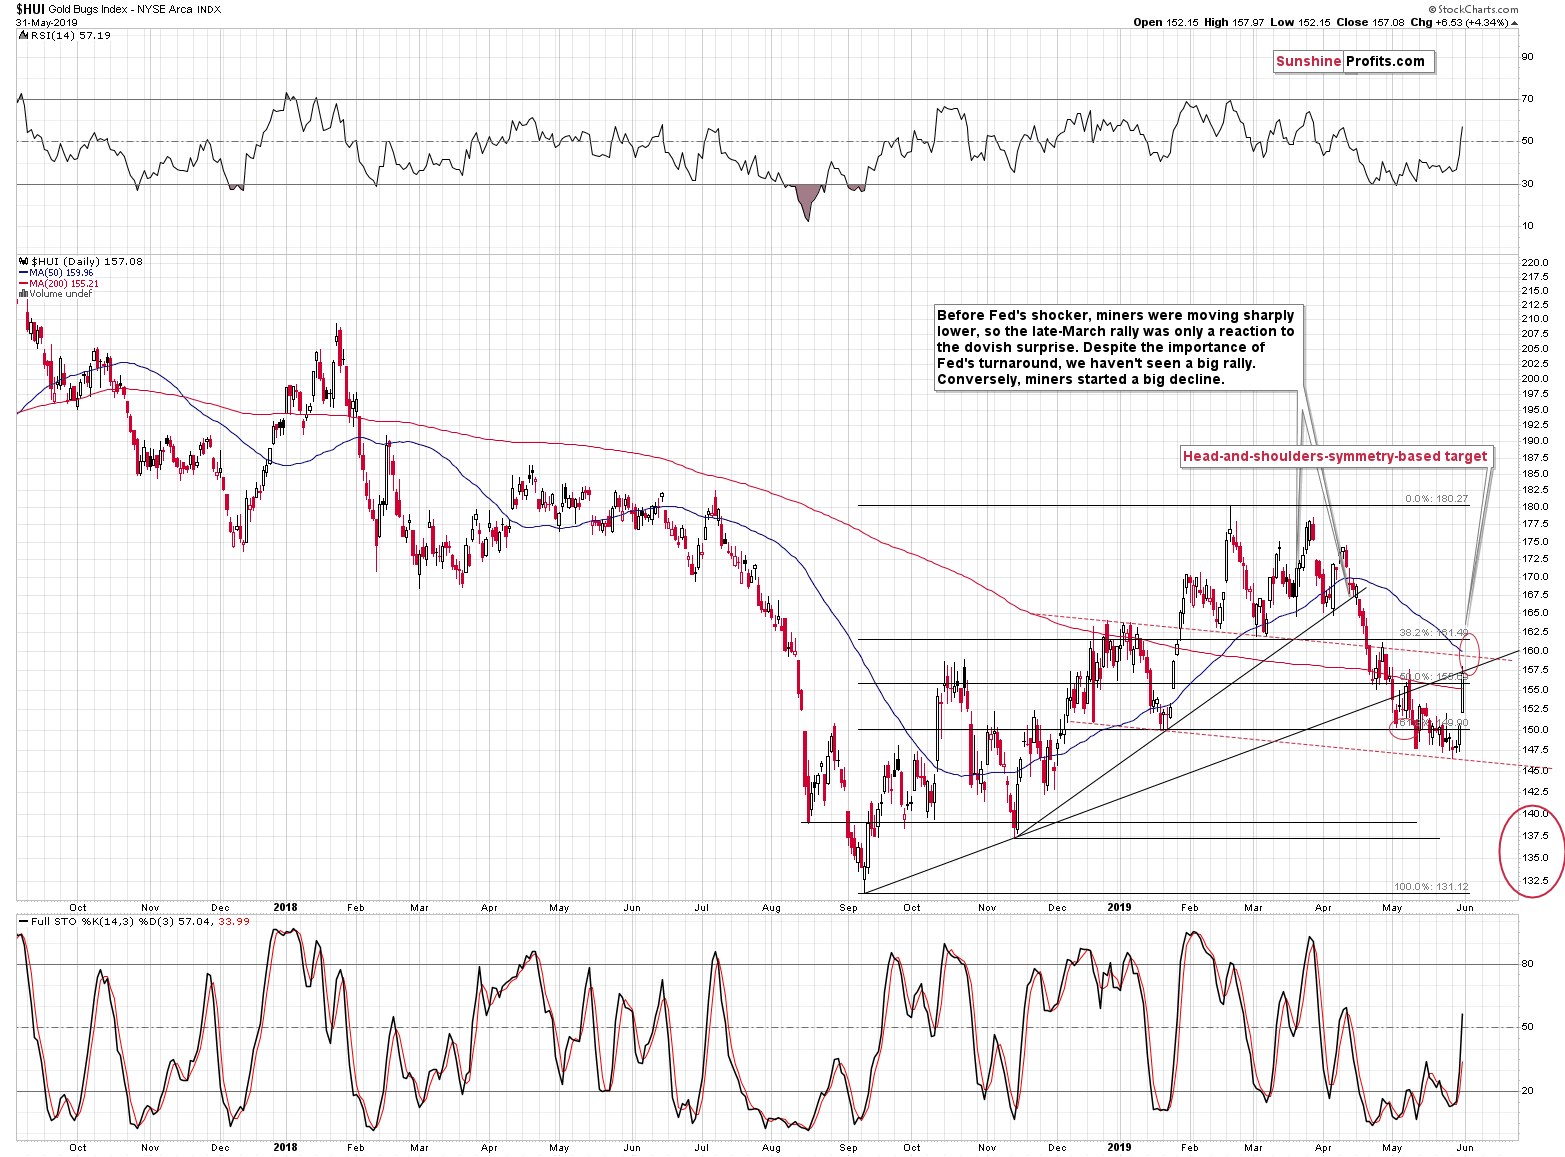
The HUI Index (symbol: ^HUI, but you may also be interested to look at ^HUISH, ^HUINTR, and ^HUITR) - proxy for gold mining stocks - moved sharply higher and reached its early May high. It also moved back to the previously broken rising resistance line based on the September and November 2018 lows. Technically, at this time, it's a verification of the breakdown. But it seems to be more than just that.
The December 2018 and January 2019 rally together formed a specific dome. Then we saw another - bigger - dome based on the late-January - early-May price action. The next dome might be forming right now. These domes - when taken together - would create a huge head-and-shoulders pattern with very bearish implications. These formations tend to be symmetric and the right shoulder should be similar to the left shoulder. The May bottom was lower than the January bottom, so the neck level of the formation is descending. This means that for both shoulders to be very similar, the right shoulder should top close to the line that's parallel to the neck level. Since the latter is declining, the high should be relatively close to - most likely below - the January high. This means a very short-term target of about 159. The nearby resistance levels are the previously broken 38.2% Fibonacci resistance level (161.49), the rising resistance line (it was reached yesterday), and the 50-day moving average (about 160).
This means that even if the HUI Index moves somewhat higher this week, it's unlikely to change the bearish outlook at all. Even a move to the 163 level or so (the January high) would not necessarily be anything bullish, because that would still likely be nothing more than the right shoulder of the head-and-shoulders formation.
Of course, an incomplete H&S pattern has no important implications, but since both shoulders tend to be symmetrical, it does guide our expectations for the next few days. The above-mentioned resistance levels would be important on their own as well, but knowing that they may be a part of the right shoulder makes them even more so.
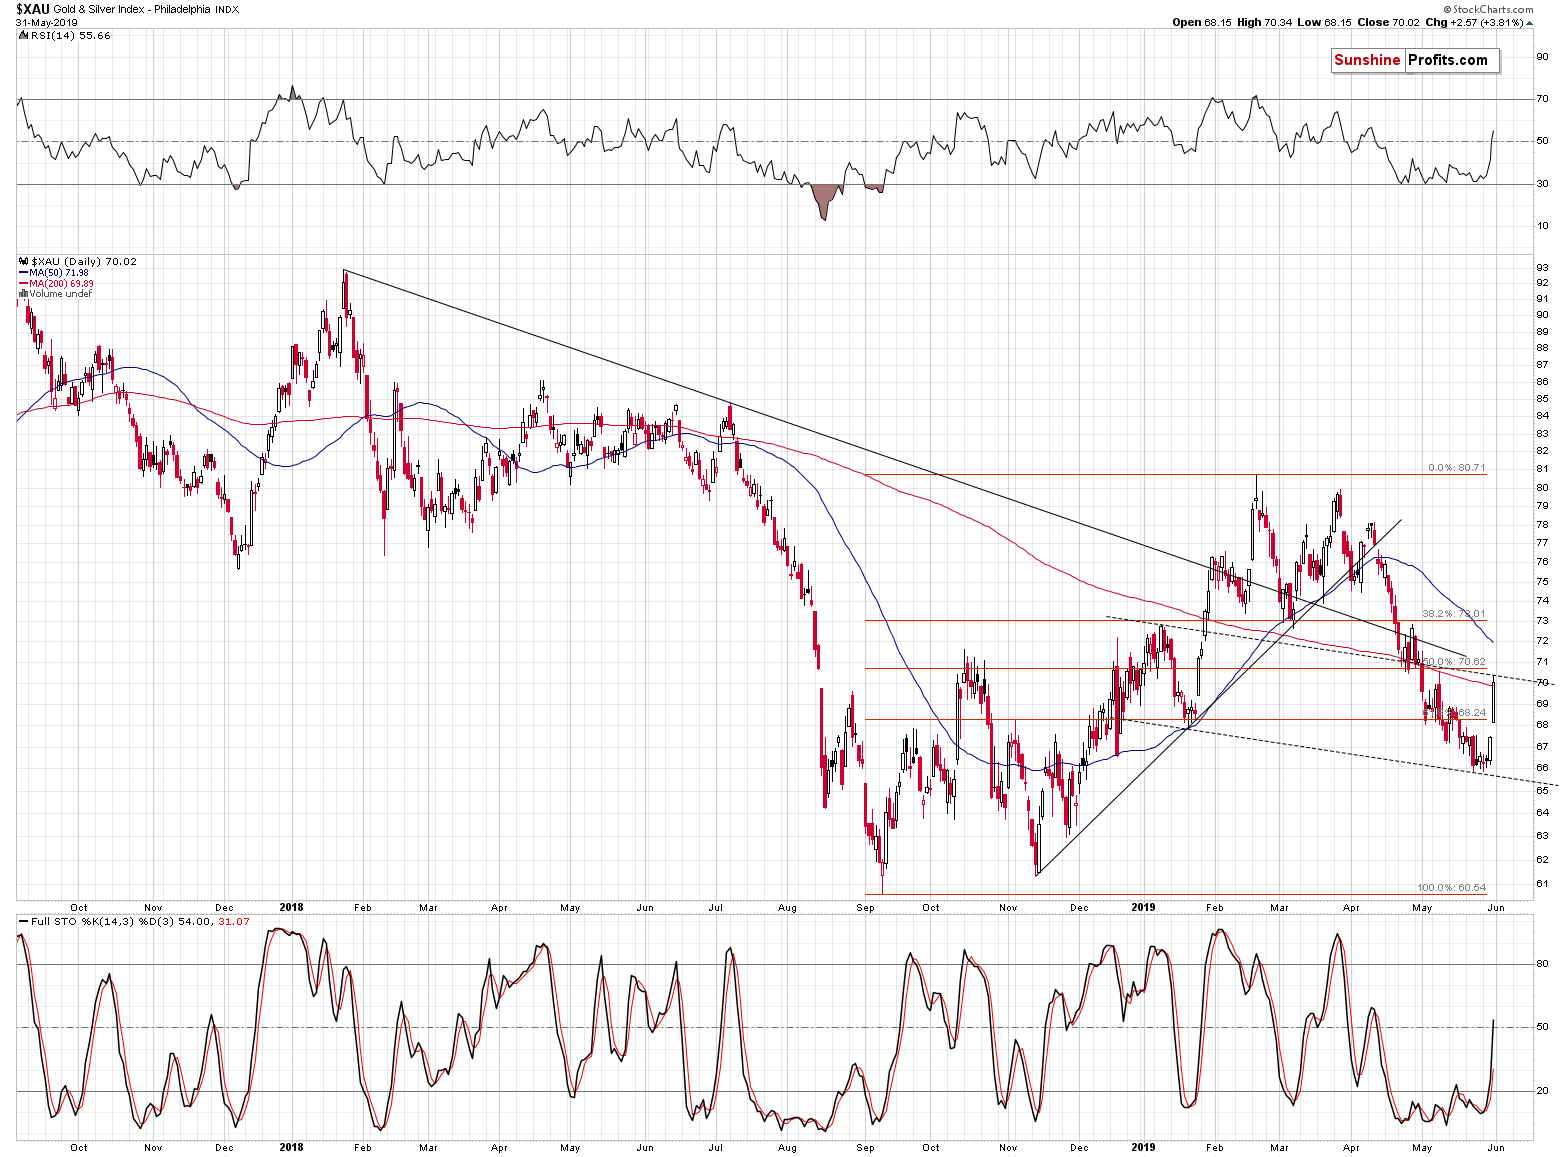
Another proxy for the mining stocks, the XAU Index (symbol: ^XAU), reveals more of the same. The mining stocks moved to the line that's parallel to the neck level of the possible H&S top formation, so the top might already be in. However, even if the XAU rallied to about 73 - to the January high - it would not invalidate the formation just yet.
Gold is up in today's pre-market trading, and unless it reverses shortly, we'll most likely see a move higher in the mining stocks as well, so it's important to keep in mind that even a rally to 73 is not a game changer.
What you might be particularly interested in is the GDX ETF, because that's the proxy for the precious metals market where we can analyze volume. Technically, the volume data is available also for the GDXJ ETF (proxy for junior miners) and for the leveraged products like DUST, NUGT, JDST, and JNUG, but it's usually best to stick to the GDX analysis. Why? Because in case of the GDXJ ETF, the signals are often identical as the one in the GDX (both ETFs are quite similar), and as far as the leveraged gold-related ETFs and ETNs are concerned, it's best to avoid their technical analysis altogether. Their prices move not only on market news, fundamentals, and emotions, but also based on cost factors (time decay plays an important role). Consequently, whatever we could infer from the charts will already be visible in the unleveraged ETFs, and what seems to be a "divergence" will often be nothing more than a cost factor, not a true technical sign with implications for the outlook.
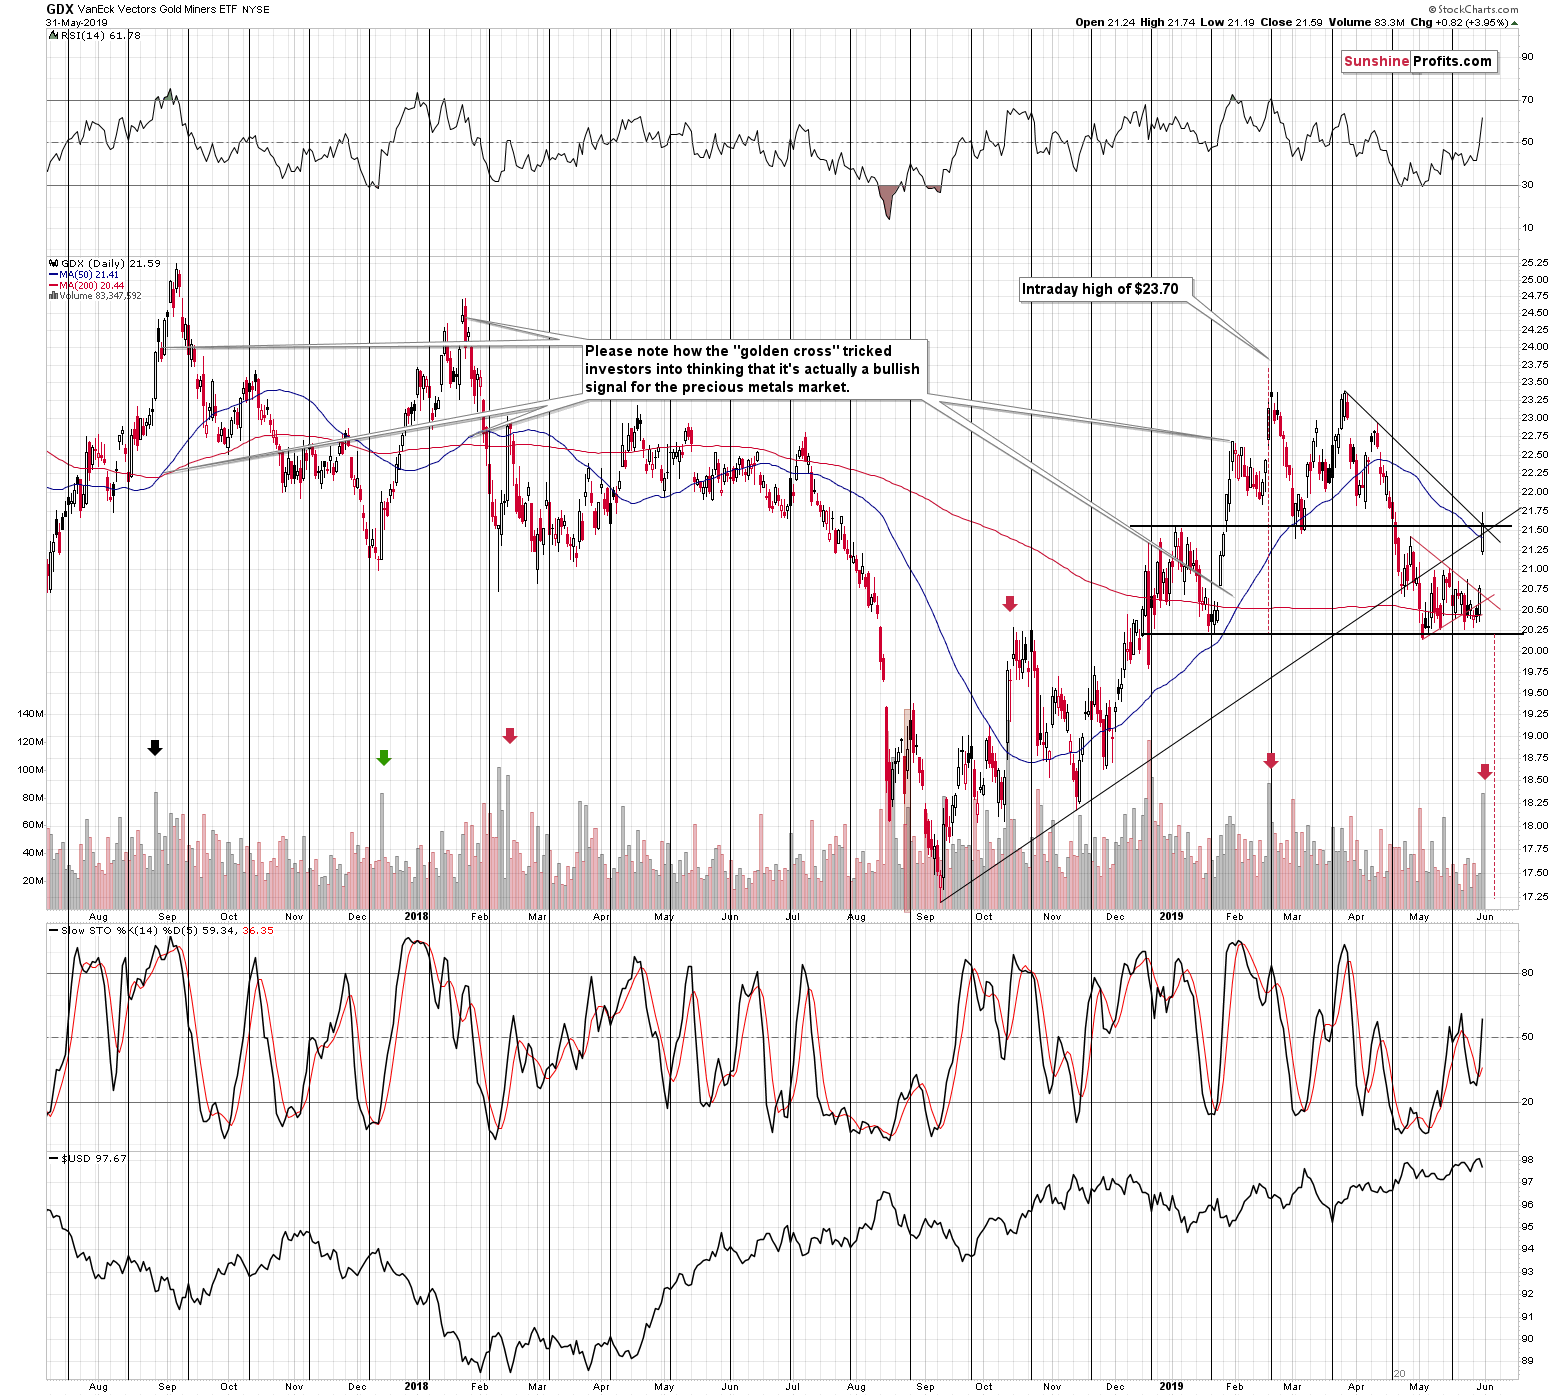
Friday's huge volume spike was the second biggest witnessed this year. What happened when we saw the prior and only similar one? Mining stocks were right before the 2019 top. This confirms the analogy from the gold market - the situation is similar to what we saw in mid-February. That was not a good time to buy gold or mining stocks - it was a great shorting opportunity.
The analogy does not end with this year. Back in mid-October 2018 and February 2018, we saw sharp rallies that were followed by just a little more strength. In fact, it was so small that it was not really giving any chance to profit from the rising prices, but to enter short positions instead.
The February 2018 analogy is quite special because there is one more little-known element that makes both situations similar.
The long-term triangle-vertex-based turning points.
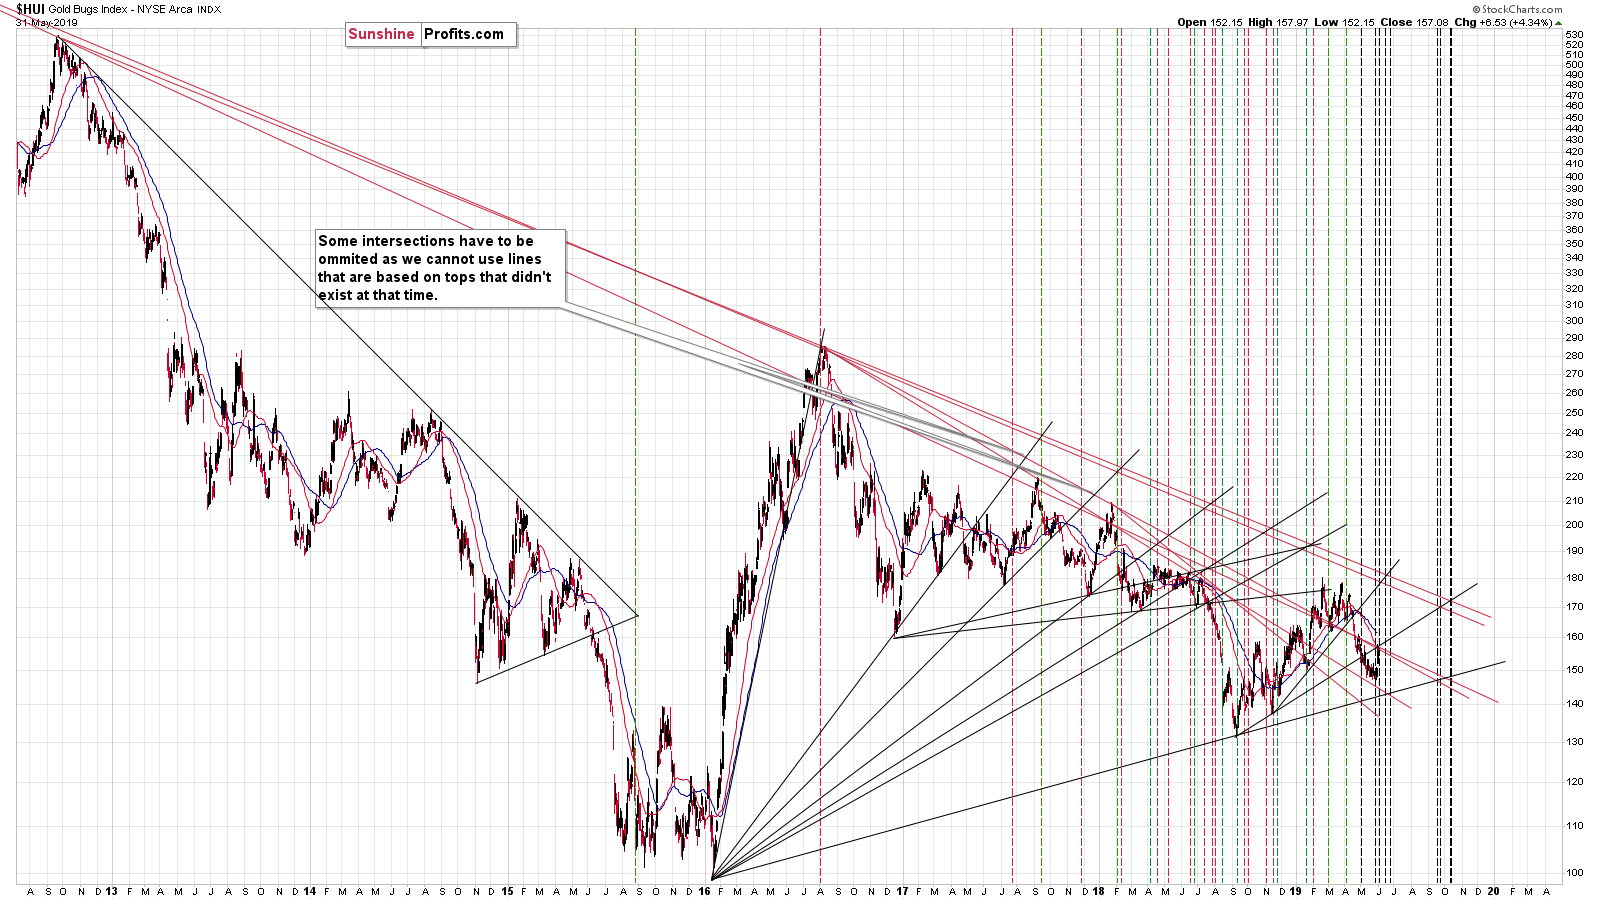
Back in February 2018 the HUI Index soared right at its turning point, but it plunged shortly thereafter - at the very next turning point. As a reminder, when two support/resistance lines cross, it creates a time target for a reversal. Unfortunately, it's not known which kind of reversal will that be, but that usually becomes clear once we get closer to it.
What's so similar to the current situation? There were two very close vertex-based turning points back in February 2018 and we have them right now. Back then, gold stocks rallied sharply initially - and the same thing happened right now. Back then, the rally was invalidated shortly - will this time be different? Keeping in mind the geopolitical nature of the rally, it's doubtful it'll turn out differently.
Finally, let's take a look how does it all fit the big picture and the analogy to what happened in 2012 and 2013.
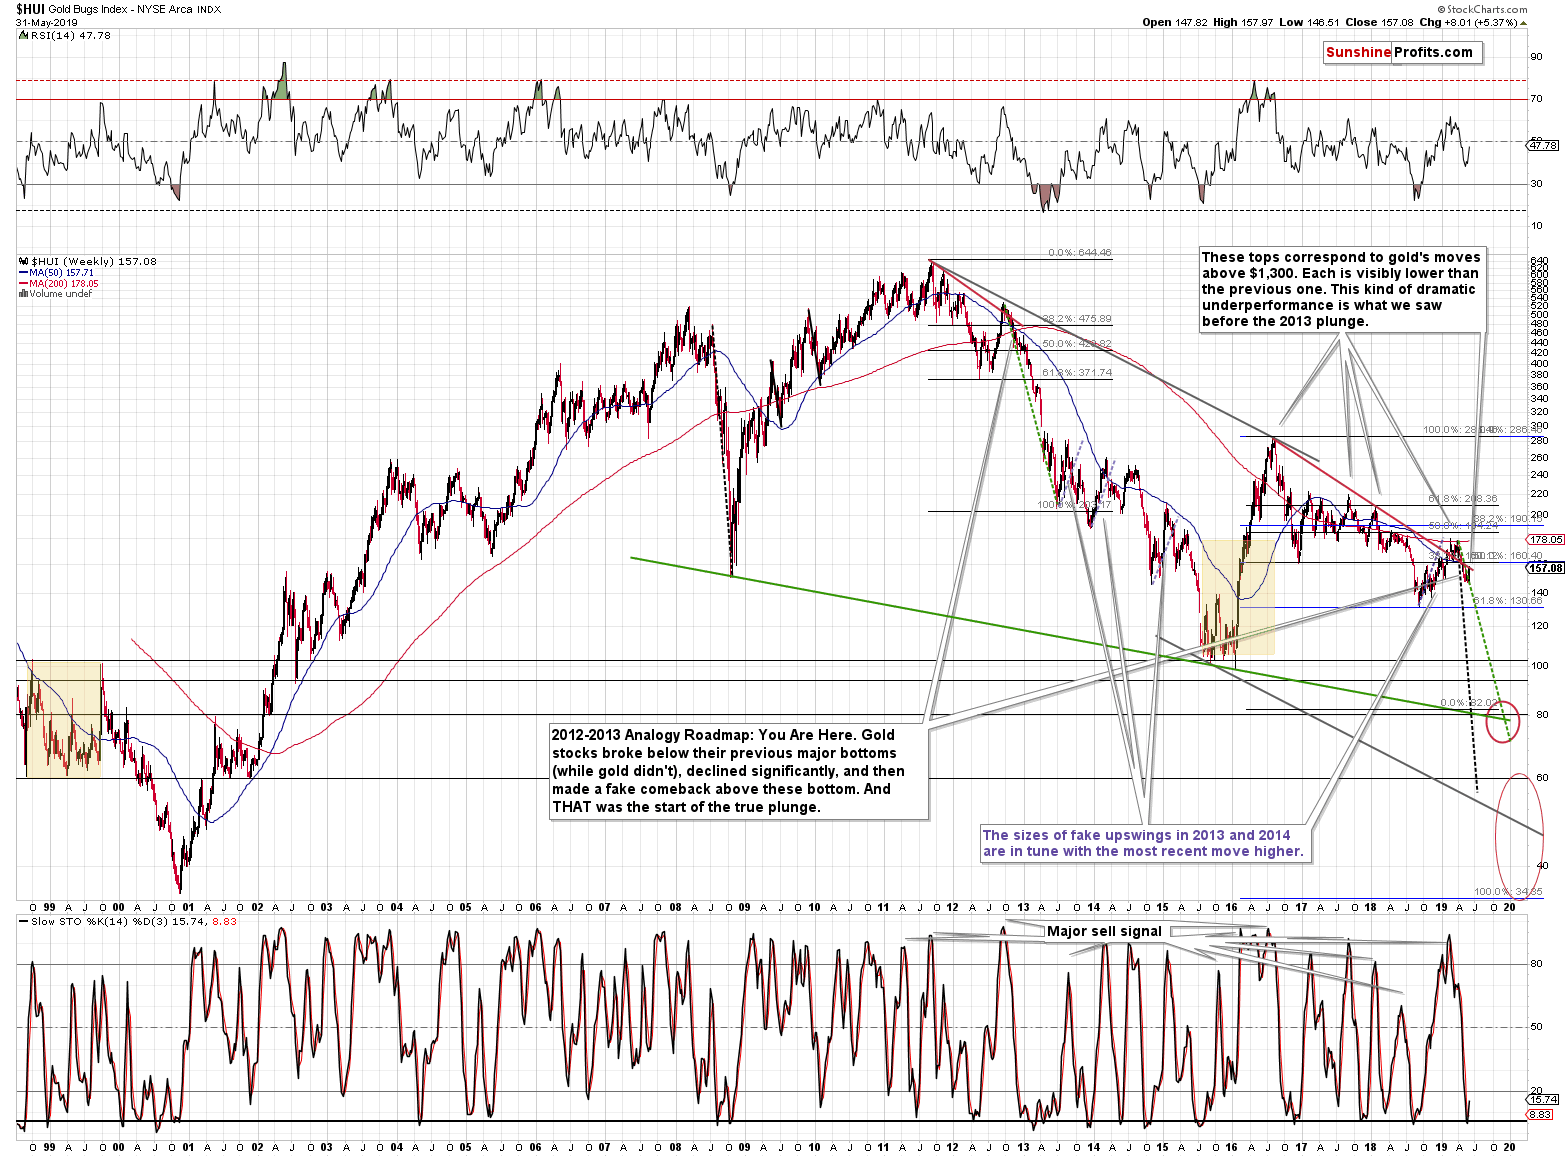
Assuming that the March 2019 top is analogous to the September 2012 top (the above link explains why this is the case), we see that there was just one brief correction to the 50-week moving average before the HUI moved to much lower levels. It took place in December 2012 and it was the very last stop before the decline accelerated. The 50-week moving average was about 460 at that time and the intraweek high was about 455.
This moving average is currently at about 158 and Friday's closing price was 157.08. The important thing is that back in 2012, the rally was invalidated relatively quickly, which is what appears likely also this time.
The above makes a bearish turnaround more likely, but only a little so. After all, it's only one analogous case and we might as well be in a bit different part of the similarity. The key implication of the analogy is different. It's that if we indeed see a turnaround shortly, it will serve as a clear confirmation that the gold miners are about to move much lower in a rather relentless manner.
Speaking of moving in a relentless manner, let's take a look at the USD Index.
Focus on the USD Index
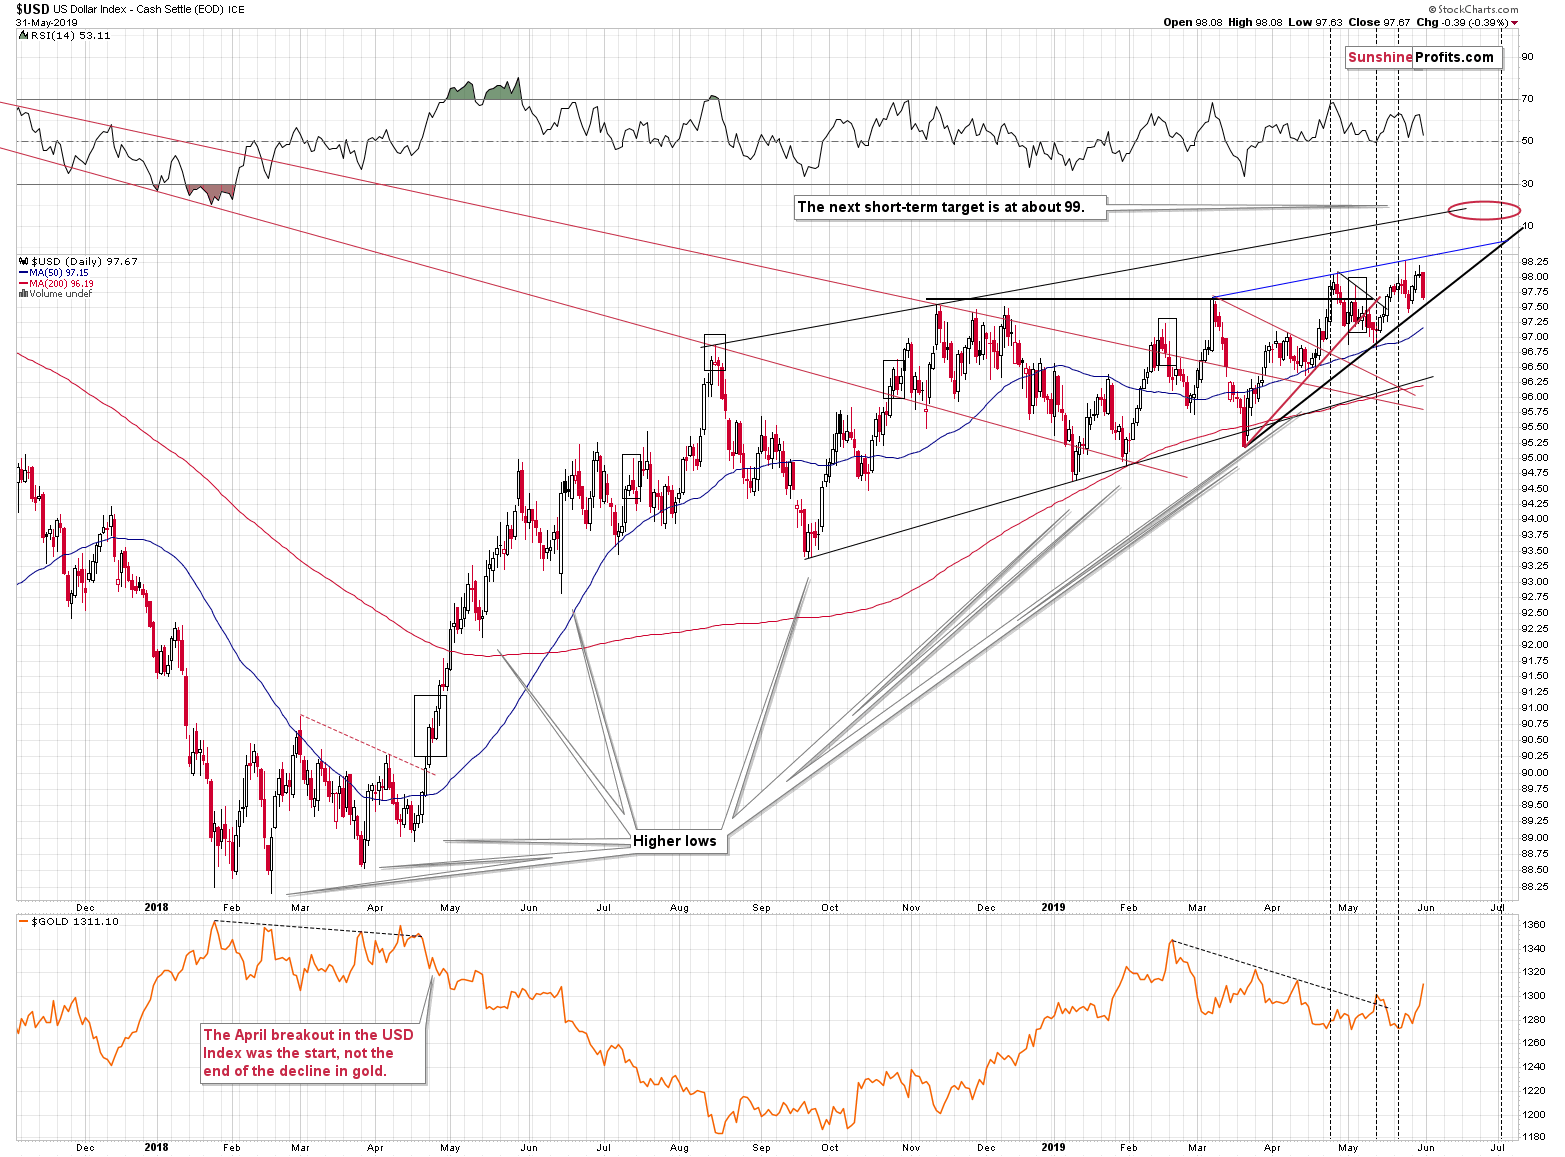
The USD once again moved below the previous highs, and - once again - it formed a higher low. Consequently, our previous comments remain up-to-date:
(...) There were so many attempts to break above the current levels that it will likely take a profound move higher for other markets to catch up and really react.
And you know what? We might actually see this kind of big upswing in the USD shortly. For many weeks (and months) the USD Index has been forming higher lows, increasing the pressure for a breakout. Almost every time when USD was about to break higher, some news popped up and made it decline instead. However, the USD recovered each time and came back a little stronger. It seems that it's already at the situation where no trigger is necessary for it to move higher as there's so much technical pressure built up through the previous months.
Once USDX breaks higher, it's likely to move far. The longer the base, the stronger the move, is one of the useful technical sayings. And the base - the corrective period - took almost a year.
The implications for the precious metals market are very bearish.
We once again saw something like that. The USD is breaking higher and what did we see in the news? President Trump announces a tariff... on Mexico. That's something that is almost certain to damage the value of the US currency. Why? And most importantly - why now? Quoting the above article:
But the sudden tariff threat comes at a peculiar time, given how hard the administration has been pushing for passage of the USMCA, which would update the North American Free Trade Agreement. It comes less than two weeks after Trump lifted import taxes on Mexican and Canadian steel and aluminum, a move that seemed to clear an obstacle to its passage, and the same day that both Trump and López Obrador began the process of seeking ratification. The deal needs approval from lawmakers in all three countries before it takes effect.
So, just two weeks after reducing taxes to make improve the US-Mexico trade, it's now critical to slap tariffs?
Trump never liked the idea of strong dollar. Do you remember when the Treasury Secretary said that he would welcome a lower US dollar? That happened in late January 2018, almost right at the USD Index bottom. Then later in 2018, all the comments from Trump on monetary policy and interest rates.
We're not fans of screaming "manipulation" when things don't go our way, but the USD breakout and the tariff announcement timing is perhaps something more than a coincidence?
If so, what would it mean? Only a slight delay in USD's rally. The USD has already proved to be very strong by coming back up after each string of bearish geopolitical news. It seems that fewer people are willing to trust the tweets and "news" in general, at least with regard to the US dollar movement.
Technically, we just saw a small reversal and the USD Index could move back to about 97.60 or so - to the black rising support line. Then it would be likely to attempt another breakout. The above target is about 0.4 below yesterday's closing price. Given today's pre-market movement, we already saw about half of this move lower. Consequently, the downside potential from here seems very limited.
Another noteworthy thing that we have on the above chart is the intersection of the rising support and resistance line that takes place in early July. It might point to when we see a meaningful turnaround in the USD Index. The next upside target for the USD Index is at about 99, but given the size of the base for the move higher, it could be the case that the pullback from this level is relatively small and the USD will continue to rally relatively shortly after the initial top.
This might mean that the upcoming corrective upswing in the precious metals market is also quite brief.
The USD Index declined 0.39 - very close to the 0.4 that we discussed yesterday. The room for further decline is quite limited as the rising support line is very close.
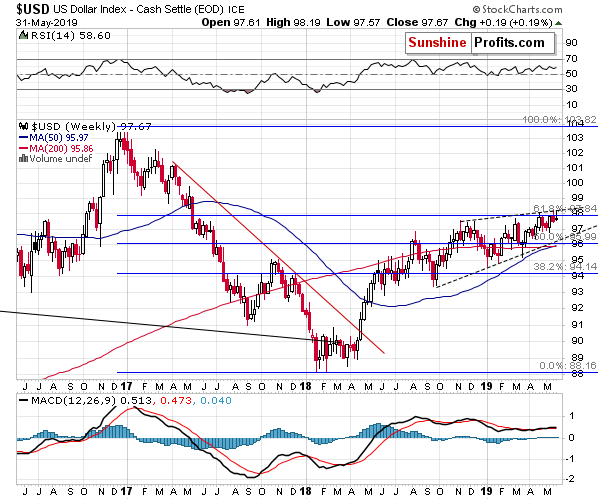
The weekly USD Index chart shows why the current levels are so important and why Trump doesn't want USD's strength particularly now. One thing is that the USD Index has been moving back and forth in a rising wedge pattern despite the fundamental news that should have caused it to decline. Remember Fed's dovish shift in March? We wrote that the implications of USD's reaction were actually bullish and now - a few months later - we see the USDX higher, even though the Fed didn't become more hawkish.
The second thing - that is clearly visible to anyone interested in the US currency's outlook - is the proximity of the 61.8% Fibonacci retracement level based on the entire 2017-2018 decline. According to some definitions unless a market moves back above this retracement, the entire rally is nothing more than a counter-trend correction and the downtrend remains intact. But once this retracement is broken, it means that the decline has really ended. Even if one doesn't go as far with the interpretation, they need to agree that the Fibonacci retracements are one of the most useful technical tools that universally work on most markets. And the 61.8% is the most classic of these retracements.
If someone wants the USD Index to fall, then they will fight for it not to break above the 61.8% Fibonacci retracement. From this point of view, the tariff announcement regarding Mexico is perfectly understandable. It's not really about Mexico - it's about anything that could prevent dollar's rally.
And you know what? It won't work. The geopolitical news usually don't tend to have a lasting impact, even if they are not reversed (did Russia give the Crimean peninsula back to Ukraine? No. Did precious metals decline anyway? Yes.) The recent trade news is likely to be reversed and even if it wasn't... Please note how little in the USD Index has changed. It's still relatively close to the yearly highs despite a very important impact this tariff (and a retaliatory tariff) would have on the U.S. economy. Not to mention the demise of USMCA. The outlook for the USD Index remains bullish even though we may see some choppy trading in the very near term.
The implications for the precious metals market remain bearish.
Summary
Summing up, even though gold moved higher yesterday, the outlook for the following weeks didn't change and it remains bearish. The news-based nature of the USD reversal makes it temporary and the same appears to be the case for the gold price rally. The turnaround took place right at the long-term vertex-based reversal for silver and mining stocks. It's an unfortunate coincidence that Trump had to make the extremely surprising comments right on this day - if it wasn't for that, the rally would have likely been minimal. It doesn't seem to change anything regarding the next several weeks and months, though. The next reversal is likely to take place shortly - but based on the recent move higher in gold, the reversal is likely to be a price top. The next bottom is likely to be formed in the final part of June, which means that gold, silver and miners will have a few weeks to slide to their respective targets. This makes it more likely that miners will be able to reach their distant target along with the underlying precious metals. Once gold reaches our interim target level of $1,240, we will consider opening long positions.
Today's article is a small sample of what our subscribers enjoy regularly. For instance today, we've also shared the updated gold price path for the nearest weeks and months with them. To keep informed of both the market changes and our trading position changes exactly when they happen, we invite you to subscribe to our Gold & Silver Trading Alerts today.
Thank you.
Przemyslaw Radomski, CFA
Editor-in-chief, Gold & Silver Fund Manager
Sunshine Profits - Effective Investments through Diligence and Care
