

The U.S. stock market indexes were mixed between -0.9% and -0.1% on Wednesday, as investors hesitated following Friday-Monday's sell-off and Tuesday's bounce. Stocks extended their upward correction, before reversing lower. The S&P 500 index lost 0.5%, and closed below the level of 2,700. It currently trades around 6.7% below its January 26 record high of 2,872.87. The Dow Jones Industrial Average was relatively stronger than the broad stock market yesterday, as it lost 0.1%, and the technology Nasdaq Composite lost 0.9%.
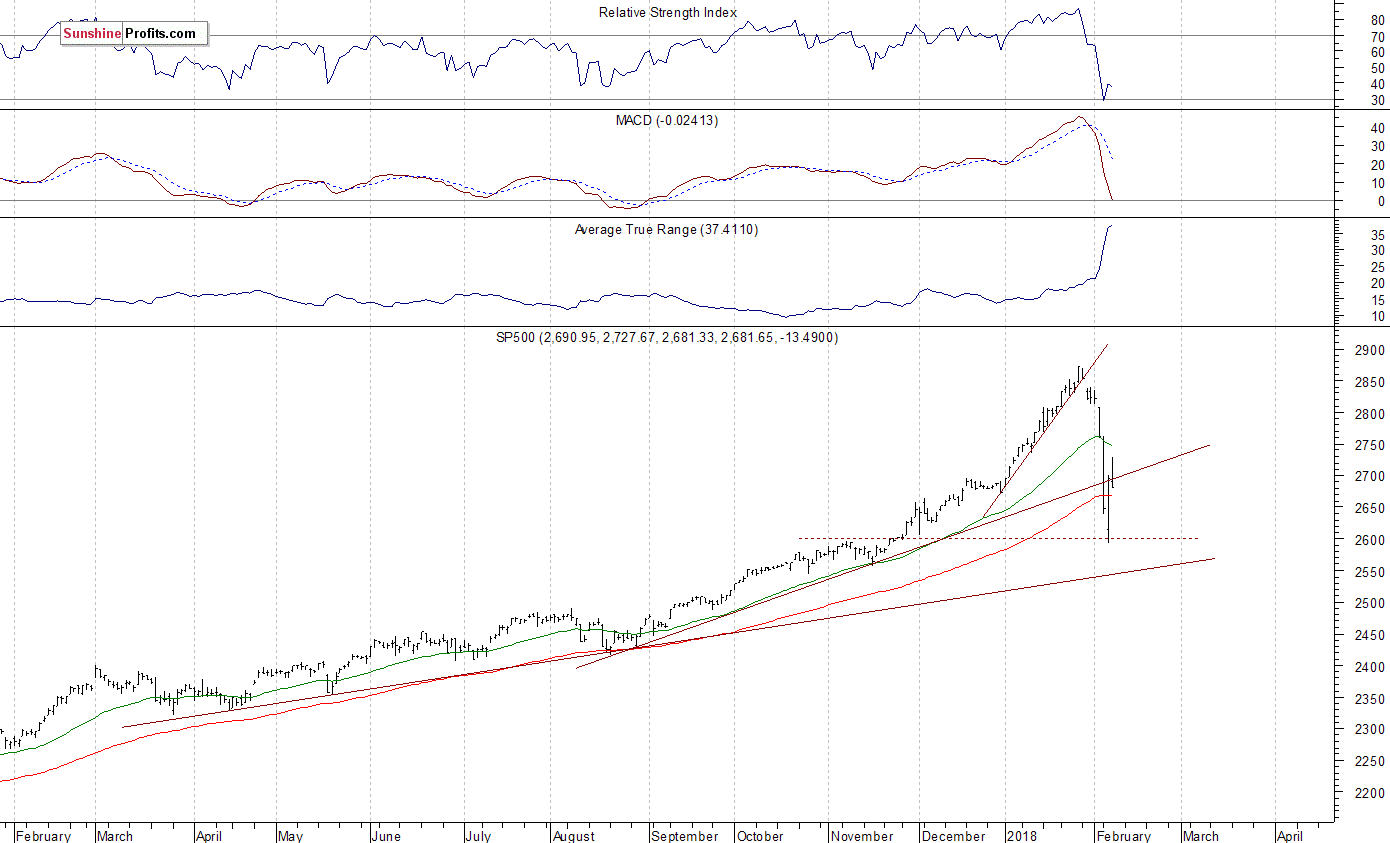
The nearest important level of support of the S&P 500 index remains at around 2,640-2,650, marked by Monday's daily low. The next support level is at 2,600-2,620, marked by Tuesday's daily low and some early December fluctuations. On the other hand, level of resistance is at 2,700, marked by previous support level. The next resistance level remains at 2,730, marked by yesterday's daily high. The resistance level is also at 2,750-2,760.
The index reached its record high almost two weeks ago on Friday. It broke below month-long upward trend line on Tuesday last week following gap-down opening of the trading session, confirming reversal of the uptrend. Then it retraced all of its January rally and continued lower. Tuesday's bounce stopped the decline, but will stocks reverse their new downtrend? Yesterday's trading session showed that the market is far from being bullish at this moment. We can see that stocks are sharply reversing their medium-term upward course following the whole retracement of last month's euphoria rally:
More Short-Term Fluctuations
The index futures contracts trade 0.1-0.3% lower vs. their Wednesday's closing prices this morning. So, investors' expectations ahead of the opening of today's trading session are slightly negative. The European stock market indexes have lost 0.8-1.3% so far. Will the sentiment change before cash market opening at 9:30 a.m.? For now, it looks like the market won't continue its two-session-long bounce off Tuesday's low. One thing's for sure, volatility will remain relatively high. Investors will wait for the Initial Claims number release at 8:30 a.m. The market expects that it was at 232,000 last week. Investors will also wait for more quarterly corporate earnings releases.
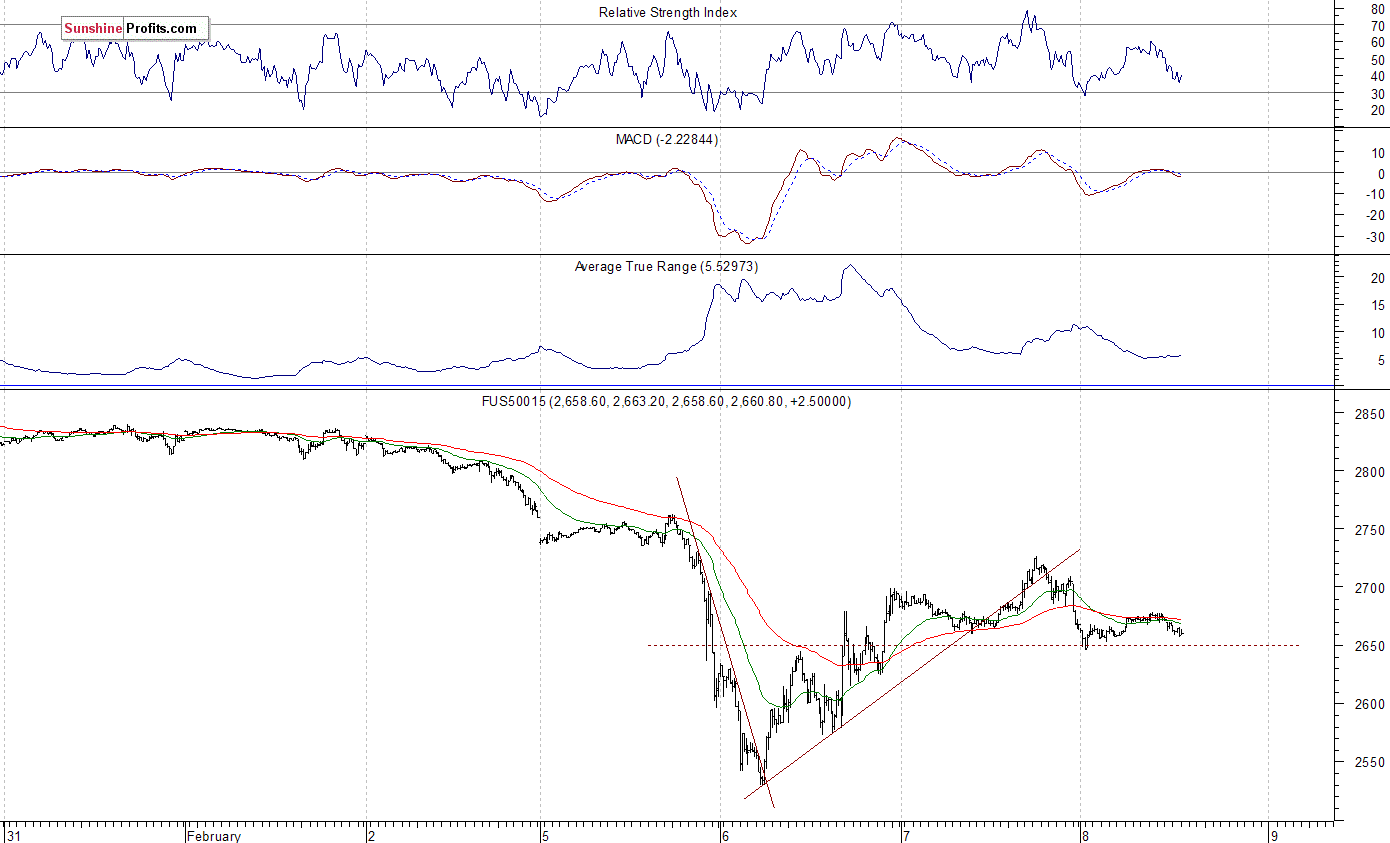
The S&P 500 futures contract trades within an intraday consolidation, following yesterday's move down. The market continues to fluctuate after bouncing off almost 200 points from Tuesday's daily low of around 2,530. It still trades more than 200 points below its late January record high. We may see some more short-term consolidation. The nearest important level of resistance is at 2,680-2,700, and the next resistance level is at 2,720-2,730, marked by yesterday's daily high. On the other hand, support level is at 2,650, marked by local low. The next level of support is at 2,600-2,620, among others. The futures contract trades within a short-term consolidation along the level of 2,650, as the 15-minute chart shows:
Big Volatility
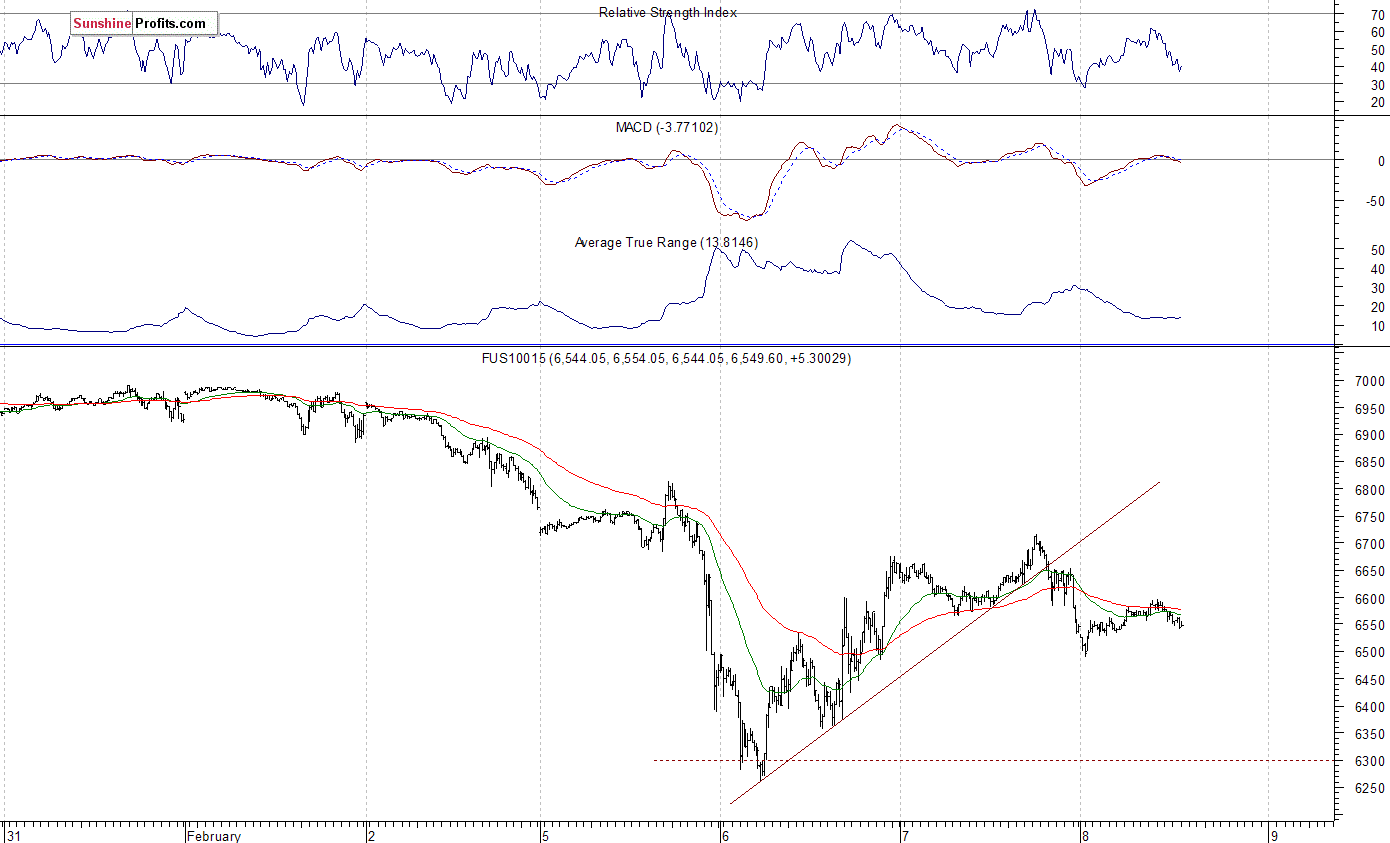
The technology Nasdaq 100 futures contract follows a similar path, as it trades within a short-term consolidation after its yesterday's intraday move down from resistance level at around 6,700. The market lost more than 200 points off its daily high located slightly above 6,700 mark. The daily low fell below the level of 6,500. It shows how volatile the market is right now. So, just like 24 hours ago, the market is trading relatively close to the level of 6,600 - much above recent local low of 6,260, but also well below its January 29 record high of around 7,050. Is this a short-term upward reversal or just upward correction? For now, it looks like some strong rebound followed by uncertainty. The nearest important level of support is at around 6,480-6,520. On the other hand, resistance level is at 6,600, and the next level of resistance is at 6,650, marked by short-term local highs. The Nasdaq futures contract broke below its short-term upward trend line, and continues sideways, as we can see on the 15-minute chart:
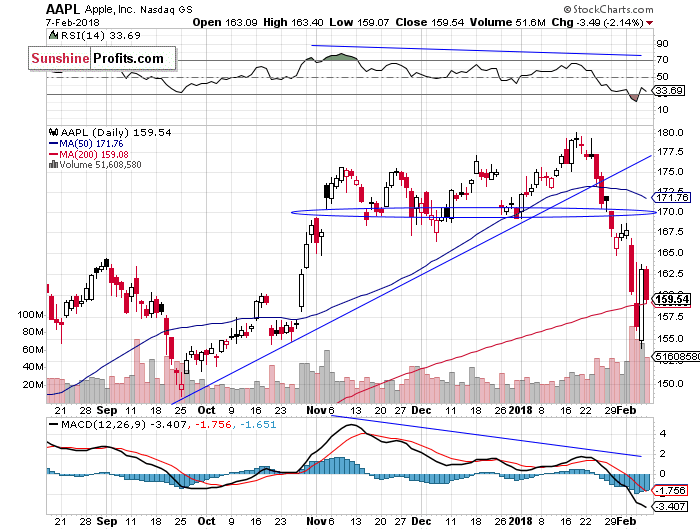
Let's take a look at Apple, Inc. stock (AAPL) daily chart (chart courtesy of http://stockcharts.com). It was one of the recent stock market rout's main drivers. The stock reached new record high around three weeks ago, following short-term consolidation along the support level of $175. The market got closer to $180 mark, but it failed to continue higher. Consequently, the stock retraced its January advance and continued lower. It broke its losing streak on Tuesday after opening lower. However, it retraced some of its rebound yesterday. So, potential bullish engulfing reversal pattern remains unconfirmed. The support level is at around $150-155, and resistance level is at $163, among others:
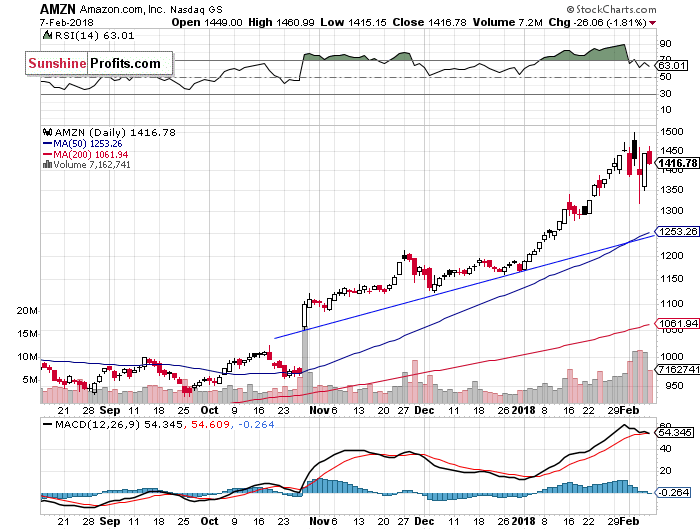
Amazon.com, Inc. stock (AMZN) remains relatively strong vs. the broad stock market. Despite an overall weakness, it was extending its month-long rally up until Friday and its new record high close at around $1,500 mark. The stock continues to trade well above its end of year closing price of $1,167.5. AMZN bounced back above the level of $1,400 on Tuesday, but it failed to continue towards new record highs. For now, it looks like some medium-term topping pattern:
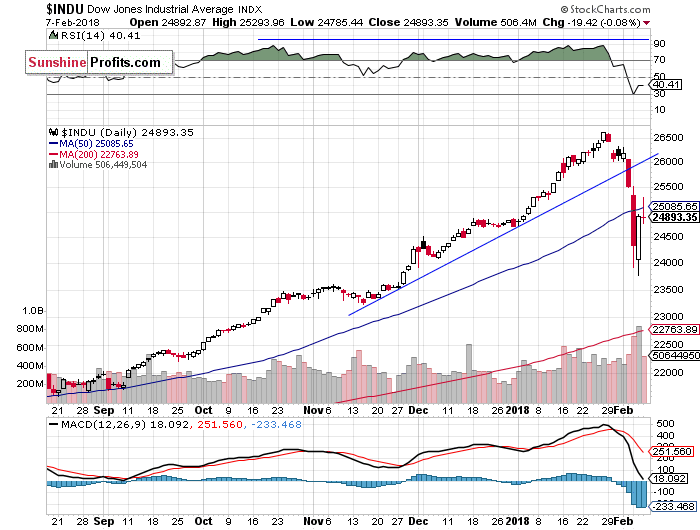
The Dow Jones Industrial Average daily chart shows that blue-chip index broke below its short-term consolidation on Friday last week. The price sharply accelerated its downtrend on Monday, as it broke below the level of 25,500 and continued towards 24,000 mark. There were some medium-term negative technical divergences - the most common divergences are between asset’s price and some indicator based on it (for instance the index and RSI based on the index). In this case, the divergence occurs when price forms a higher high and the indicator forms a lower high. It shows us that even though price reaches new highs, the fuel for the uptrend starts running low.
The DJIA broke below its three-month-long upward trend line and retraced most of the November-January rally. Is this a new downtrend or still just correction? Tuesday's bounce was a first positive signal for the blue-chip market. We can see positive bullish piercing candlestick chart pattern. It is a pattern where the price literally pierces up through the falling market. However, we can see some short-term trouble, as the index struggles at the nearest important resistance level of 25,000:
Concluding, the S&P 500 index retraced some more of its recent sell-off yesterday, but it reversed lower and closed 0.5% below its Tuesday's closing price. The broad stock market was almost 10% below its late January record high on Tuesday. Is this two-session rally an upward reversal or just "dead cat bouncing" upward correction? For now, it looks like a correction or maybe some short-term consolidation within an upward correction.
The broad stock market retraced its whole month-long January rally, so medium-term picture is now bearish. Investors took profits off the table following the unprecedented month-long rally, but then they began selling in panic. It was quite similar to 2010 Flash Crash event. So, is this just downward correction or the beginning of a new medium-term downtrend? Friday-Tuesday's sell-off sets the negative tone for weeks or months to come.
The S&P 500 index traded around 7.5% above its December 29 yearly closing price on Friday January 26. This almost month-long rally seemed unprecedented. The legendary investor John Templeton once said that "bull markets are born on pessimism, grow on skepticism, mature on optimism and die on euphoria”. So, now it looks like it was an euphoria phase of the nine-year-long bull market. Did it die over this weekend? It's hard to say, but new record highs scenario seems very unlikely now.
If you enjoyed the above analysis and would like to receive free follow-ups, we encourage you to sign up for our daily newsletter – it’s free and if you don’t like it, you can unsubscribe with just 2 clicks. If you sign up today, you’ll also get 7 days of free access to our premium daily Gold & Silver Trading Alerts. Sign me up.
Thank you.
Paul Rejczak
Stock Trading Strategist
Stock Trading Alerts
Sunshine Profits - Free Stock Market Analysis
