

The U.S. stock market indexes gained 0.1-0.5% on Wednesday, as they slightly extended their short-term uptrend. The S&P 500 index retraced more of its October-December downward correction of 20.2% (2,713.88). It gets closer to the previous local highs along the 2,800 level. The Dow Jones Industrial Average gained 0.5% and the Nasdaq Composite gained 0.1% yesterday.
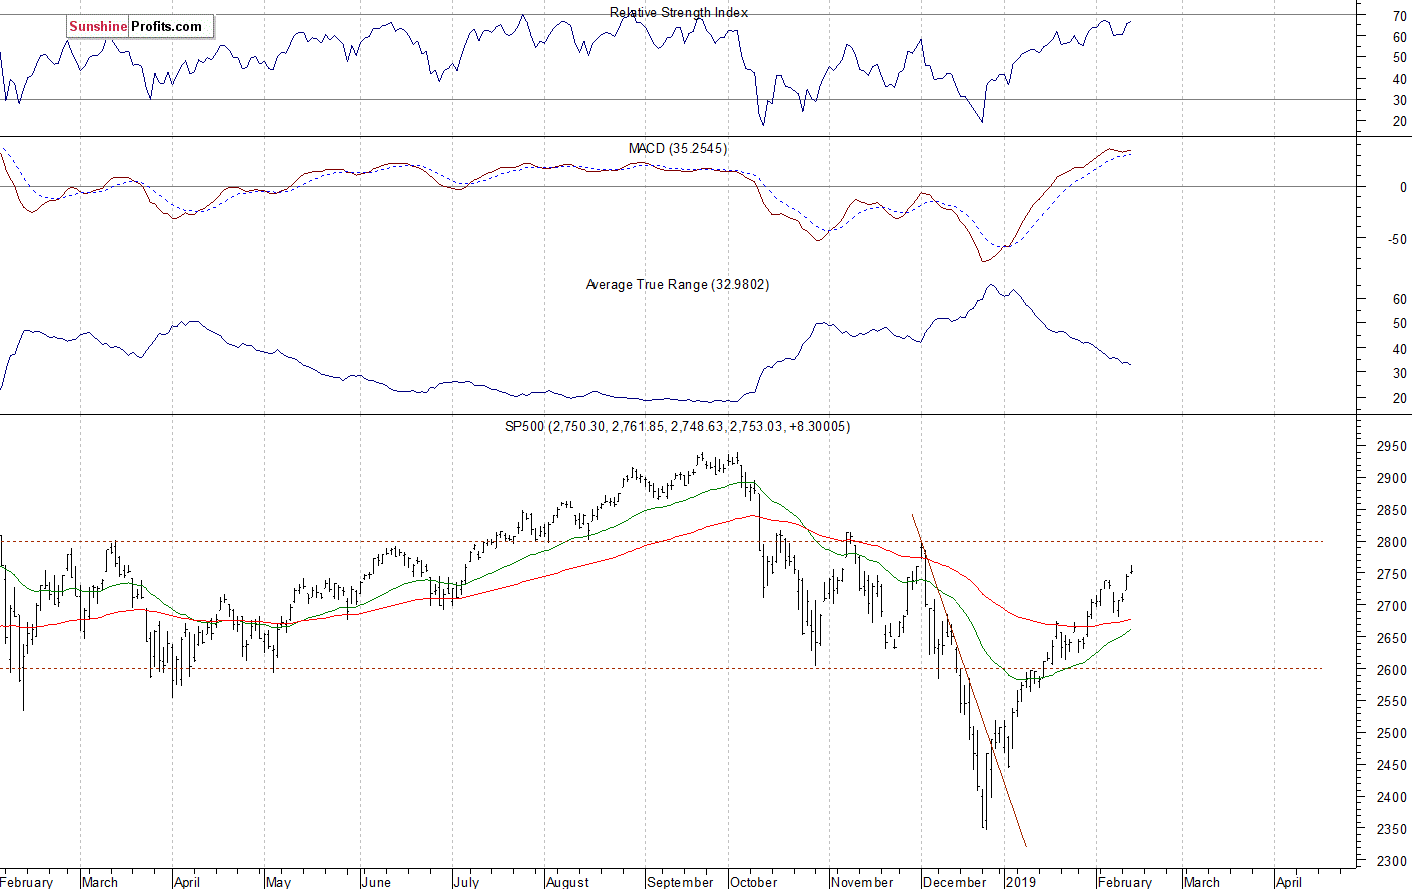
The nearest important resistance level of the S&P 500 index remains at around 2,785-2,800, marked by the previous medium-term local highs. On the other hand, the support level is at 2,745-2,750, marked by yesterday's daily gap up of 2,748.19-2,748.63. The support level is also at 2,720, marked by the Tuesday's daily gap up of 2,718.05-2,722.61.
The broad stock market broke below its two-month-long trading range in the mid-December, as the S&P 500 index fell below the level of 2,600. Then the market accelerated lower and it broke below the 2,400 mark. Since then, it has retraced more than 61.8% of the whole decline off the September high. The index got closer to its October-November local highs and the resistance level of 2,800 recently, as we can see on the daily chart:
Positive Expectations Again
Expectations before the opening of today's trading session are positive, because the index futures contracts trade 0.3-0.4% above their yesterday's closing prices. The European stock market indexes have gained 0.3-0.6% so far. Investors will wait for series of economic data announcements today: Producer Price Index, Retail Sales, Initial Claims at 8:30 a.m., Business Inventories at 10:00 a.m. The broad stock market will likely fluctuate following the recent advance today. We may see some uncertainty, as the market gets closer to the medium-term resistance level.
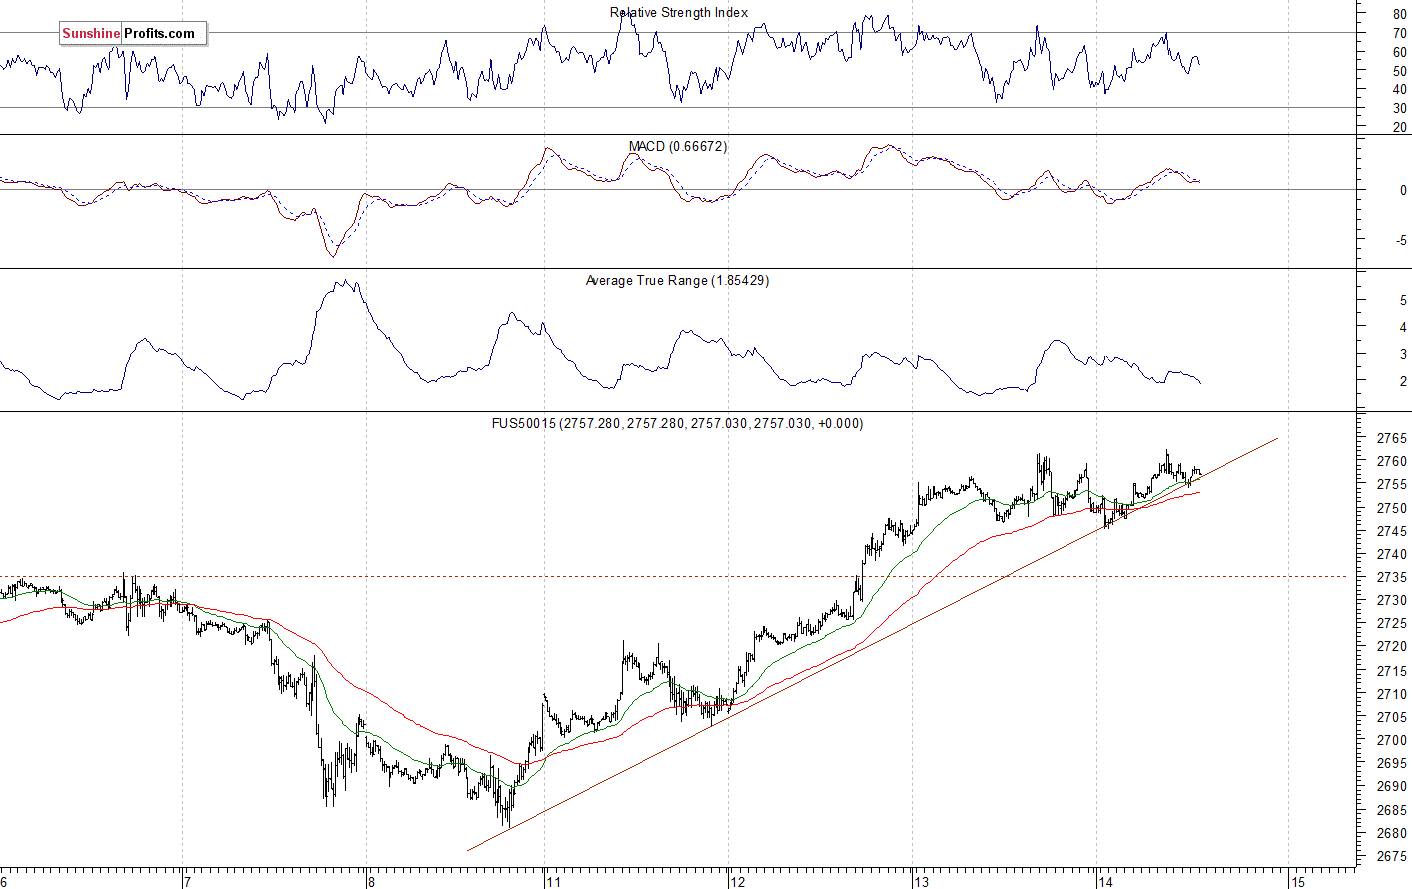
The S&P 500 futures contract trades within an intraday uptrend, as it retraces it yesterday's late-day weakness. The nearest important level of resistance is at around 2,760-2,765, marked by the short-term local highs. On the other hand, the support level is at 2,745--2,750, among others. The futures contract continues to trade along the short-term upward trend line, as the 15-minute chart shows:
Nasdaq Remains Above 7,000
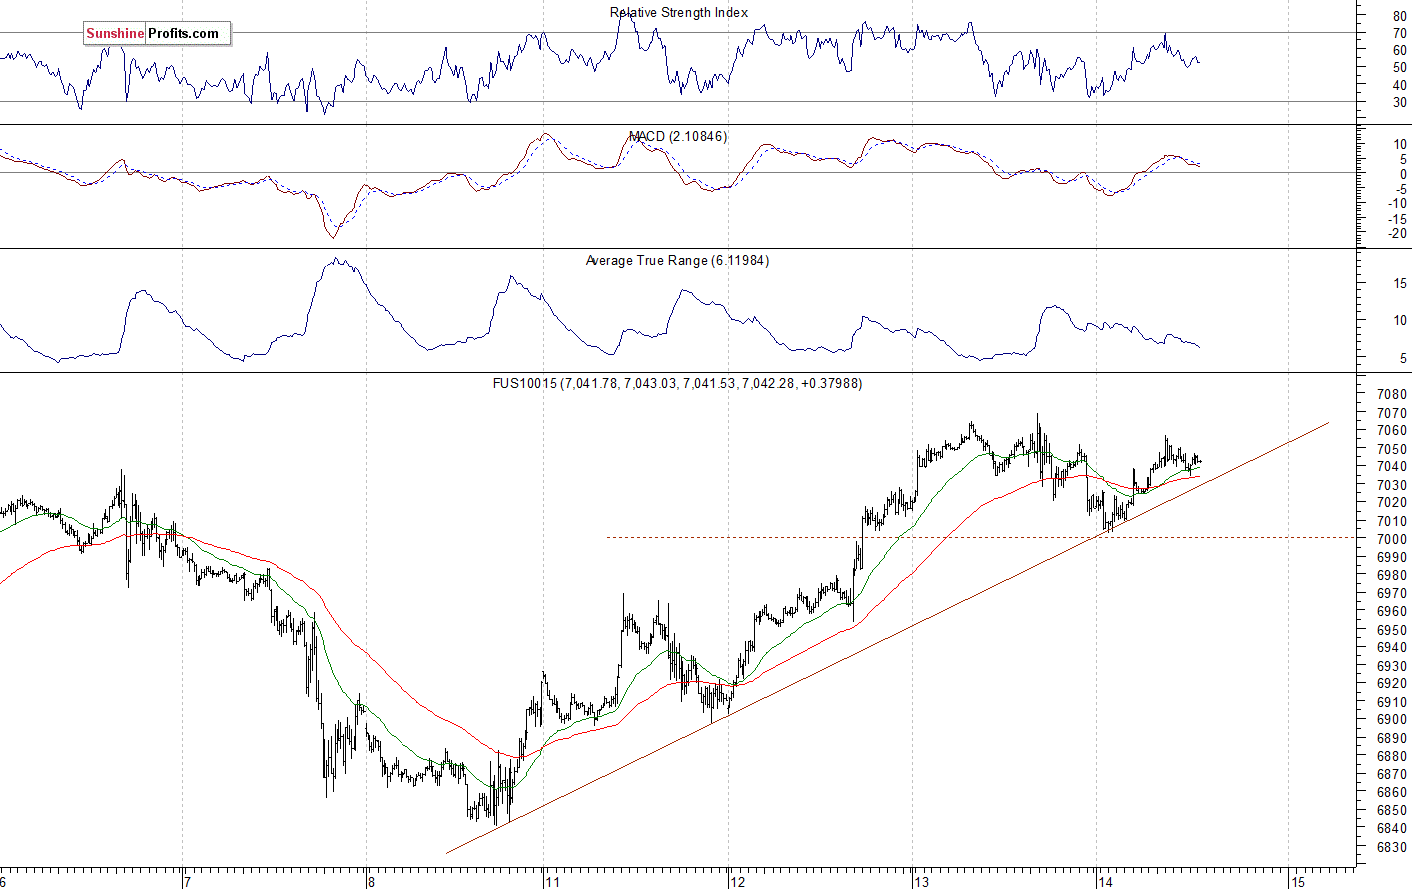
The technology Nasdaq 100 futures contract follows a similar path, as it retraces yesterday's intraday decline. The market gained almost 1,250 points from December the 26th local low of around 5,820. The nearest important resistance level is now at 7,100-7,150. The support level is at 6,950-7,000, among others. The Nasdaq futures contract trades within a day-long consolidation, as we can see on the 15-minute chart:
Apple, Amazon - No Big Changes
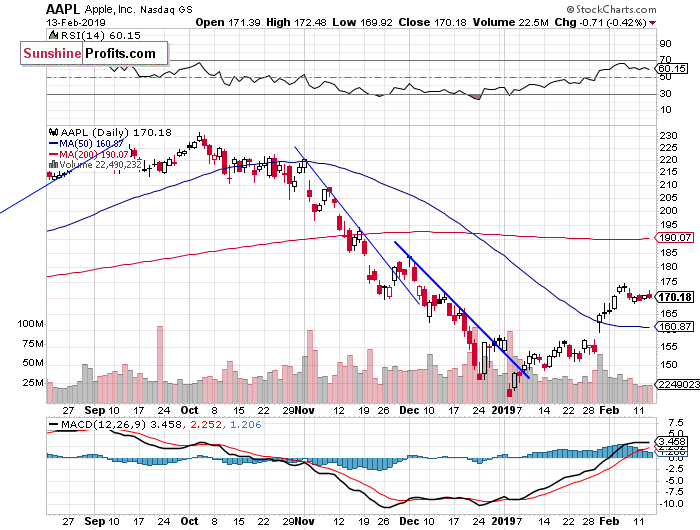
Let's take a look at the Apple, Inc. stock (AAPL) daily chart (chart courtesy of http://stockcharts.com). Apple released its quarterly earnings recently. Then the stock broke above the recent trading range and the resistance level of $155-160. It retraced some more of its November-December sell-off. But on Thursday a week ago it bounced off $175, retracing some of the recent advance. For now, it still looks like a short-term downward correction:
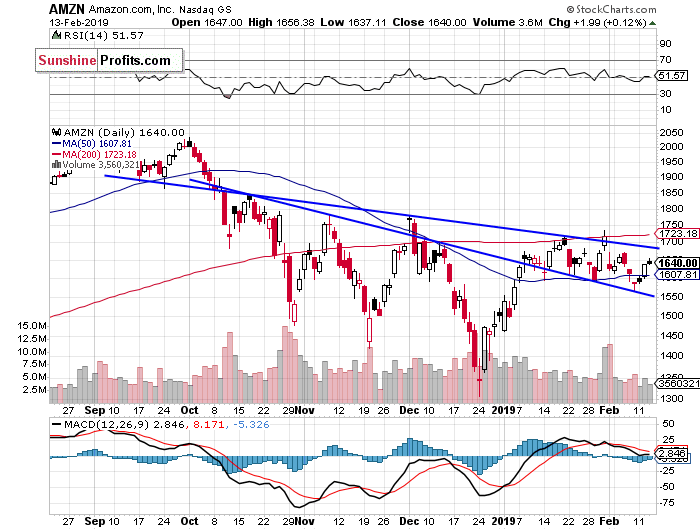
Now let's take a look at the daily chart of Amazon.com, Inc. (AMZN). The market broke above one of its three-month-long downward trend lines a month ago. Since then it has been going sideways. There is a resistance level at around $1,700-1,750. Recently it bounced off that resistance level following quarterly earnings release. This week the stock got closer to the downward trend line again:
Dow Jones at New Short-Term High
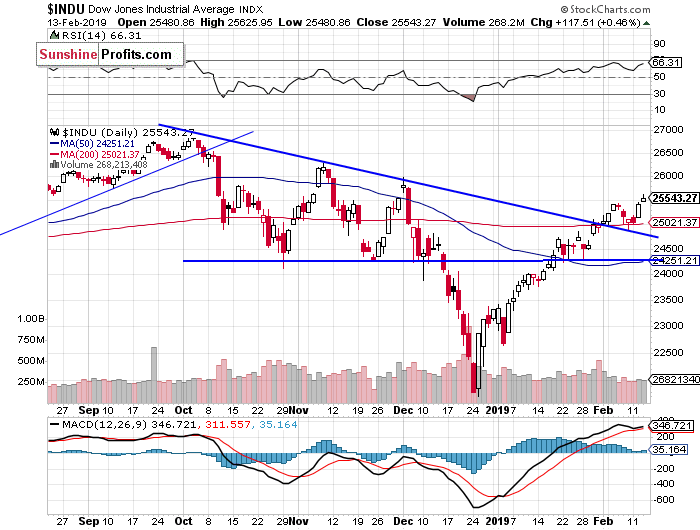
The Dow Jones Industrial Average is at the new short-term local high and it gets closer to the resistance level of 25,500-26,000. Will the blue-chip stocks' gauge continue higher and reach its record high? Or reverse lower in the near term? There have been no confirmed negative signals so far:
Japanese Nikkei Also Higher
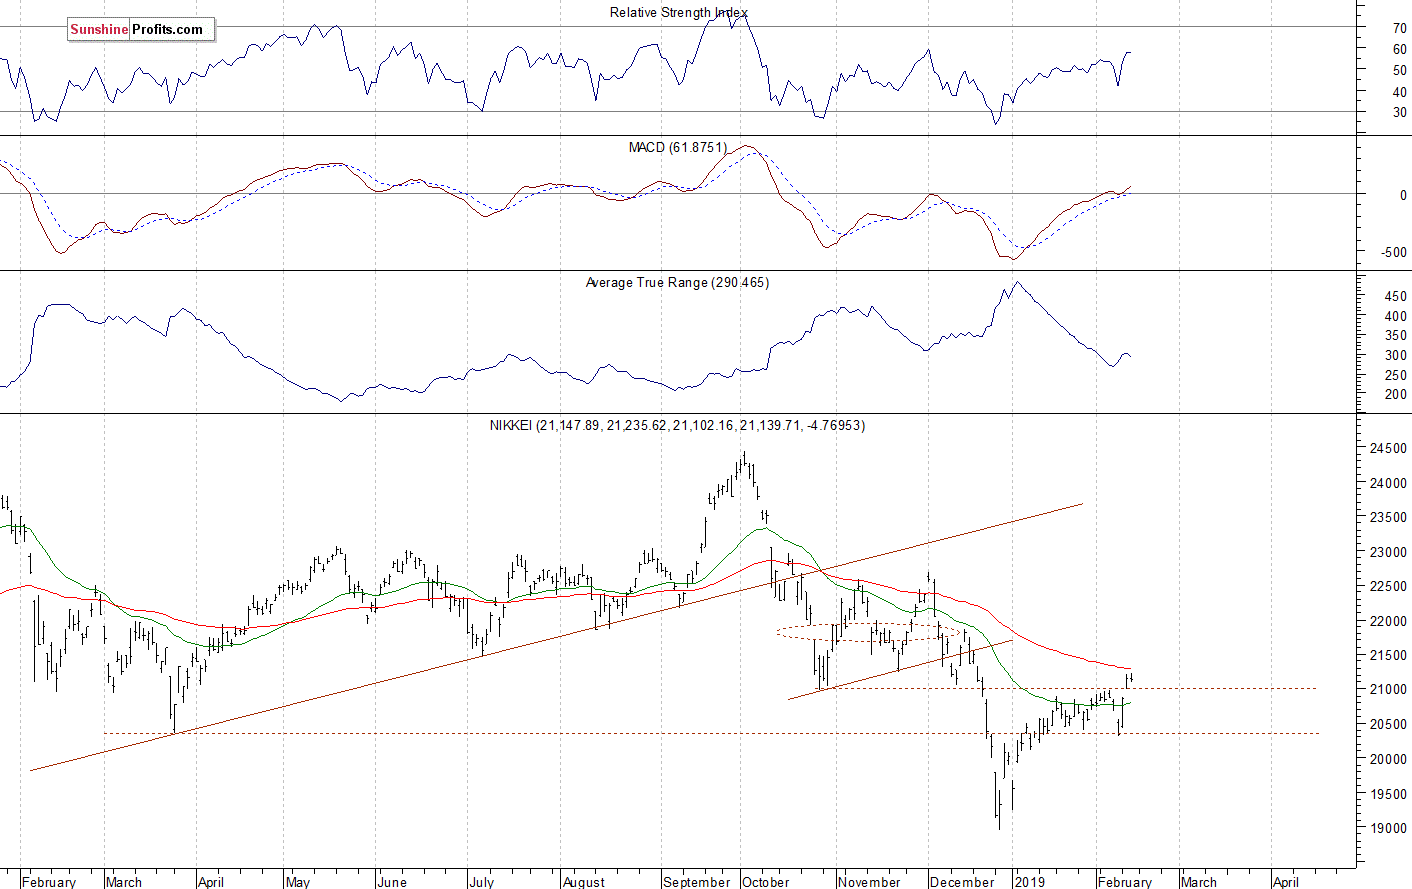
Let's take a look at the Japanese Nikkei 225 index. It accelerated the downtrend in late December, as it fell slightly below the level of 19,000. Since then it has been retracing the downtrend. On Tuesday, the market broke above its recent local highs and the 21,000 resistance level. The next important resistance level is at 21,600-22,000, marked by the December consolidation:
The S&P 500 index broke above its recent local high this week, as it got close to the 2,750 mark. Is this a new medium-term uptrend or still just upward correction before another medium-term leg lower? The market trades above the 61.8% Fibonacci retracement of the whole medium-term decline. There have been no confirmed negative signals so far.
Concluding, the S&P 500 index will likely open higher today. We may see another attempt at extending the uptrend. However, there are some short-term technical overbought conditions.
If you enjoyed the above analysis and would like to receive free follow-ups, we encourage you to sign up for our daily newsletter – it’s free and if you don’t like it, you can unsubscribe with just 2 clicks. If you sign up today, you’ll also get 7 days of free access to our premium daily Gold & Silver Trading Alerts. Sign up today!
Thank you.
Paul Rejczak
Stock Trading Strategist
Sunshine Profits - Effective Investments through Diligence and Care
