

Stock Trading Alert originally sent to subscribers on June 5, 2017, 6:57 AM.
Our intraday outlook is now bearish, and our short-term outlook is bearish. Our medium-term outlook remains neutral, following S&P 500 index breakout above last year's all-time high:
Intraday outlook (next 24 hours): bearish
Short-term outlook (next 1-2 weeks): bearish
Medium-term outlook (next 1-3 months): neutral
Long-term outlook (next year): neutral
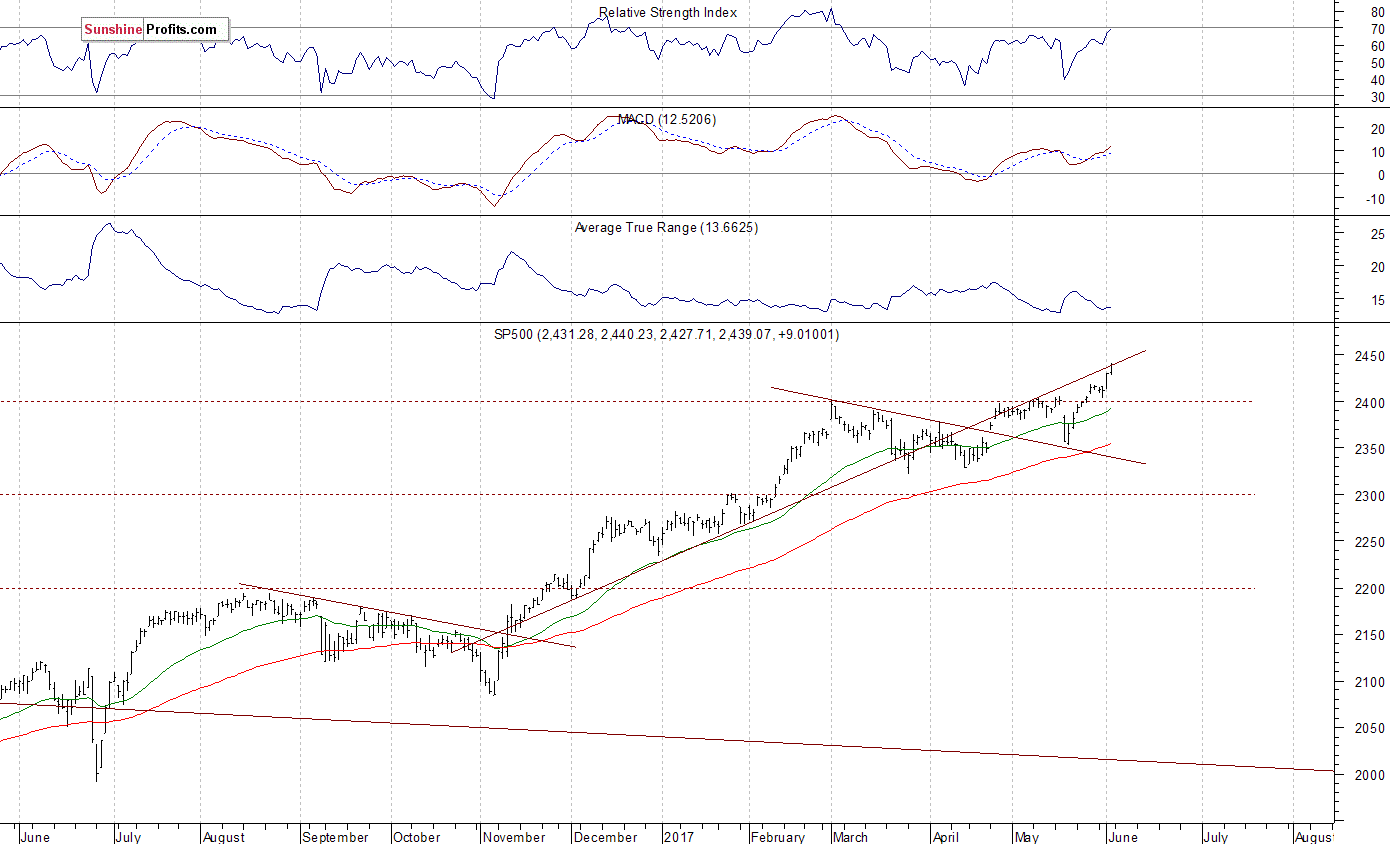
The U.S. stock market indexes gained between 0.3% and 1.1% on Friday, as investors reacted to monthly jobs report release, among others. The S&P 500 index has reached yet another new all-time high at the level of 2,440.23, following recent breakout above week-long consolidation along 2,400 mark. Stocks have rebounded strongly after their mid-May quick two-session sell-off. They continue their over eight-year-long bull market off 2009 lows. The Dow Jones Industrial Average broke slightly above the level of 21,200 on Friday, as it reached new record high of 21,225.04. The technology Nasdaq Composite remains relatively stronger than the broad stock market. It reached new record high, as it broke above the level of 6,300 for the first time. The nearest important resistance level of the S&P 500 index is at around 2,440-2,450, marked by new record high, among others. On the other hand, support level is currently at around 2,415-2,420, marked by previous resistance level. The next support level is at 2,400-2,410, marked by the May 25 daily gap up of 2,405.58-2,408.01, among others. The support level is also at 2,390-2,395, marked by some short-term local lows. Will the uptrend continue towards 2,500 mark? There have been no confirmed negative signals so far. However, we can see some overbought conditions and negative technical divergences. The S&P 500 index is currently trading close to its November-April upward trend line, as we can see on the daily chart:
Mixed Expectations As Investors Take Short-Term Profits Off The Table
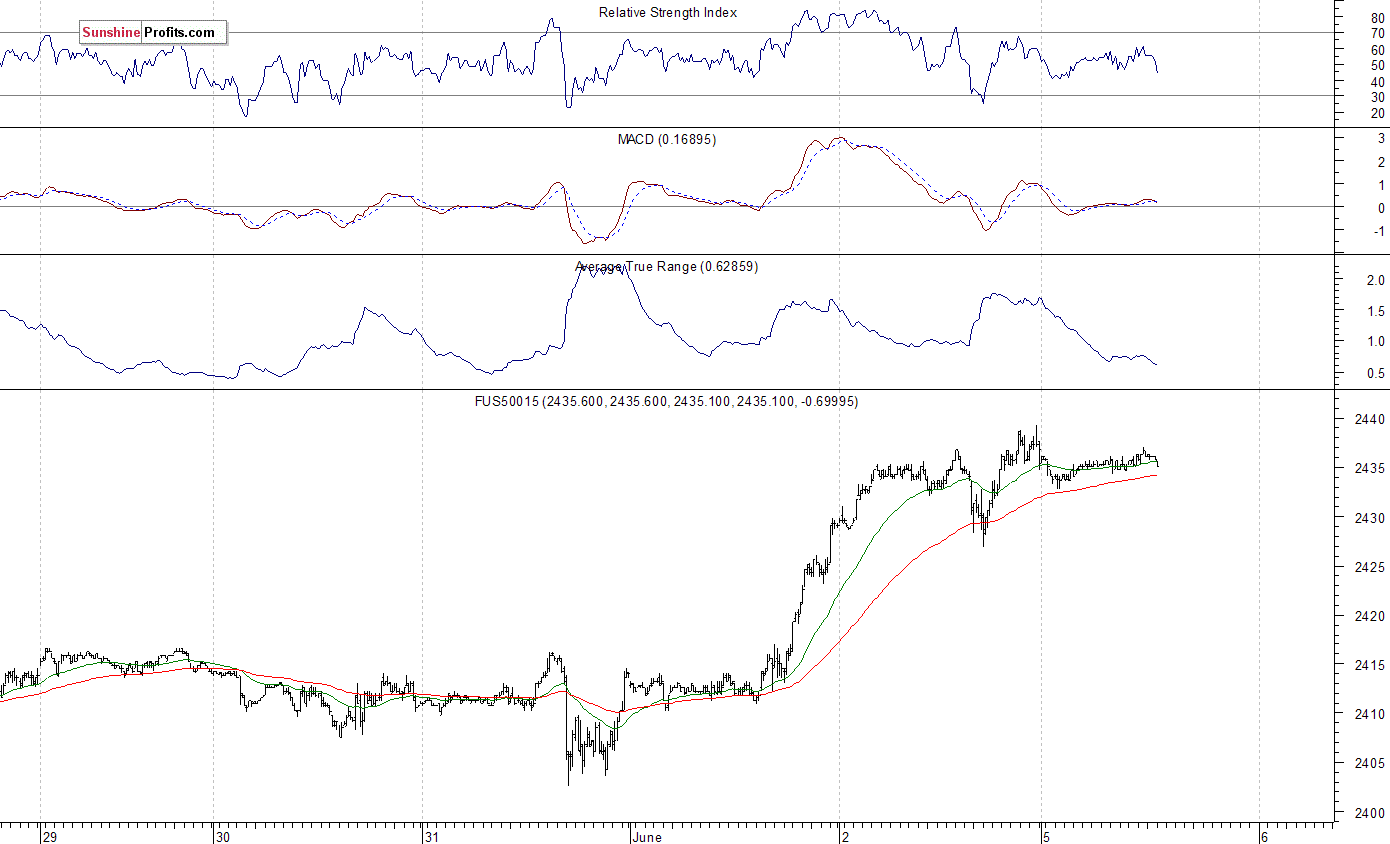
Expectations before the opening of today's trading session are virtually flat, with index futures currently between -0.05% and -0.1% vs. their Friday's closing prices. The main European stock market indexes have lost 0.2-0.6% so far. Investors will now wait for some economic data announcements: Productivity number at 8:30 a.m., ISM Services, Factory Orders at 10:00 a.m. The market expects that Productivity fell 0.2% in Q1, and the ISM Services number was at 57.0 in May. The S&P 500 futures contract trades within an intraday consolidation, following Friday's move up. It is trading slightly below new record high close to the level of 2,440. The nearest important resistance level is at around 2,435-2,440. On the other hand, support level is at 2,425-2,430, marked by recent local low. The next support level remains at 2,400-2,410. The market trades within a short-term uptrend, as it is above the early March local high. There have been no confirmed negative signals so far. However, we can see some short-term overbought conditions, along with negative technical divergences:
Technology Stocks Trade At New Record Highs, But Will They Continue Higher?
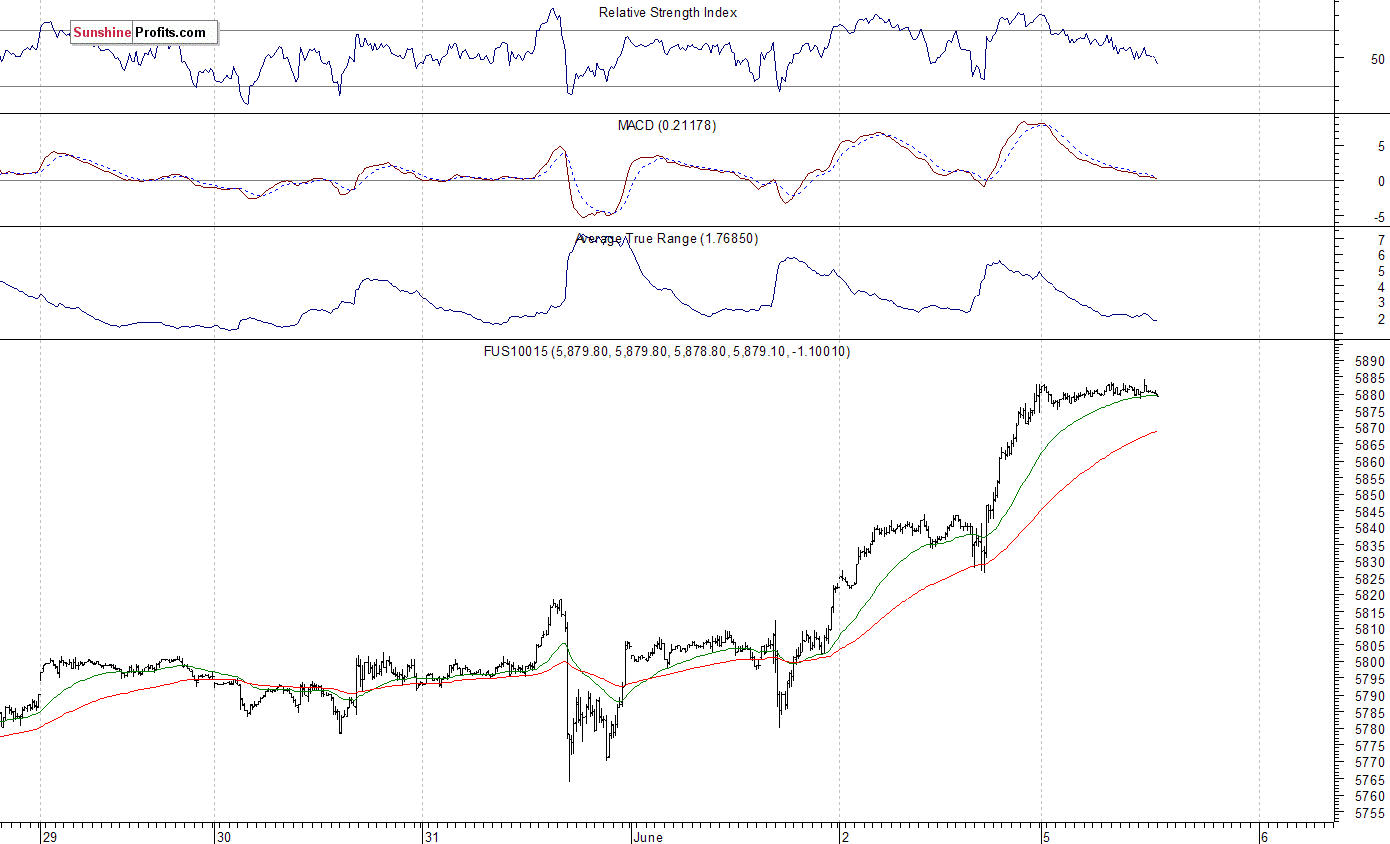
The technology Nasdaq 100 futures contract follows a similar path, as it currently trades within an intraday consolidation along the level of new record high. The nearest important resistance level is at 5,880-5,900. Potential level of resistance is also at 6,000 mark. The market extends its six-week-long rally following late April breakout above the level of 5,500. On the other hand, the nearest important level of support is at around 5,830, marked by recent fluctuations. The next support level is at 5,800-5,820, marked by short-term consolidation. There have been no confirmed negative signals so far. But will technology stocks continue their rally despite some short-term overbought conditions? We can see some negative technical divergences:
Concluding, the S&P 500 index has reached new all-time high on Friday, as it extended its gains following a breakout above early March high along the level of 2,400. Investors' sentiment improved following monthly jobs report release, among others. The market continues its eight-year-long bull market. But will the uptrend accelerate? Or is this some topping pattern before downward reversal? We still can see some negative medium-term technical divergences. There have been no confirmed negative signals so far.
Thank you.
If you enjoyed the above analysis, we invite you to check out our other services. We focus on fundamental analysis in our monthly Market Overview reports and we provide daily Gold & Silver Trading Alerts with clear buy and sell signals. If you’re not ready to subscribe yet and are not on our mailing list yet, we urge you to join our gold newsletter today. It’s free and if you don’t like it, you can easily unsubscribe.
Paul Rejczak
Stock Trading Strategist
Stock Trading Alerts
