

The U.S. stock market indexes lost 2.2-2.3% on Friday, following worse-than-expected monthly jobs data release, among others. The broad stock market retraced most of its Wednesday - Thursday's rally, and it got back to medium-term upward trend line. Both, Dow Jones Industrial Average and the technology Nasdaq Composite lost 2.3% on Friday.
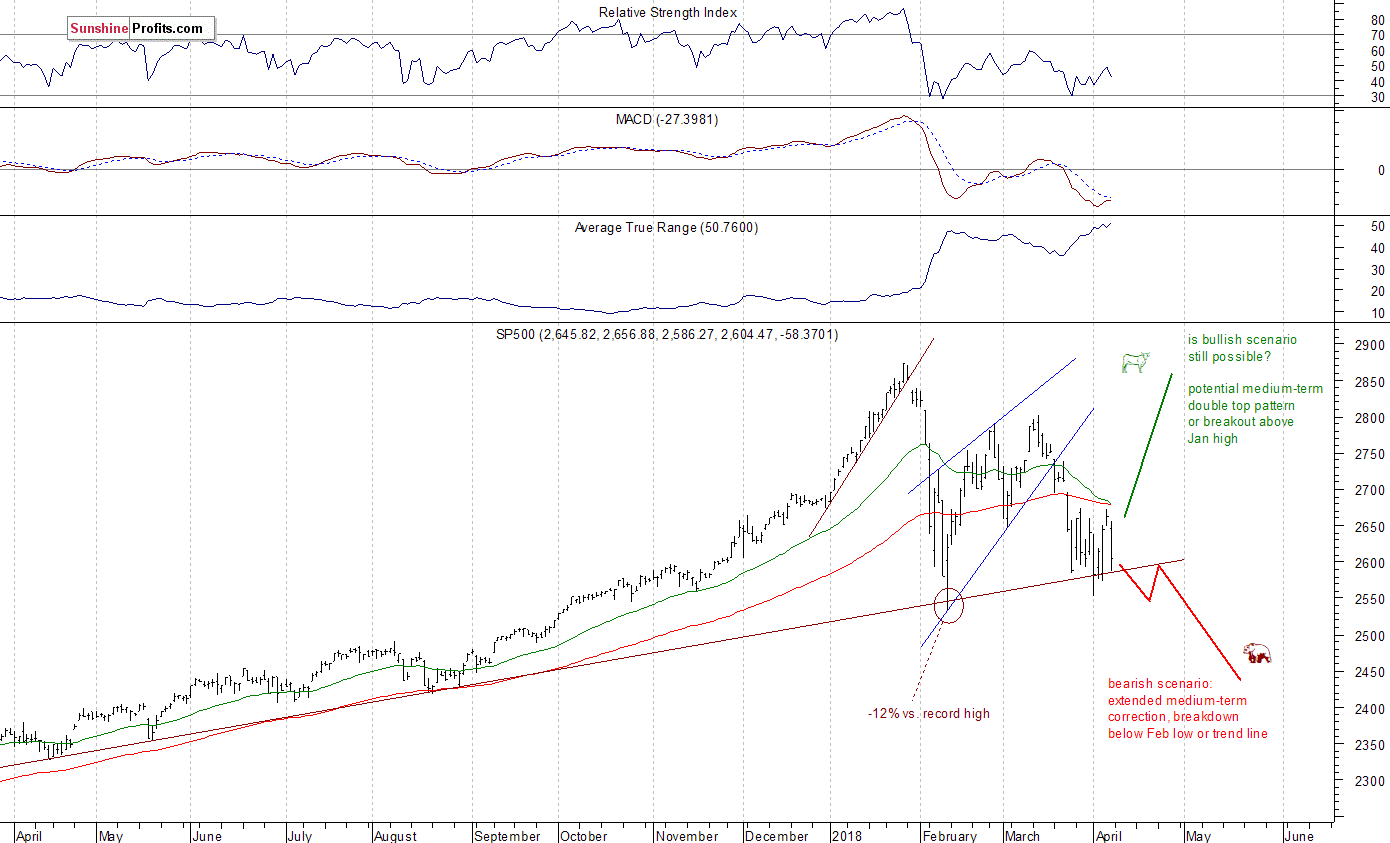
The nearest important level of resistance of the S&P 500 index is now at around 2,640-2,650, marked by recent local highs. The next resistance level is at 2,675, marked by the previous week's local high. The resistance level is also at 2,695-2,710, marked by March 22 daily gap down of 2,695.68-2,709.79. On the other hand, level of support is now at 2,585, marked by Friday's low. The next level of support is at around 2,575, marked by last week's local lows.
We can see that stocks reversed their medium-term upward course following whole retracement of January euphoria rally. Then the market bounced off its almost year-long medium-term upward trend line, and it retraced more than 61.8% of the sell-off within a few days of trading. The uptrend reversed in the middle of March, and stocks retraced almost all of their February - March rebound. The index got back down to its medium-term upward trend line. There are still two possible future scenarios. The bearish one, leading us to February low or lower after breaking below medium-term upward trend line, and bullish: medium-term double top pattern or breakout higher. Friday's sell-off made the bearish case more likely again. However, the broad stock market index continues to trade within a short-term consolidation along the above-mentioned upward trend line:
Stocks Likely to Rebound, but...
Expectations before the opening of today's trading session are positive, because the index futures contracts trade 0.6-0.8% above their Friday's closing prices. The European stock market indexes have been mixed so far. Will stocks continue higher after the open and retrace more of their Friday's move down? It's hard to say. The market remains within its two-week-long consolidation following March move down. There will be no new important economic data announcements today. Investors will wait for coming quarterly corporate earnings releases.
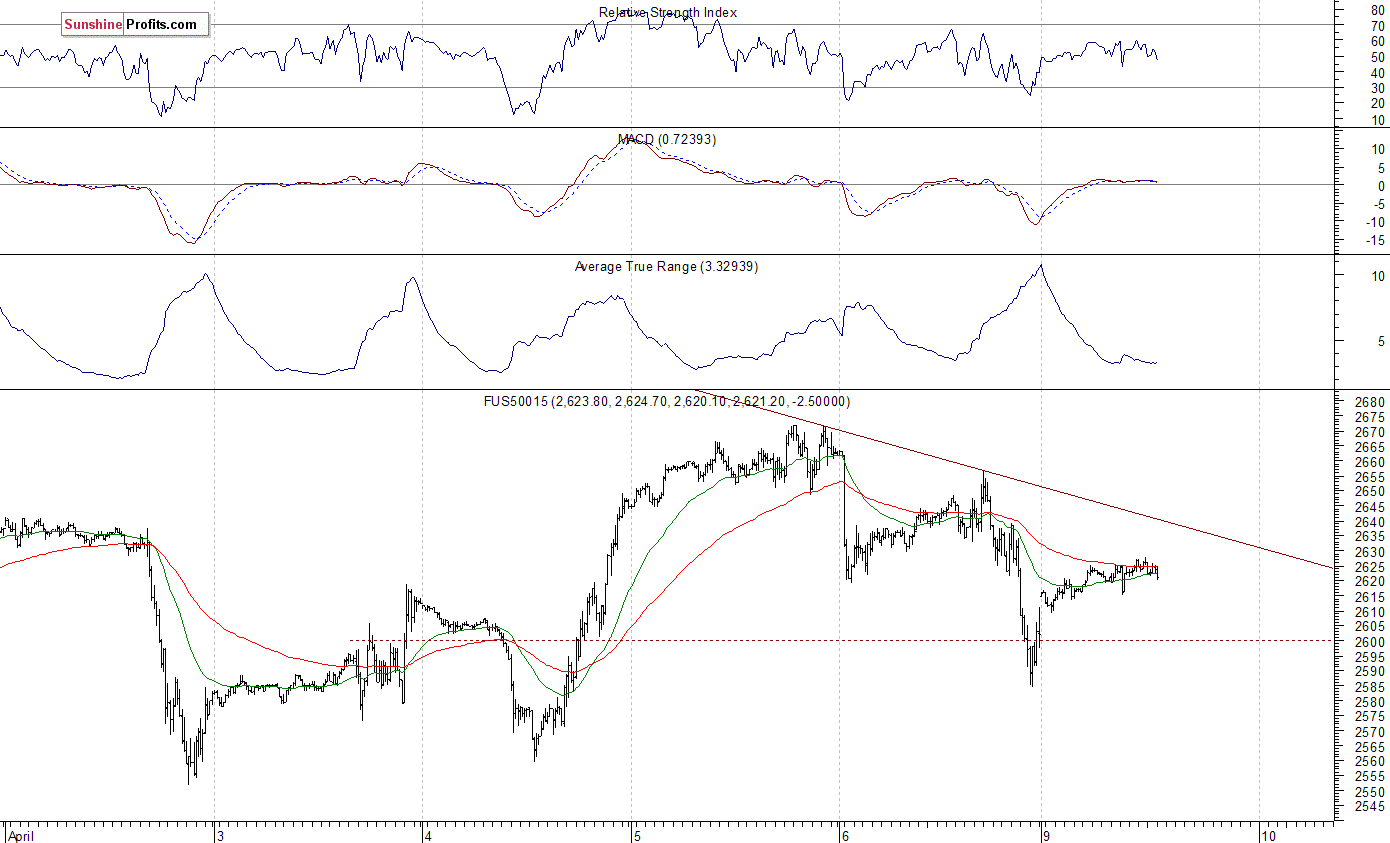
The S&P 500 futures contract trades within an intraday uptrend, as it retraces a part of its Friday's move down. The nearest important level of resistance is at around 2,640-2,655, marked by Friday's local highs. The next resistance level is at 2,670. On the other hand, support level is now at 2,585-2,600. The futures contract remains above the level of 2,600 this morning, as the 15-minute chart shows:
Nasdaq Also Higher
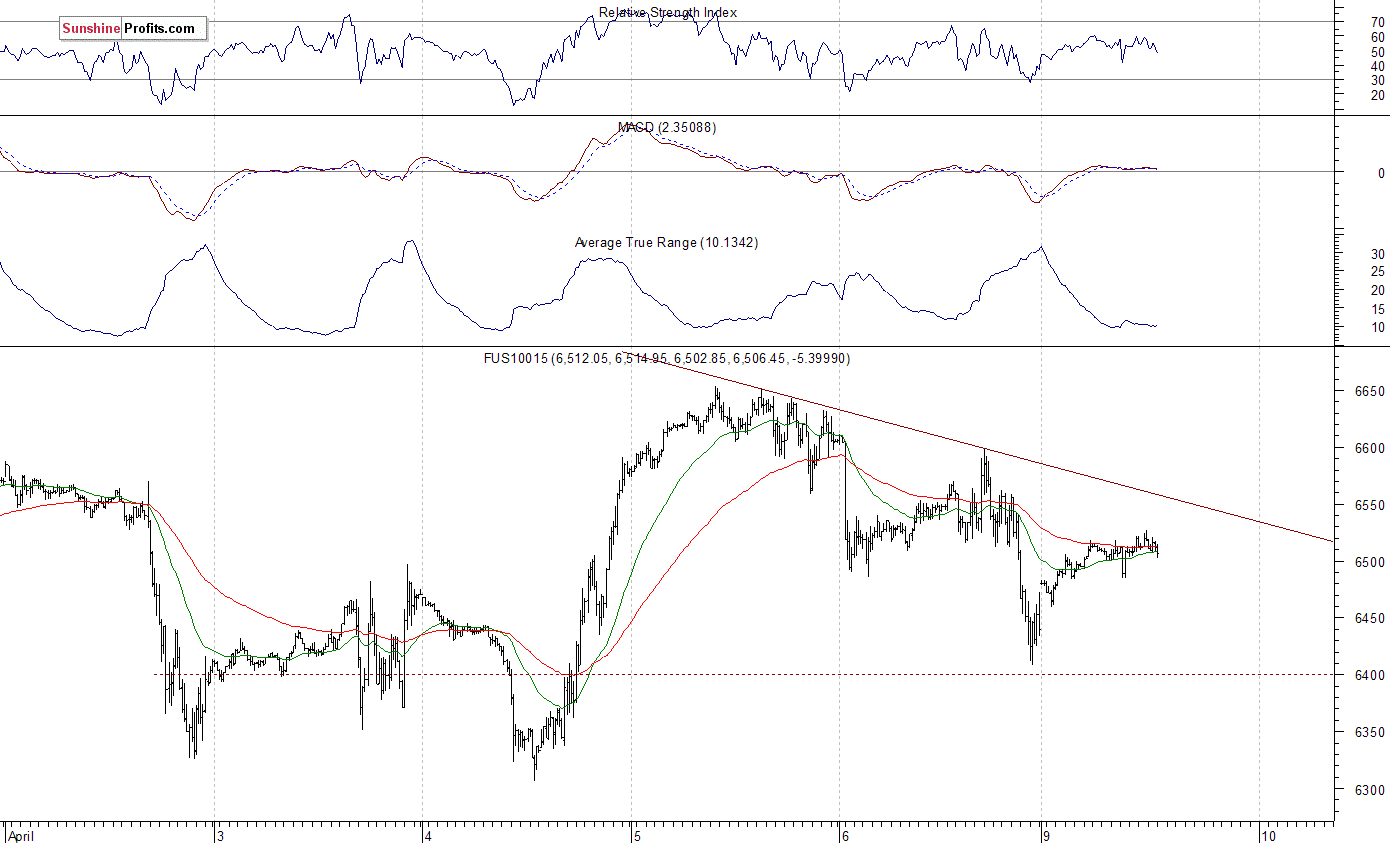
The technology Nasdaq 100 futures contract follows a similar path, as it retraces some of its Friday's decline. The market fell 250 points from its Thursday's local high of around 6,650. So, we still see an increased volatility. Is this a bottoming pattern or just pause before breaking down? It's hard to say, but bears are on the run since Thursday. The Nasdaq futures contract trades below its short-term downward trend line, as we can see on the 15-minute chart:
Apple, Amazon - Downward Reversal or Just Correction?
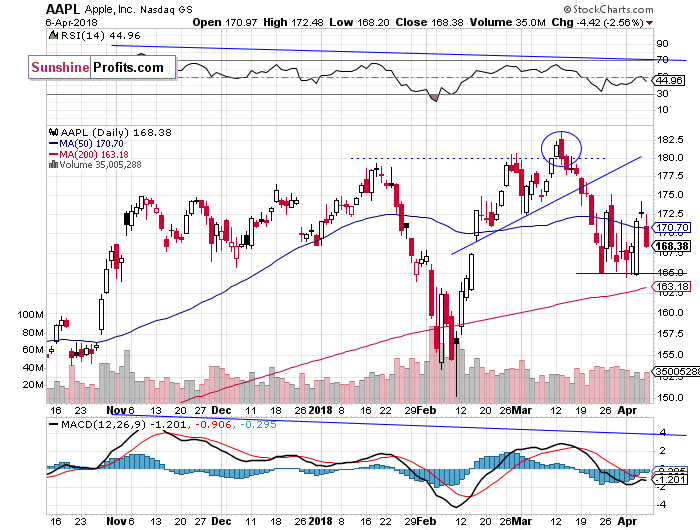
Let's take a look at Apple, Inc. stock (AAPL) daily chart (chart courtesy of http://stockcharts.com). The market extends its short-term consolidation following March move down. It continues to trade above the support level of $165, and below the resistance level of $170-$175. Is this some bottoming pattern before upward reversal? If the market breaks higher, it could retrace more of March sell-off and get close to record high again:
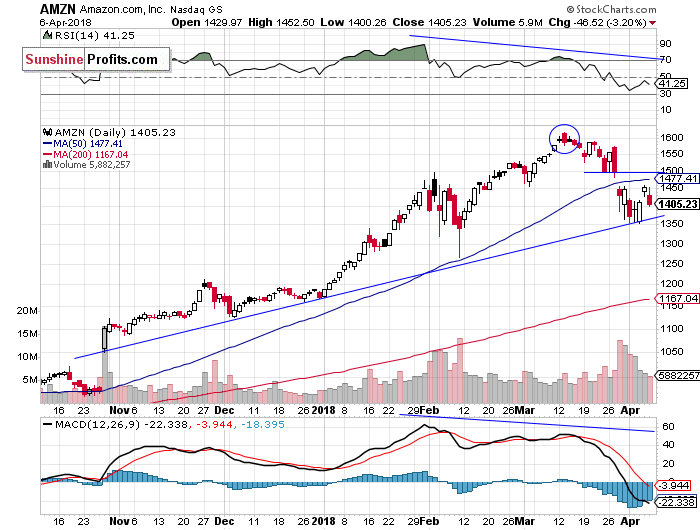
Now let's take a look at Amazon.com, Inc. (AMZN) daily chart. The price bounced off its medium-term upward trend line on Wednesday and continued higher on Thursday. It reversed its upward course on Friday following a bounce off resistance level, marked by late March daily gap down. So, there was a selling pressure at $1,450-1,500. The nearest important support level is at around $1,400. The support level is also at $1,350, marked by the above-mentioned trend line:
Dow Jones Below 24,000 Again
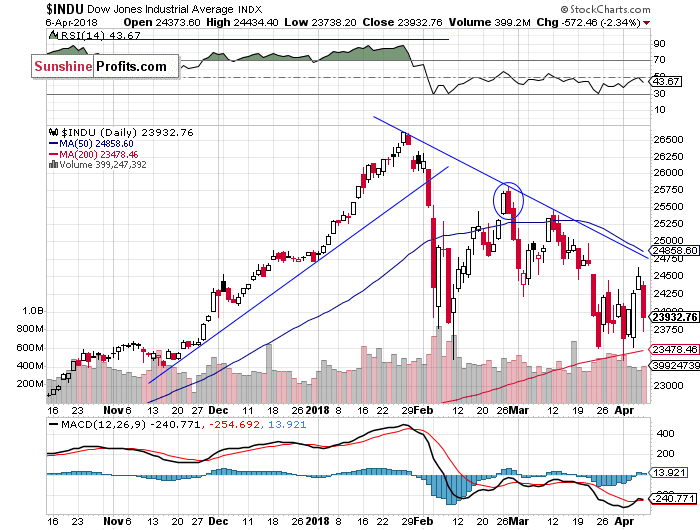
The Dow Jones Industrial Average formed a positive "Harami" candlestick pattern on Tuesday. Then, the market confirmed this reversal pattern despite lower opening of Wednesday's trading session. DJIA continued higher on Thursday, as it broke above its two-week-long trading range but it reversed its short-term uptrend on Friday. Will it come down to recent lows and the support level of 23,500? Or is this just downward correction before another leg higher? For now, it looks like a downward correction because the above-mentioned upward reversal pattern is still valid:
Concluding, the S&P 500 index is expected to open higher today, as investors' sentiment improved after Friday's sell-off. However, there are ongoing trade war fears, and we may see some more short-term volatility. On the other hand, coming quarterly corporate earnings releases are potentially positive for the market.
The early March rally failed to continue following monetary policy tightening, trade war fears, negative political news. What was just profit-taking action, quickly became a meaningful downward reversal. Breakdown below over-month-long rising wedge pattern made medium-term bearish case more likely, and after some quick consolidation, the index accelerated lower, towards its early February low. Just like we wrote in our several Stocks Trading Alerts, the early February sell-off set the negative tone for weeks or months to come.
If you enjoyed the above analysis and would like to receive free follow-ups, we encourage you to sign up for our daily newsletter – it’s free and if you don’t like it, you can unsubscribe with just 2 clicks. If you sign up today, you’ll also get 7 days of free access to our premium daily Gold & Silver Trading Alerts. Sign up today!
Thank you.
Paul Rejczak
Stock Trading Strategist
Stock Trading Alerts
Sunshine Profits - Free Stock Market Analysis
