

Stock Trading Alert originally sent to subscribers on June 2, 2016, 6:46 AM.
Briefly: In our opinion, speculative short positions are favored (with stop-loss at 2,140, and profit target at 2,000, S&P 500 index).
Our intraday outlook is bearish, and our short-term outlook is bearish. Our medium-term outlook remains bearish, as the S&P 500 index extends its lower highs, lower lows sequence:
Intraday outlook (next 24 hours): bearish
Short-term outlook (next 1-2 weeks): bearish
Medium-term outlook (next 1-3 months): bearish
Long-term outlook (next year): neutral
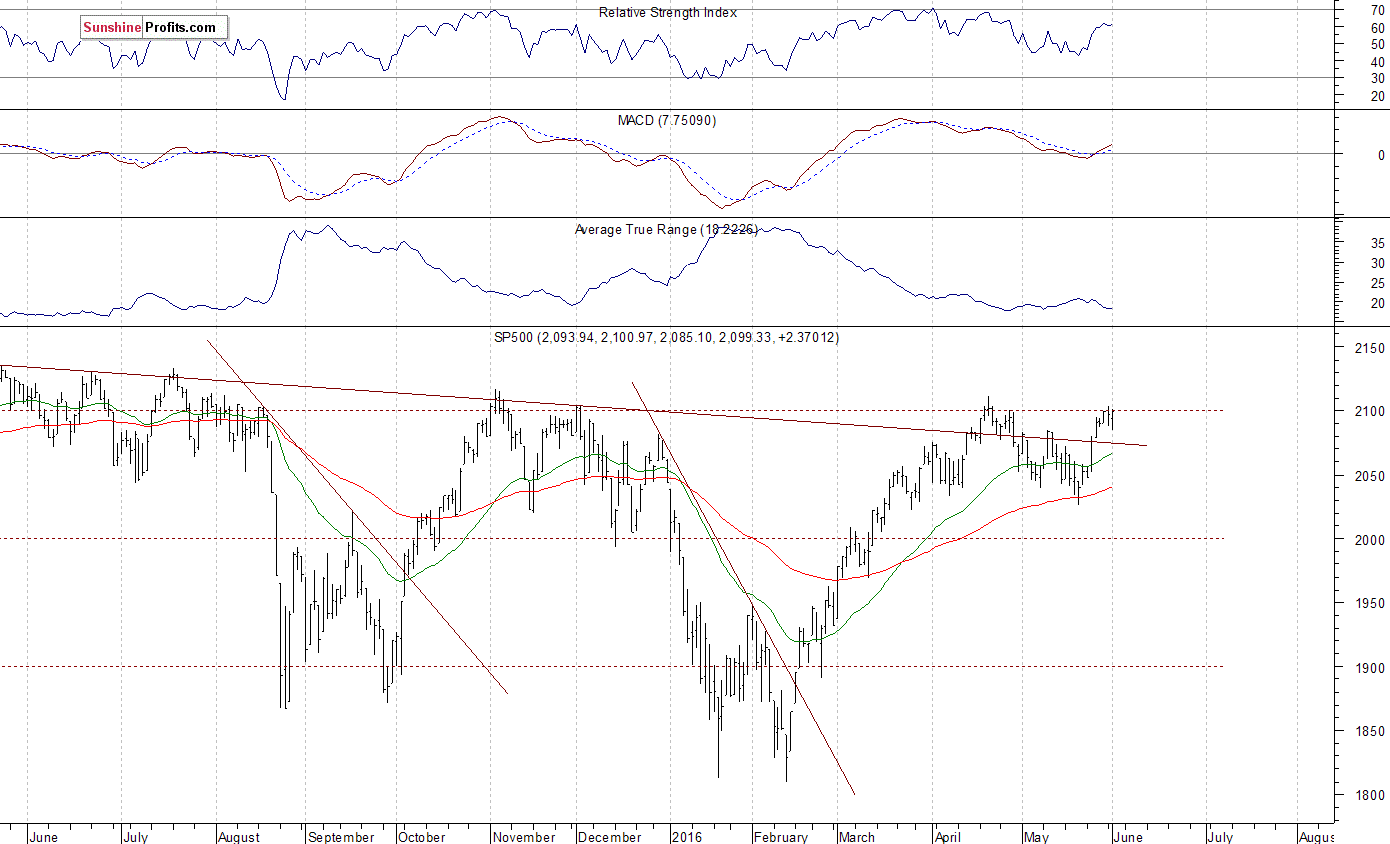
The U.S. stock market indexes were virtually flat on Wednesday, extending their short-term uncertainty, as investors awaited economic data releases. The S&P 500 index continues to trade close to resistance level of 2,100. The next important resistance level is at 2,110-2,115, marked by April's local high of 2,111.05, among others. On the other hand, support level is at 2,070-2,085, marked by previous level of resistance. The next important level of support is at 2,030-2,050. Last year's highs along the level of 2,100 continue to act as medium-term resistance level. Will the market break above these medium-term highs and continue its seven-year long bull market?
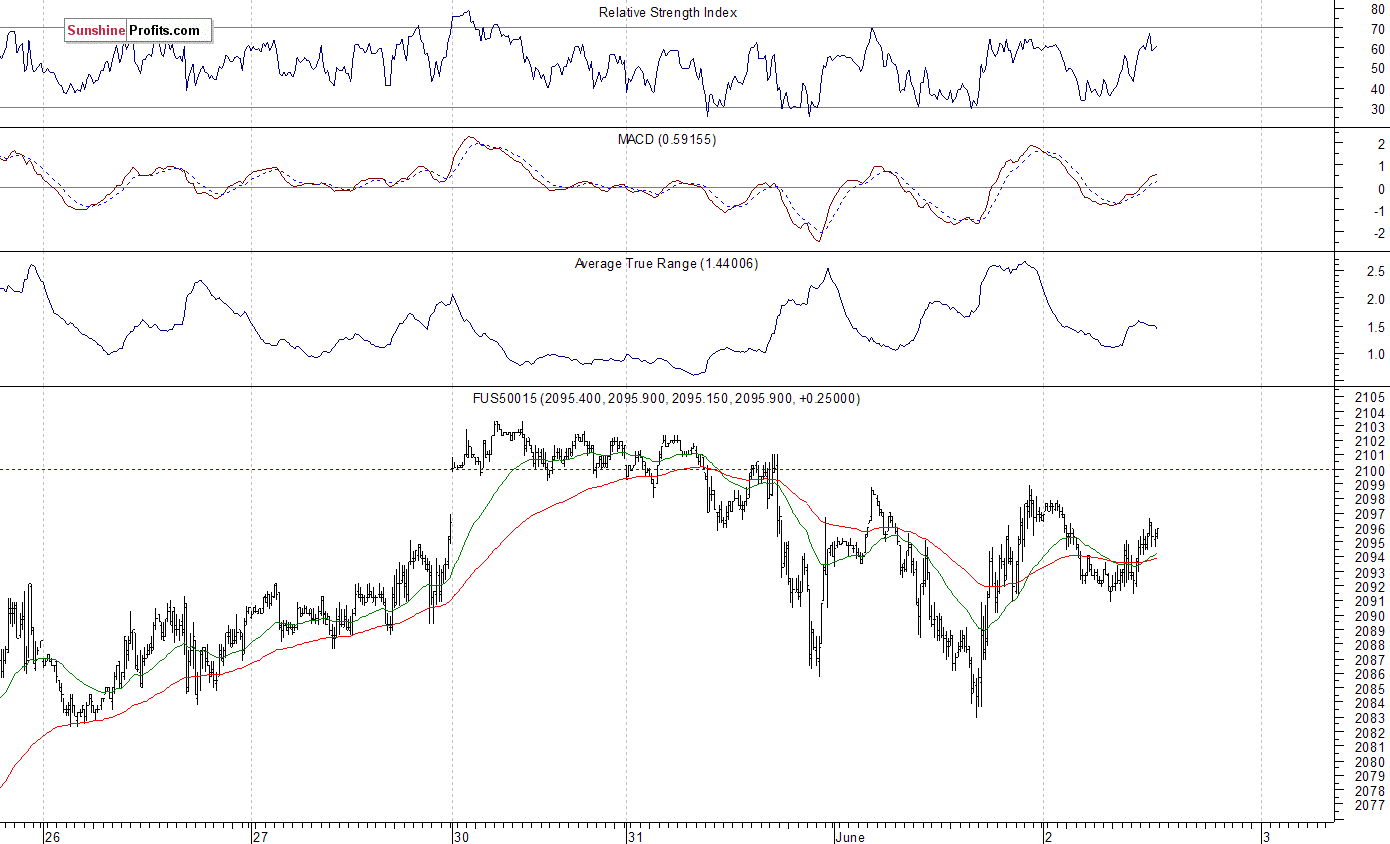
Expectations before the opening of today's trading session are slightly negative, with index futures currently down 0.1%. The main European stock market indexes have gained 0.1-0.3% so far. Investors will now wait for some economic data announcements: ADP Employment Change number at 8:15 a.m., Initial Claims at 8:30 a.m., Crude Inventories at 10:30 a.m. The S&P 500 futures contract trades within an intraday consolidation. It continues to fluctuate following last week's rally. The nearest important level of resistance remains at around 2,100-2,105, marked by short-term local highs. On the other hand, support level is at 2,080-2,085, among others. For now, it looks like a flat correction within a short-term uptrend. However, the market may form a short-term reversal pattern:
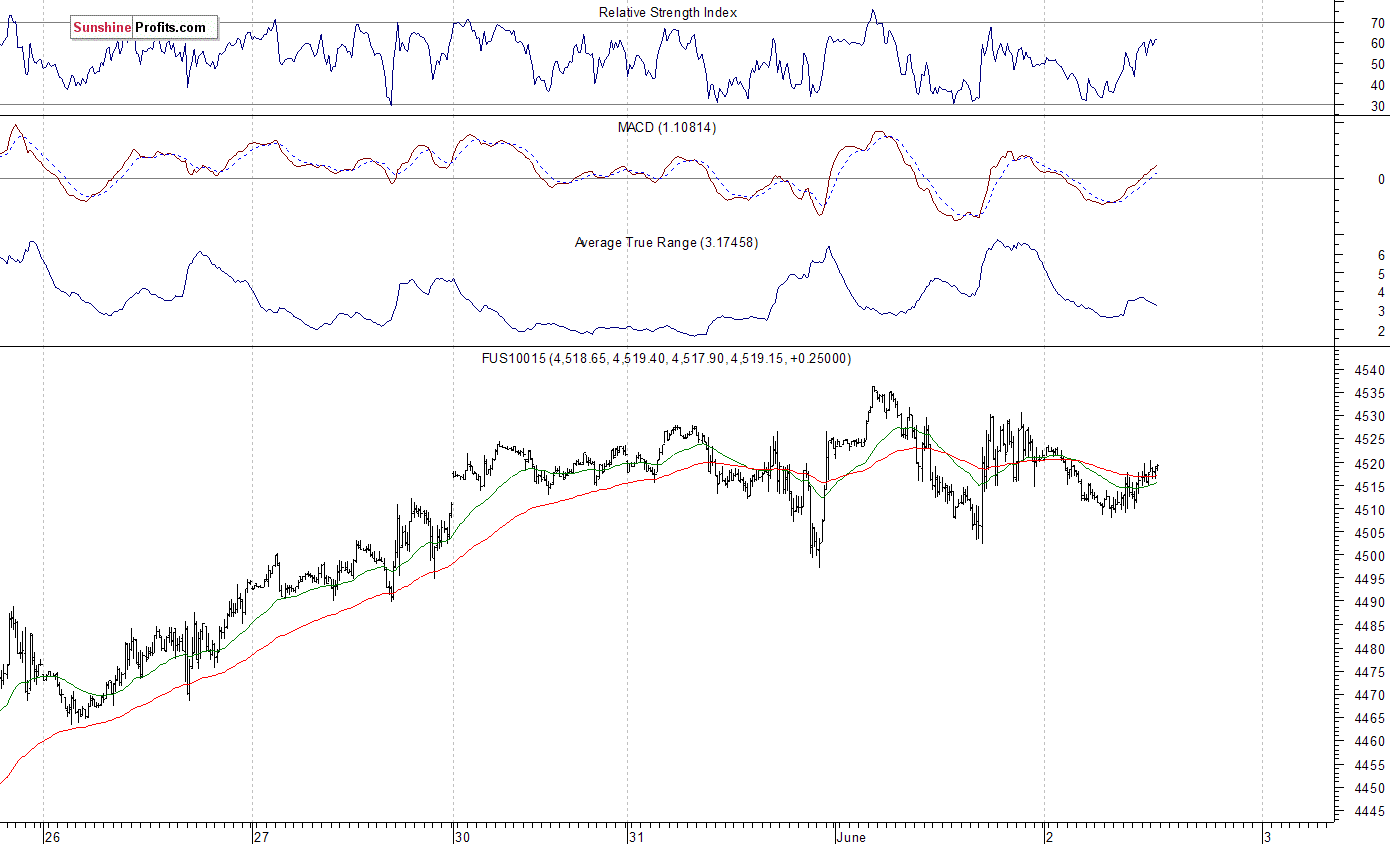
The technology Nasdaq 100 futures contract follows a similar path, as it extends its recent fluctuations following last week's advance. The nearest important level of support remains at 4,500, marked by local lows. On the other hand, resistance level is at 4,530-4,540. Will it break above and continue towards late last year's long-term highs above the level of 4,700?
Concluding, the broad stock market fluctuated within a short-term consolidation on Wednesday, as the S&P 500 index remained close to resistance level of 2,100. We can see technical overbought conditions that may lead to uptrend's reversal or downward correction. Therefore, we continue to maintain our speculative short (opened at 2,093.94 - yesterday's opening price of the S&P 500 index). Stop-loss level is at 2,140 and potential profit target is at 2,000 (S&P 500 index). You can trade S&P 500 index using futures contracts (S&P 500 futures contract - SP, E-mini S&P 500 futures contract - ES) or an ETF like the SPDR S&P 500 ETF - SPY. It is always important to set some exit price level in case some events cause the price to move in the unlikely direction. Having safety measures in place helps limit potential losses while letting the gains grow.
Thank you.
Paul Rejczak
Stock Trading Strategist
Stock Trading Alerts
