
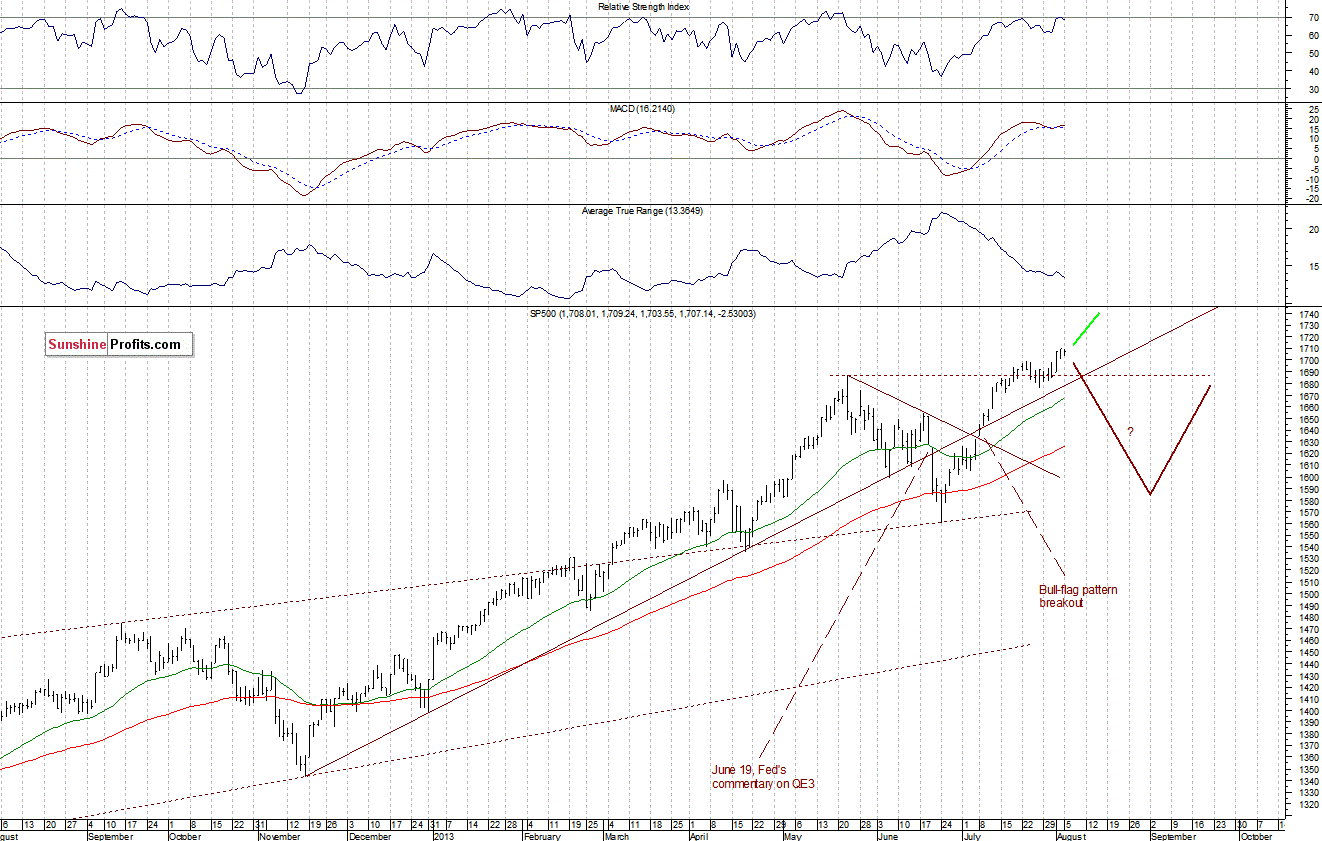
The main U.S stock market indexes were mixed yesterday as investors took profits after the recent rally to new all-time highs. The S&P500 index fluctuates in a relatively tight range, just below the new all-time high of 1709.67 which was set on Friday. The nearest psychological level of support is at 1,700. If the S&P500 were to drop through the late July consolidation at around 1,675-1,690, it would be a negative signal. For now, it looks like a flat correction within an uptrend, as we can see on the daily chart:
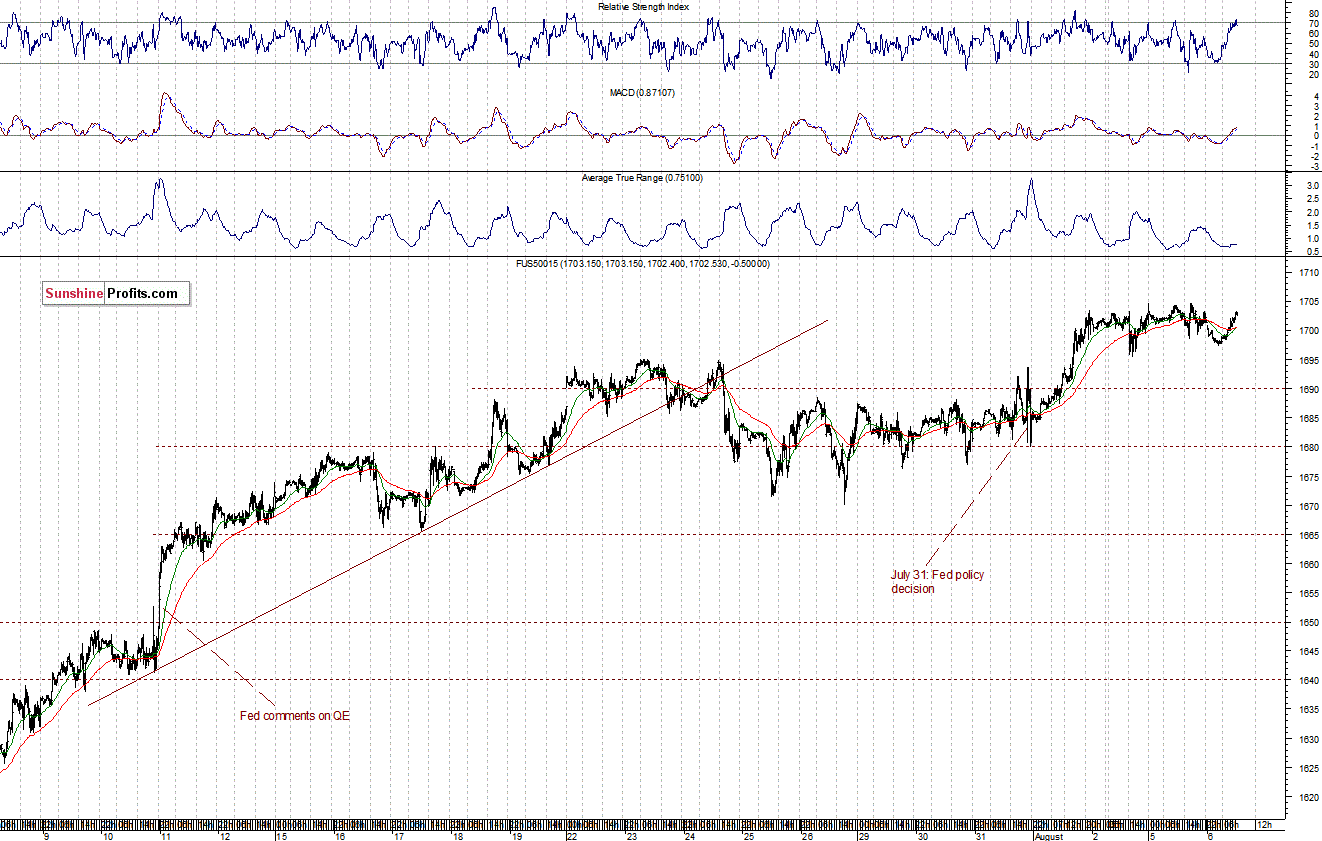
Investors will wait for the U.S. Trade Balance announcement for the month of June at 8:30 a.m., but it is not expected to have a great impact on the market sentiment. Expectations before the opening of today’s session are virtually flat, as the major European stock market indexes have gained 0.1-0.3%. In the short-term the S&P500 futures contract (CFD) continues to consolidate in a range between 1,695 and 1,705. It is a flat correction of the recent uptrend. The potential support is at around 1,680-1,690, marked by the previous consolidation, as the 15-minute chart shows:
Thank you,
Paul Rejczak
