

The U.S. stock market indexes gained 0.9-1.3% on Wednesday, as they retraced their Tuesday's decline. The S&P 500 index got back to the previous local highs again. The broad stock market's gauge is now 3.0% below July the 26th record high of 3,027.98. The Dow Jones Industrial Average gained 0.9% and the Nasdaq Composite gained 1.3% on Wednesday.
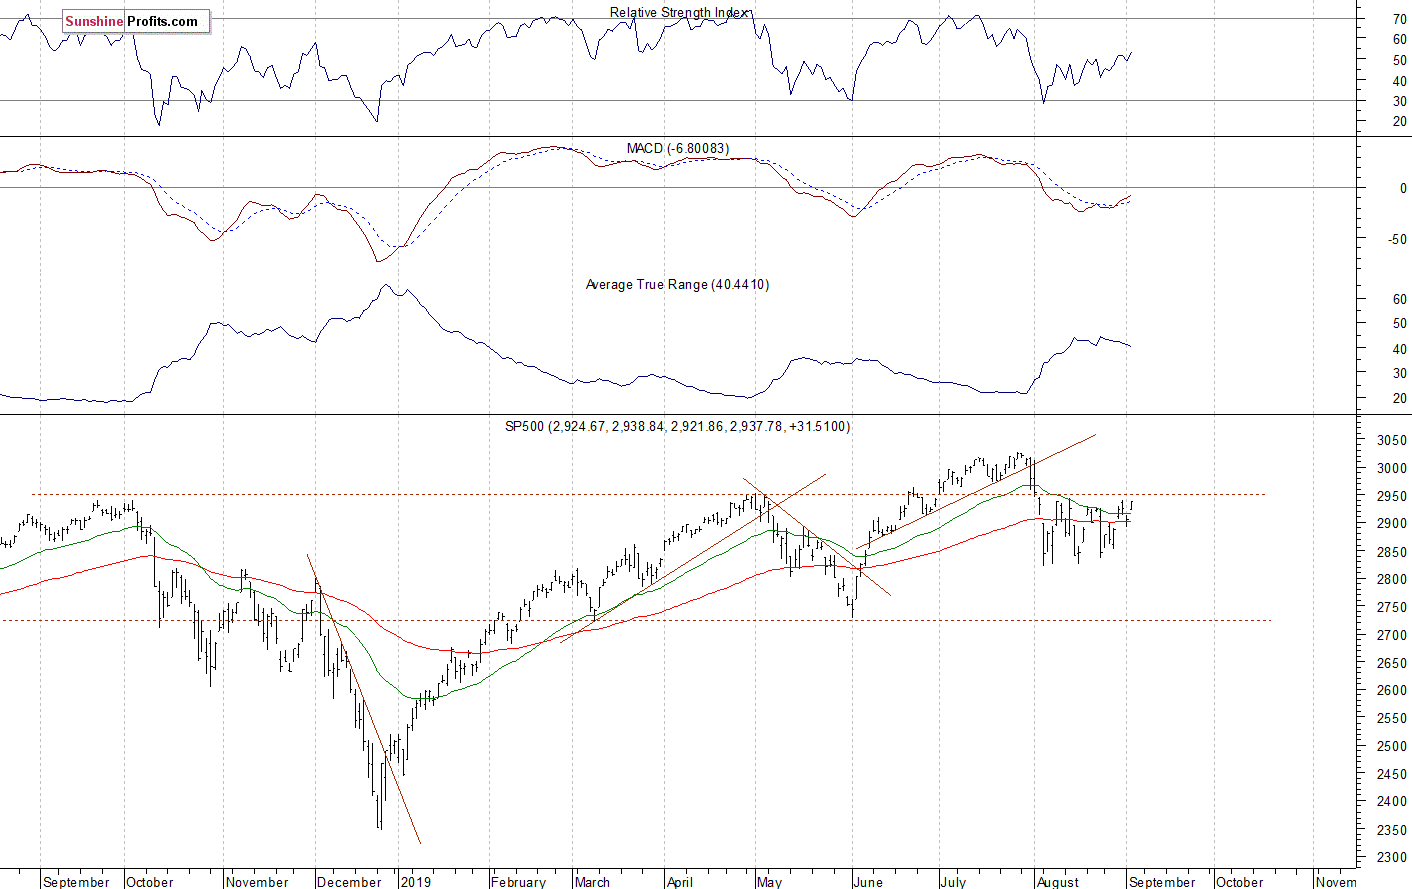
The nearest important resistance level of the S&P 500 index is at 2,940-2,950, marked by the previous local highs. The resistance level is also at 2,980-3,000. On the other hand, the support level is at 2,915-2,920, marked by yesterday's daily gap up of 2,914.39-2,921.86. The support level is also at 2,890-2,905, marked by last Thursday's daily gap up of 2,890.03-2,905.67.
The broad stock market broke below its two-month-long upward trend line in early August, and then it quickly retraced most of the June-July advance. The S&P 500 index continues to trade within a consolidation following its early August decline:
Stocks Breaking Higher?
The index futures contracts trade between 0.9-1.1% above their Wednesday's closing prices. So expectations before the opening of today's trading session are positive. The European stock market indexes have been mixed so far. Investors will wait for series of economic data releases today: ADP Non-Farm Employment Change number at 8:15 a.m., Nonfarm Productivity, Unemployment Claims at 8:30 a.m., ISM Non-Manufacturing PMI, Factory Orders at 10:00 a.m., Crude Oil Inventories at 11:00 a.m.
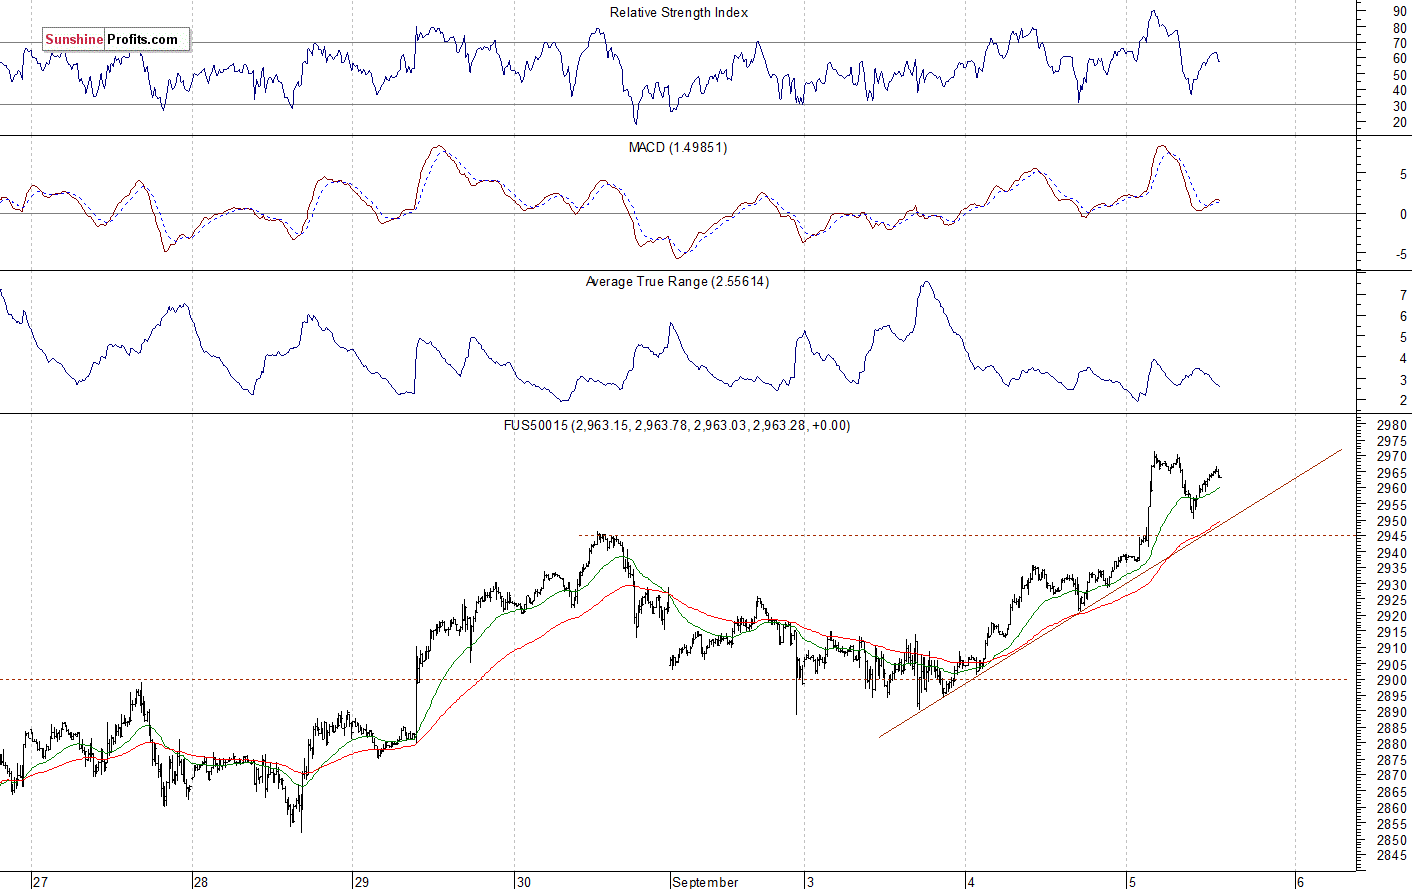
The S&P 500 futures contract trades within an intraday consolidation following overnight rally. The nearest important resistance level is at around 2,970. On the other hand, the support level is at 2,930-2,935, marked by the recent resistance level. The futures contract is now above its last week's local high, as we can see on the 15-minute chart:
Nasdaq 100 Above 7,800 Mark
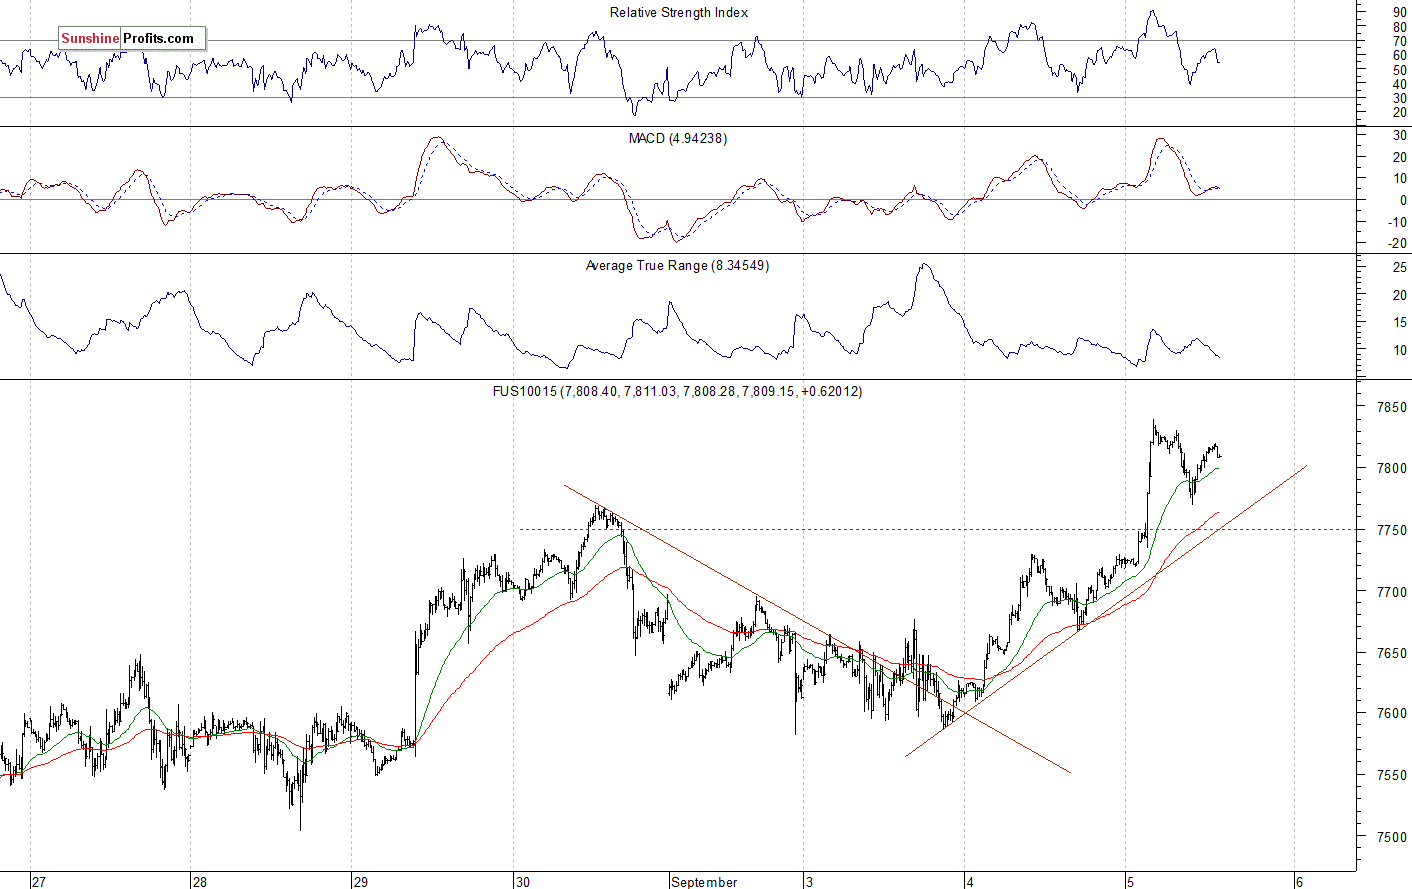
The technology Nasdaq 100 futures contract follows a similar path, as it trades within an intraday consolidation after breaking above the recent trading range. The support level is now at 7,750-7,800. The Nasdaq futures contract fluctuates along the 7,800 mark this morning, as the 15-minute chart shows:
Big Cap Tech Stocks - No Clear Short-Term Direction
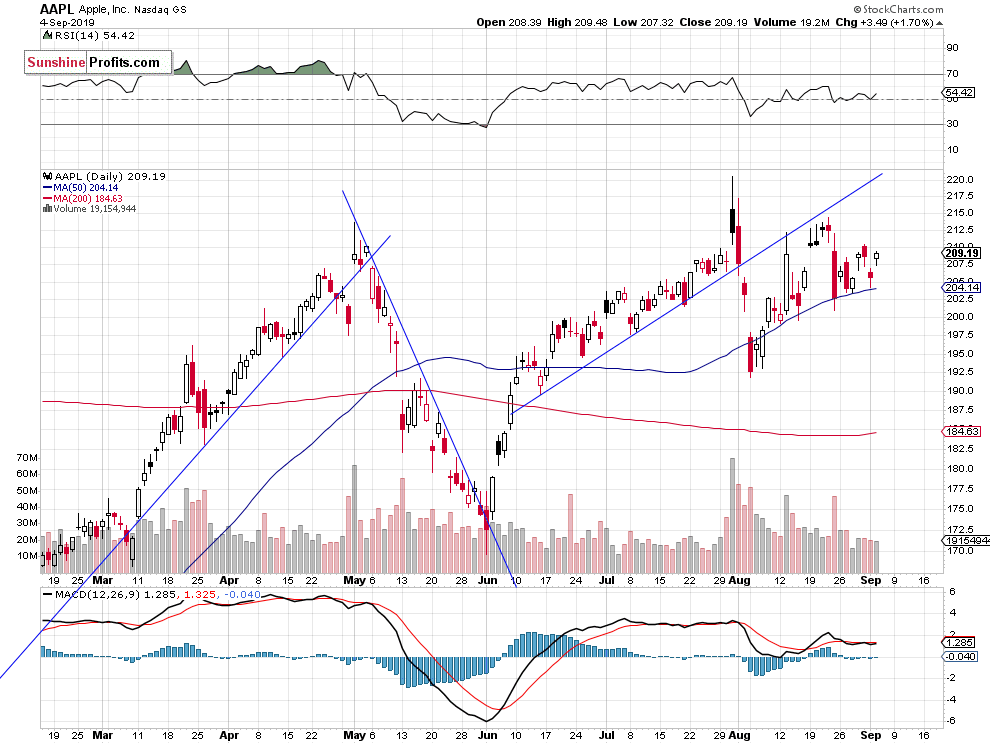
Let's take a look at the Apple, Inc. stock (AAPL) daily chart (chart courtesy of http://stockcharts.com). The stock reversed its recent upward course recently, as it fell closer to the $200 price again. But then it kept bouncing off that support level. The market may extend volatile fluctuations following the early August breakdown below its two-month-long upward trend line:
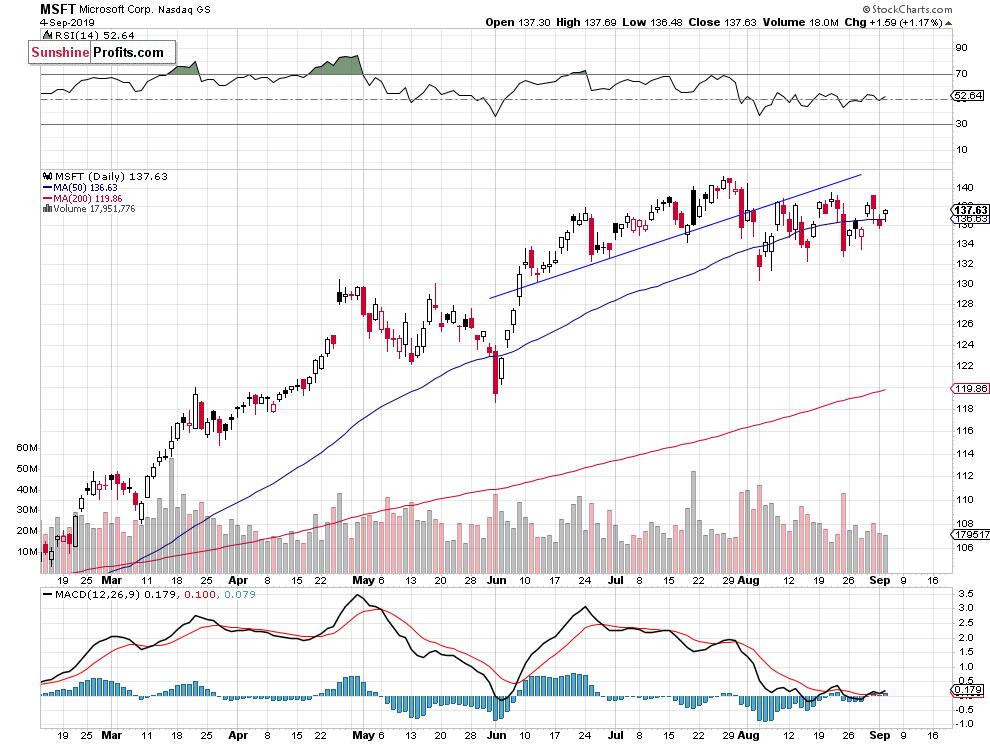
Now let's take a look at the daily chart of Microsoft Corp. stock (MSFT). The stock got back to it short term local highs on Friday. It still looks like a consolidation within a medium-term uptrend:
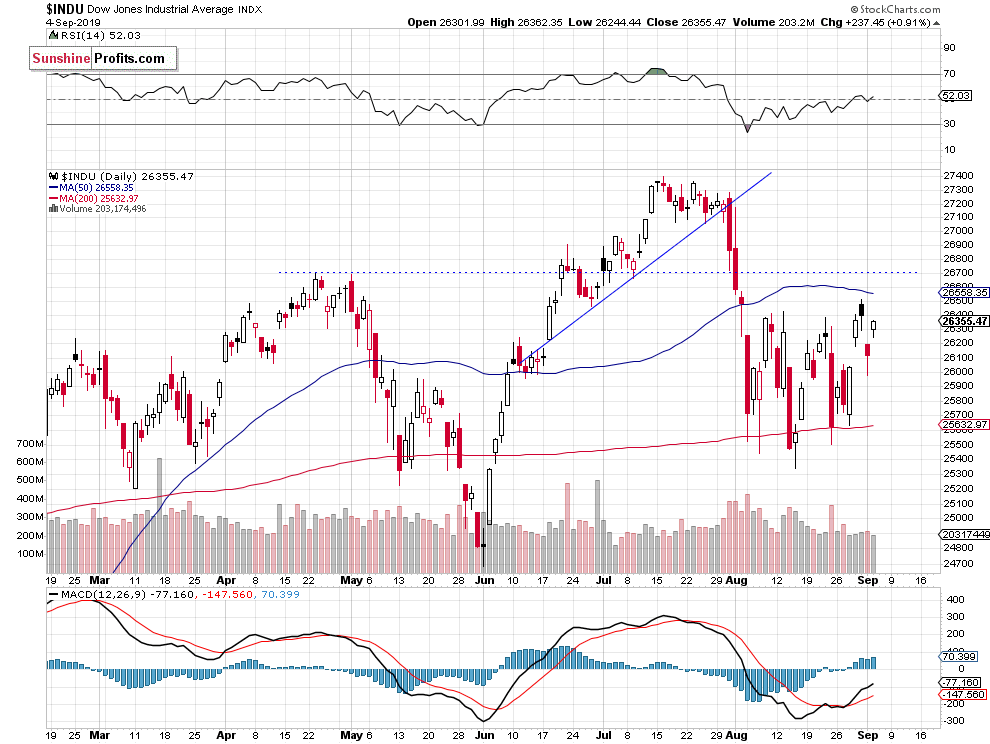
Dow Jones Remains Below Resistance Level
The Dow Jones Industrial Average broke below its upward trend line in late July. Then it fell to around 25,500, before bouncing off the 200-day moving average. It kept bouncing off that support level last month. On Friday the blue-chip stocks' gauge was the highest since the early August. But then it got back lower again. We may see some more uncertainty and sideways trading action below the resistance level of 26,500-26,700:
The S&P 500 index broke below the upward trend line in late July, as investors reacted to the Fed's Rate Decision release, among other factors. Then the market declined following renewed trade war fears. Last month, the index fluctuated after rebounding off the support level of 2,800-2,820. Today we may see an attempt at breaking above its recent local highs.
Concluding, the S&P 500 index will likely open higher today. We may see an attempt at breaking higher. However, investors will wait for today's series of economic data announcements and Friday's monthly jobs data release.
If you enjoyed the above analysis and would like to receive free follow-ups, we encourage you to sign up for our daily newsletter - it's free and if you don't like it, you can unsubscribe with just 2 clicks. If you sign up today, you'll also get 7 days of free access to our premium daily Gold & Silver Trading Alerts. Sign up today!
Thank you.
Paul Rejczak
Stock Trading Strategist
Sunshine Profits - Effective Investments through Diligence and Care
