

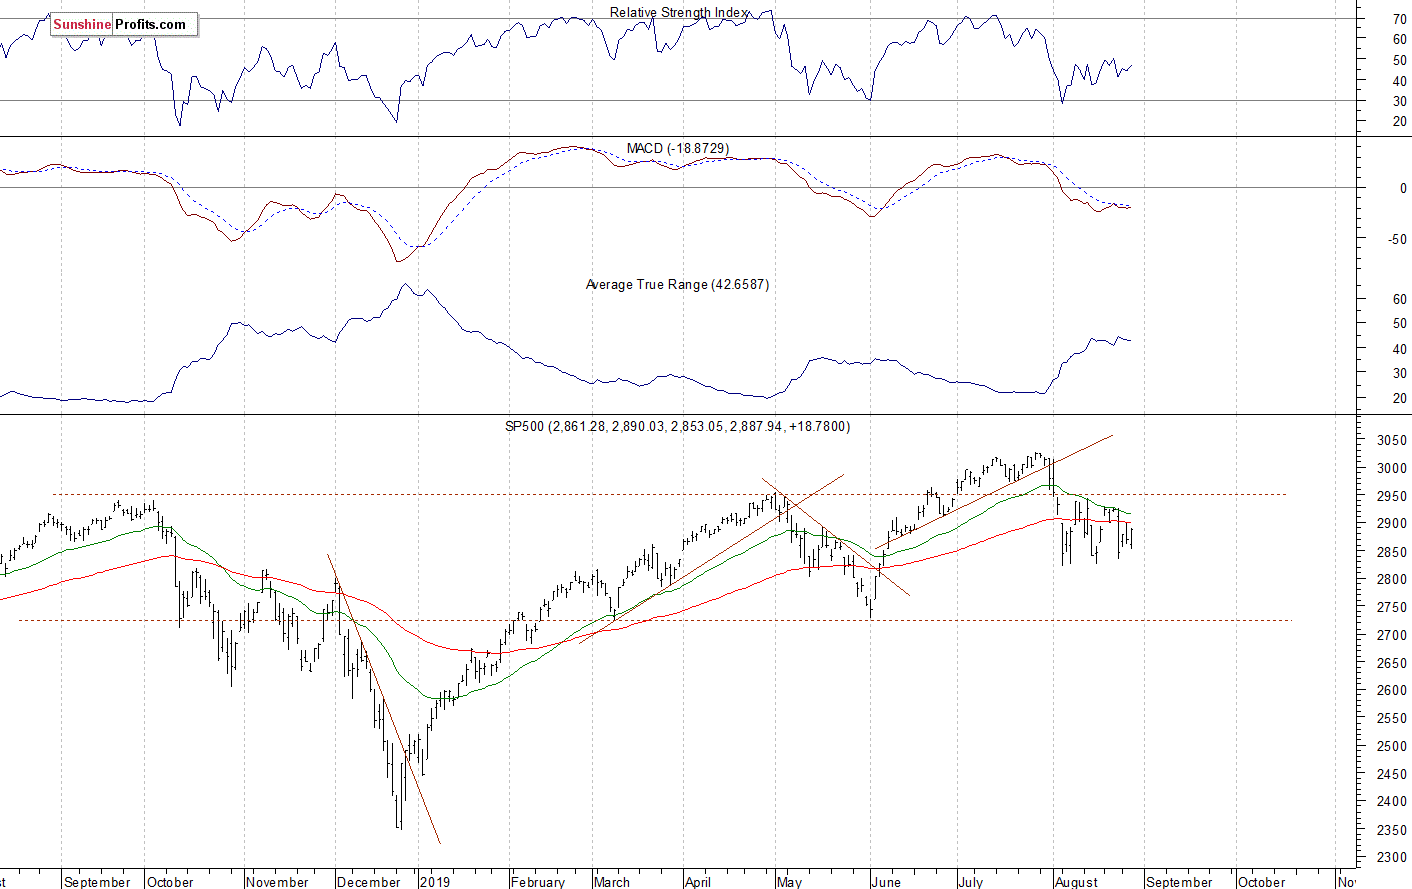
Wednesday's trading session didn't change much. Stocks extended their short-term consolidation following Monday's rebound off a support level. The S&P 500 index continues to trade within a four-week-long consolidation after the early August decline. Was Monday's advance an upward reversal or just upward correction before another leg down?
The U.S. stock market indexes gained 0.4-1.0% on Wednesday, as they retraced their Tuesday's decline. The S&P 500 index got back to the short-term local lows on Friday and then it bounced off that support level. The broad stock market's gauge is now 4.7% below July the 26th record high of 3,027.98. The Dow Jones Industrial Average gained 1.0% and the Nasdaq Composite gained 0.4% on Wednesday.
The nearest important resistance level of the S&P 500 index is at 2,900-2,920, marked by the recent local highs. On the other hand, the support level is at 2,850-2,860. The next support level is at 2,820-2,825, marked by the previous lows.
The broad stock market broke below its two-month-long upward trend line in early August, and then it quickly retraced most of the June-July advance. The S&P 500 index continues to trade within a consolidation following early August decline:
Positive Expectations, Upward Reversal?
The index futures contracts trade 1.1-1.3% above their Wednesday's closing prices. So expectations before the opening of today's trading session are bullish. The European stock market indexes have gained 1.1-1.5% so far. Investors will wait for some economic data releases this morning: Preliminary GDP number, Unemployment Claims at 8:20 a.m., Pending Home Sales at 10:00 p.m.
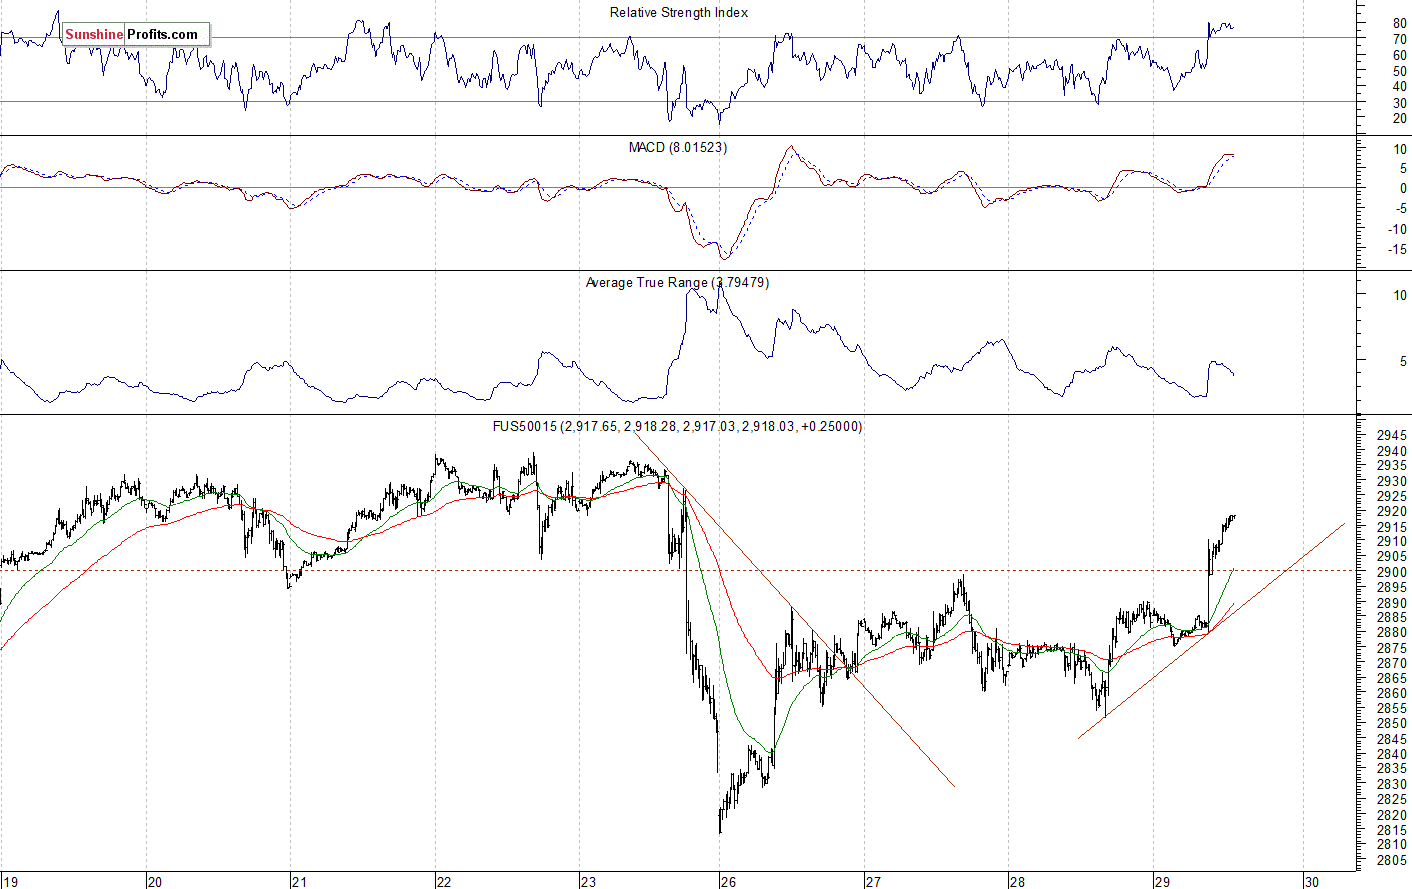
The S&P 500 futures contract trades within an intraday uptrend, as it extends its overnight breakout above the recent local highs. The nearest important resistance level is now at 2.920-2,940. On the other hand, the support level is at 2,880-2,900. The futures contract is back within its last week's consolidation, as we can see on the 15-minute chart:
Nasdaq 100 Also Higher
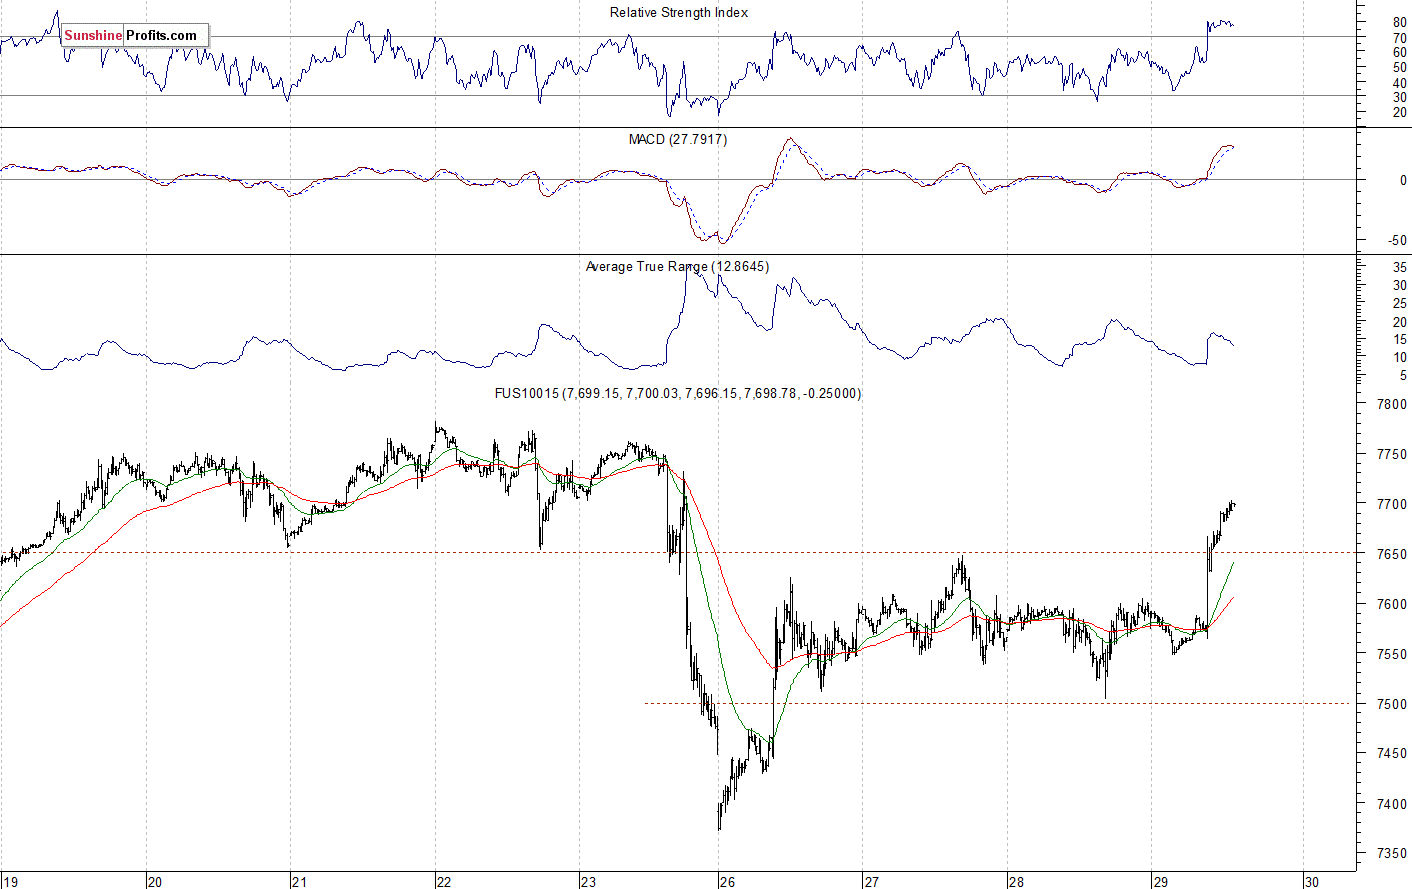
The technology Nasdaq 100 futures contract follows a similar path, as it trades within an intraday uptrend. It bounced off a support level of 7,350-7,400 recently. And this morning it broke above the resistance level of 7,600-7,650. The Nasdaq futures contract is the highest since last Friday, as the 15-minute chart shows:
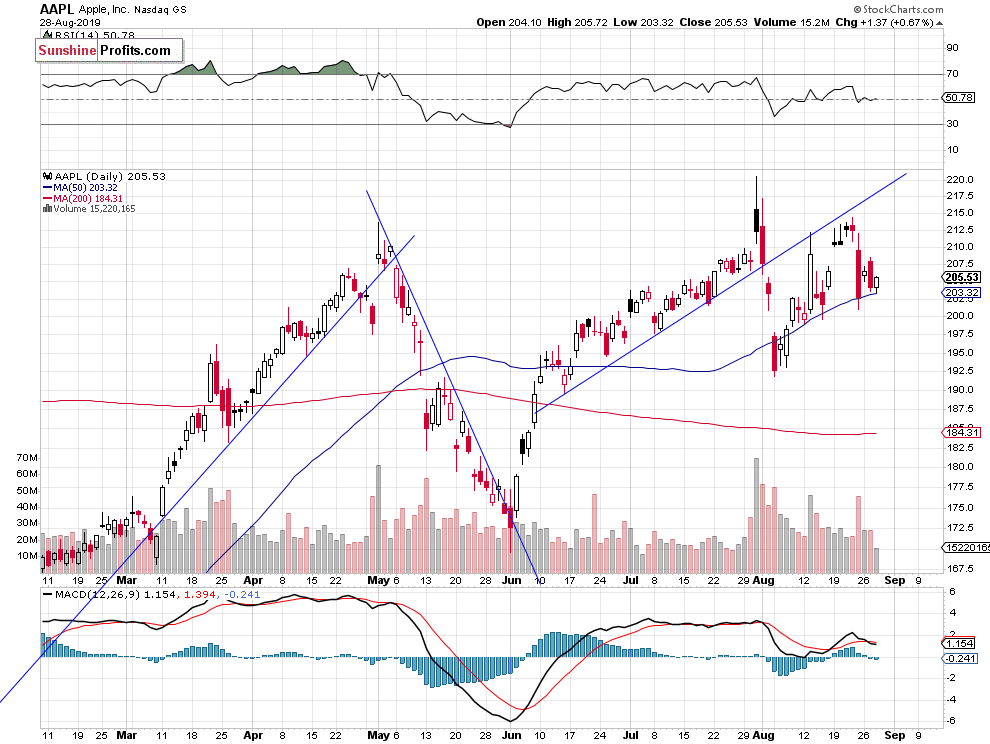
Big Cap Tech Stocks - Still No Clear Direction
Let's take a look at the Apple, Inc. stock (AAPL) daily chart (chart courtesy of http://stockcharts.com). The stock sharply reversed its recent upward course on Friday, as it fell closer to the $200 price again. On Monday it bounced off that support level. The market may extend volatile fluctuations following the early August breakdown below its two-month-long upward trend line:
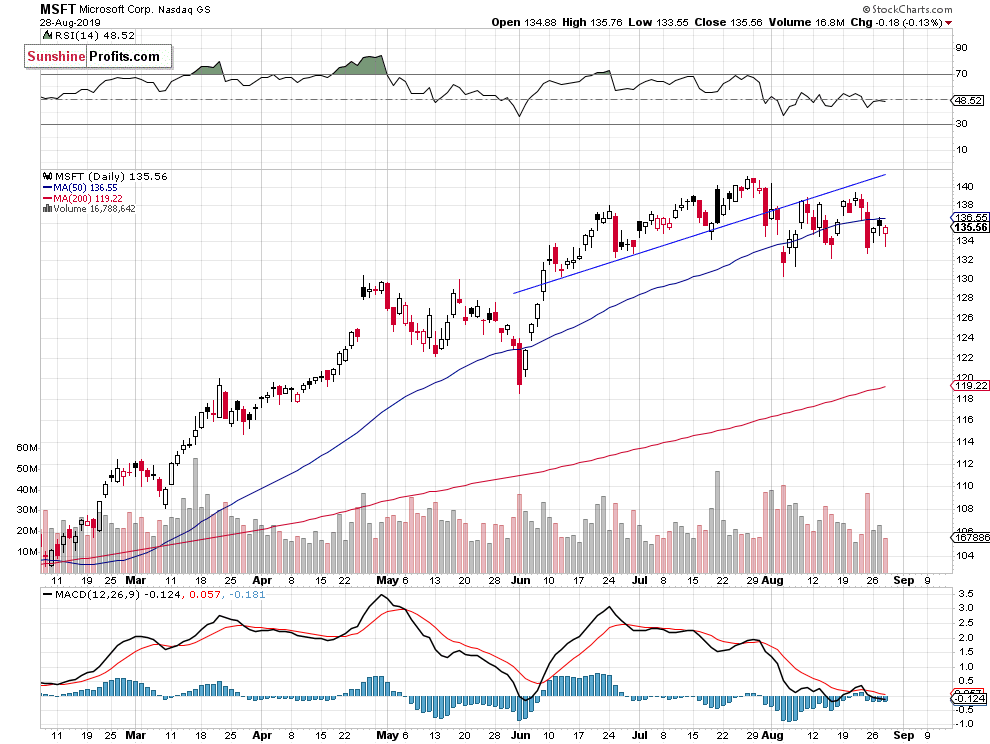
Now let's take a look at the daily chart of Microsoft Corp. stock (MSFT). The stock retraced most of its recent advance on Friday, as it fell to a support level of $130-135 again. It still looks like a consolidation within a medium-term uptrend:
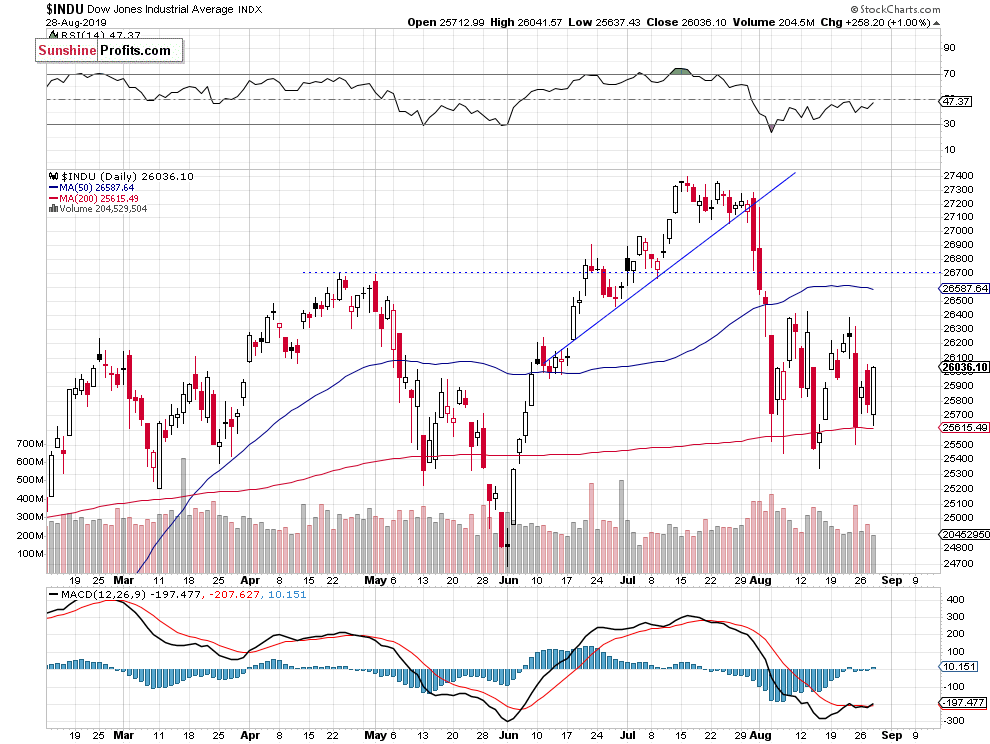
Dow Jones Above 26,000 Again
The Dow Jones Industrial Average broke below its upward trend line in late July. Then it fell to around 25,500, before bouncing off the 200-day moving average. It kept bouncing off that support level recently. On Friday the Dow fell to its average, but then it bounced towards the 26,000 level again:
The S&P 500 index broke below the upward trend line in late July, as investors reacted to the Fed's Rate Decision release, among other factors. We saw technical overbought conditions along with negative technical divergences then. And the market declined following renewed trade war fears. Recently it has been rebounding off a support level of around 2,800-2,820. On Friday it reached that support level again. Today we may see a breakout above the short-term local highs. There will likely be another attempt at breaking above this month's local highs.
Concluding, the S&P 500 index will likely open higher today. The market may get close to the recent local highs again. However, we may see some more sideways trading action there.
If you enjoyed the above analysis and would like to receive free follow-ups, we encourage you to sign up for our daily newsletter - it's free and if you don't like it, you can unsubscribe with just 2 clicks. If you sign up today, you'll also get 7 days of free access to our premium daily Gold & Silver Trading Alerts. Sign up today!
Thank you.
Paul Rejczak
Stock Trading Strategist
Sunshine Profits - Effective Investments through Diligence and Care
