

Most of technical analysis that one can read about gold and gold stocks is based on these markets alone. This is quite strange given the multitude of intermarket relationships, but still that’s the case. While it is true that looking at the performance of a given market is the most important thing that one can do when estimating the future performance of a given asset, it doesn’t mean that it’s all there is to it. Conversely, looking at the bigger picture and considering the less known factors can give investors and traders extra insight necessary to gain the Holy Grail of trading – the edge. So, we thought that you might appreciate a discussion of factors that are not as popular as the analysis of the precious metals market on its own, but that is still likely to have an important effect on its price.
In today’s free analysis, we discuss three such issues: the non-USD silver price (the average of silver prices in terms of currencies other than the U.S. dollar), the Dow to gold ratio and the long-term USD Index picture. The latter is quite often analyzed, but such analyses are generally conducted based on only the most recent data and thus what we discuss should put such comments in proper perspective. In other words, it should make sure that one doesn’t miss the forest for individual trees. Let’s start with the former (chart courtesy of http://stockcharts.com):
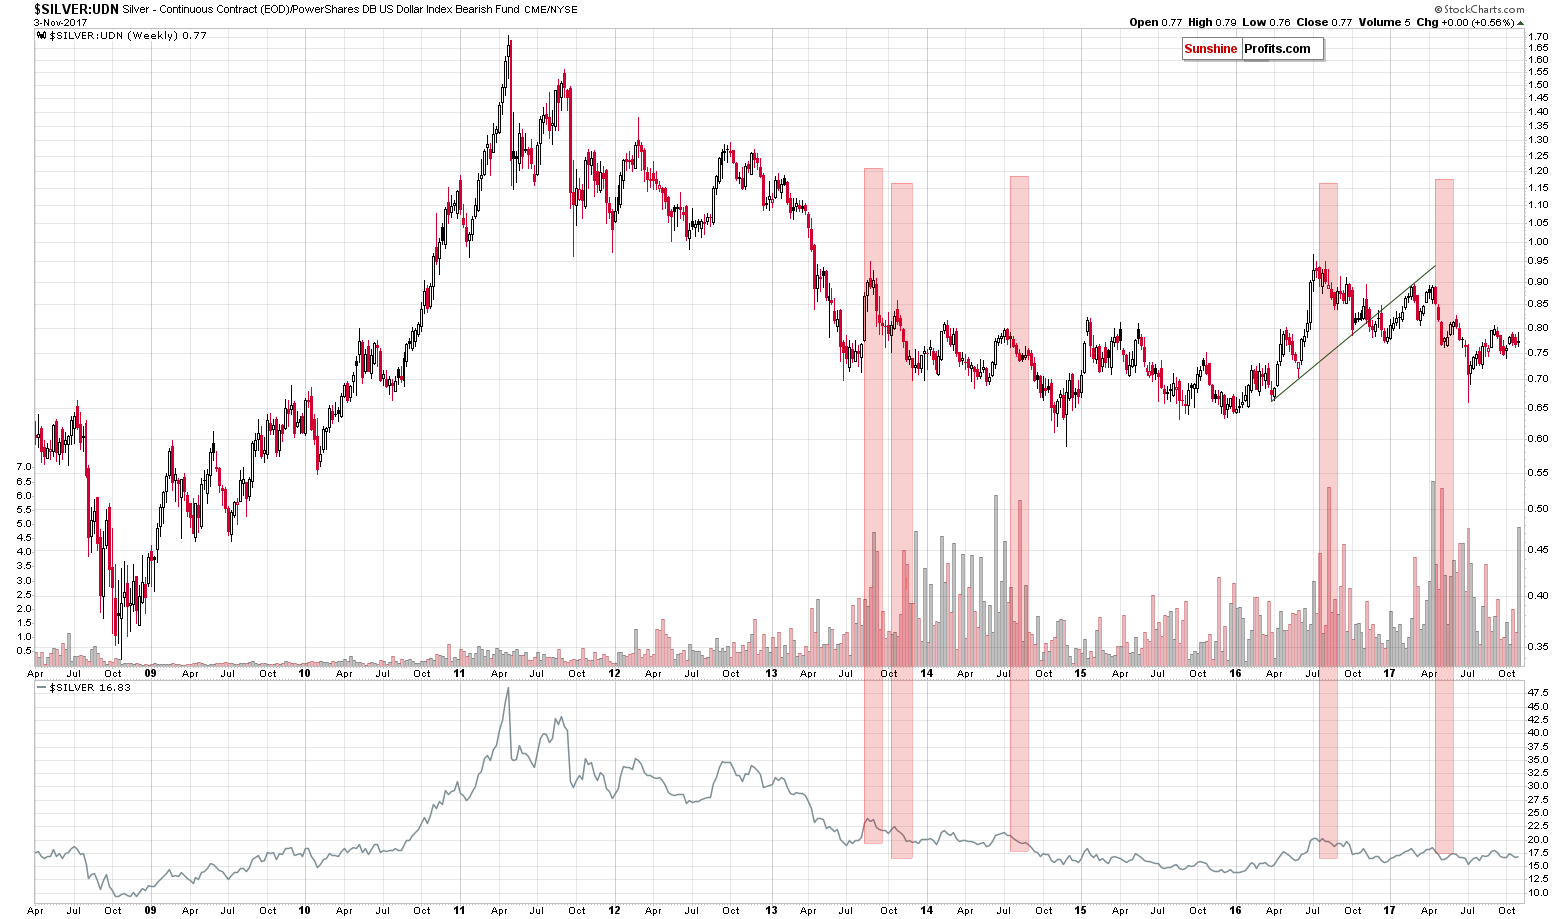
Silver’s non-USD performance is something that should be kept in mind and the same goes for the ratio of weekly volumes between silver and the UDN ETF (as that’s how we obtain the non-USD price). The above should not be ignored because silver is an important part of the precious metals sector (and the one that provided biggest gains in the 70s bull market) and the non-USD perspective should not be neglected because, after all, the USD is only one of the major currencies.
It is not the value of the ratio that is currently extraordinary, but the volume (the ratio of volumes, to be precise). Spikes in this ratio indicate extraordinary interest in the price of the white metal and there were many cases in the past when this served as an indication of much lower prices in the following weeks and months. This signal doesn’t say anything about the short term, but the medium-term implications are bearish.
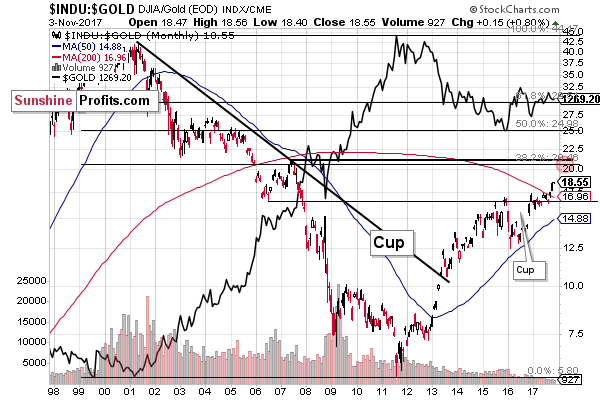
The same kind of implications are provided by the Dow to gold ratio. It moved higher and more than confirmed its breakout above the previous highs. The last time when we saw a major breakout in this ratio was in early 2013 and it meant that gold’s price was about to slide for hundreds of dollars.
Still as far as the short term is concerned, the USD Index also points to a reversal only after an additional rally.
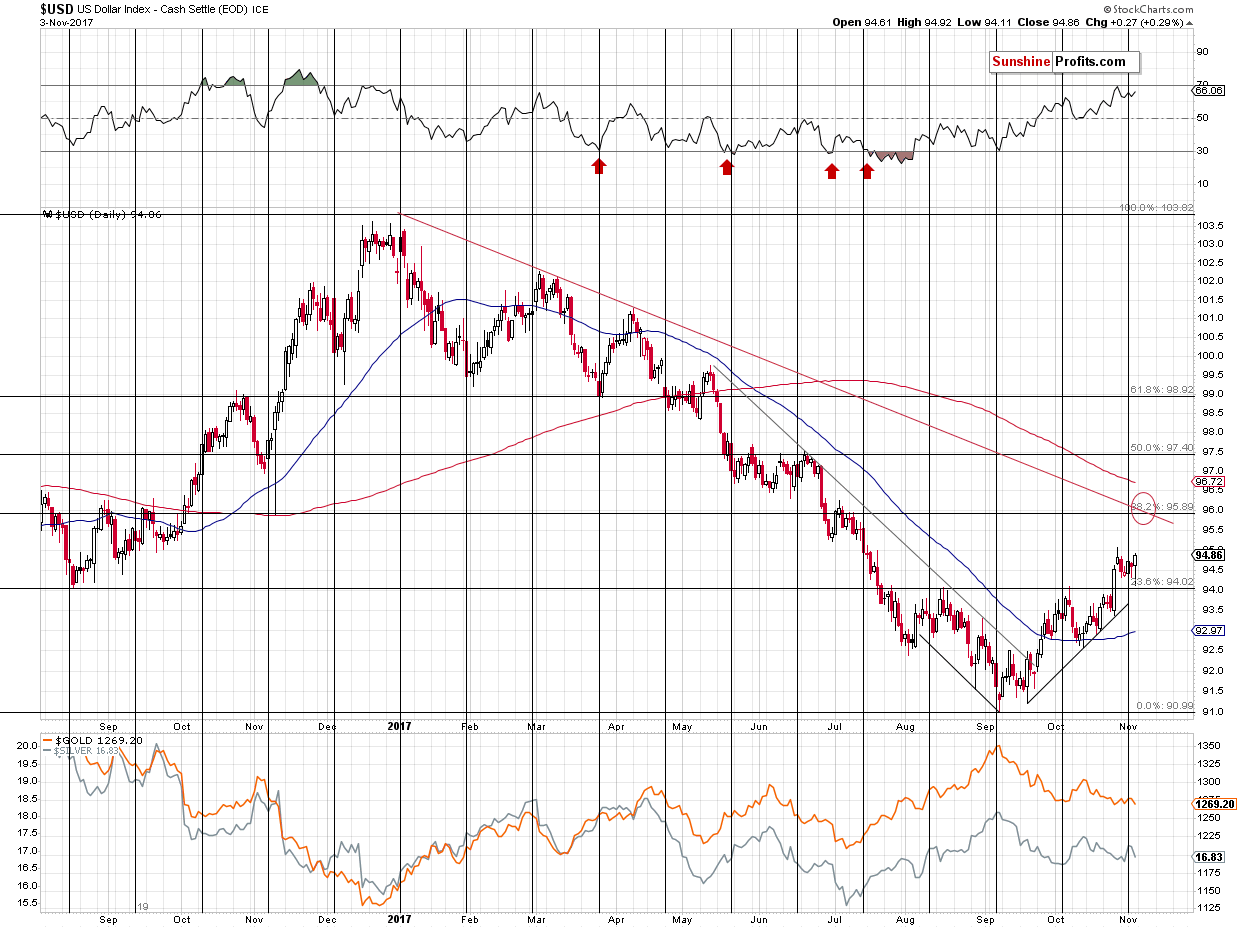
The breakout above the neck level of the reverse head and shoulders pattern is more than confirmed, so another rally appears very likely to be seen this week. The target at about 96 level (precisely 95.89) is supported by the declining red resistance line and the 38.2% Fibonacci resistance level. Both are based on a clearly visible, medium-term move, so they are important.
Now, let’s consider the follow-up action.
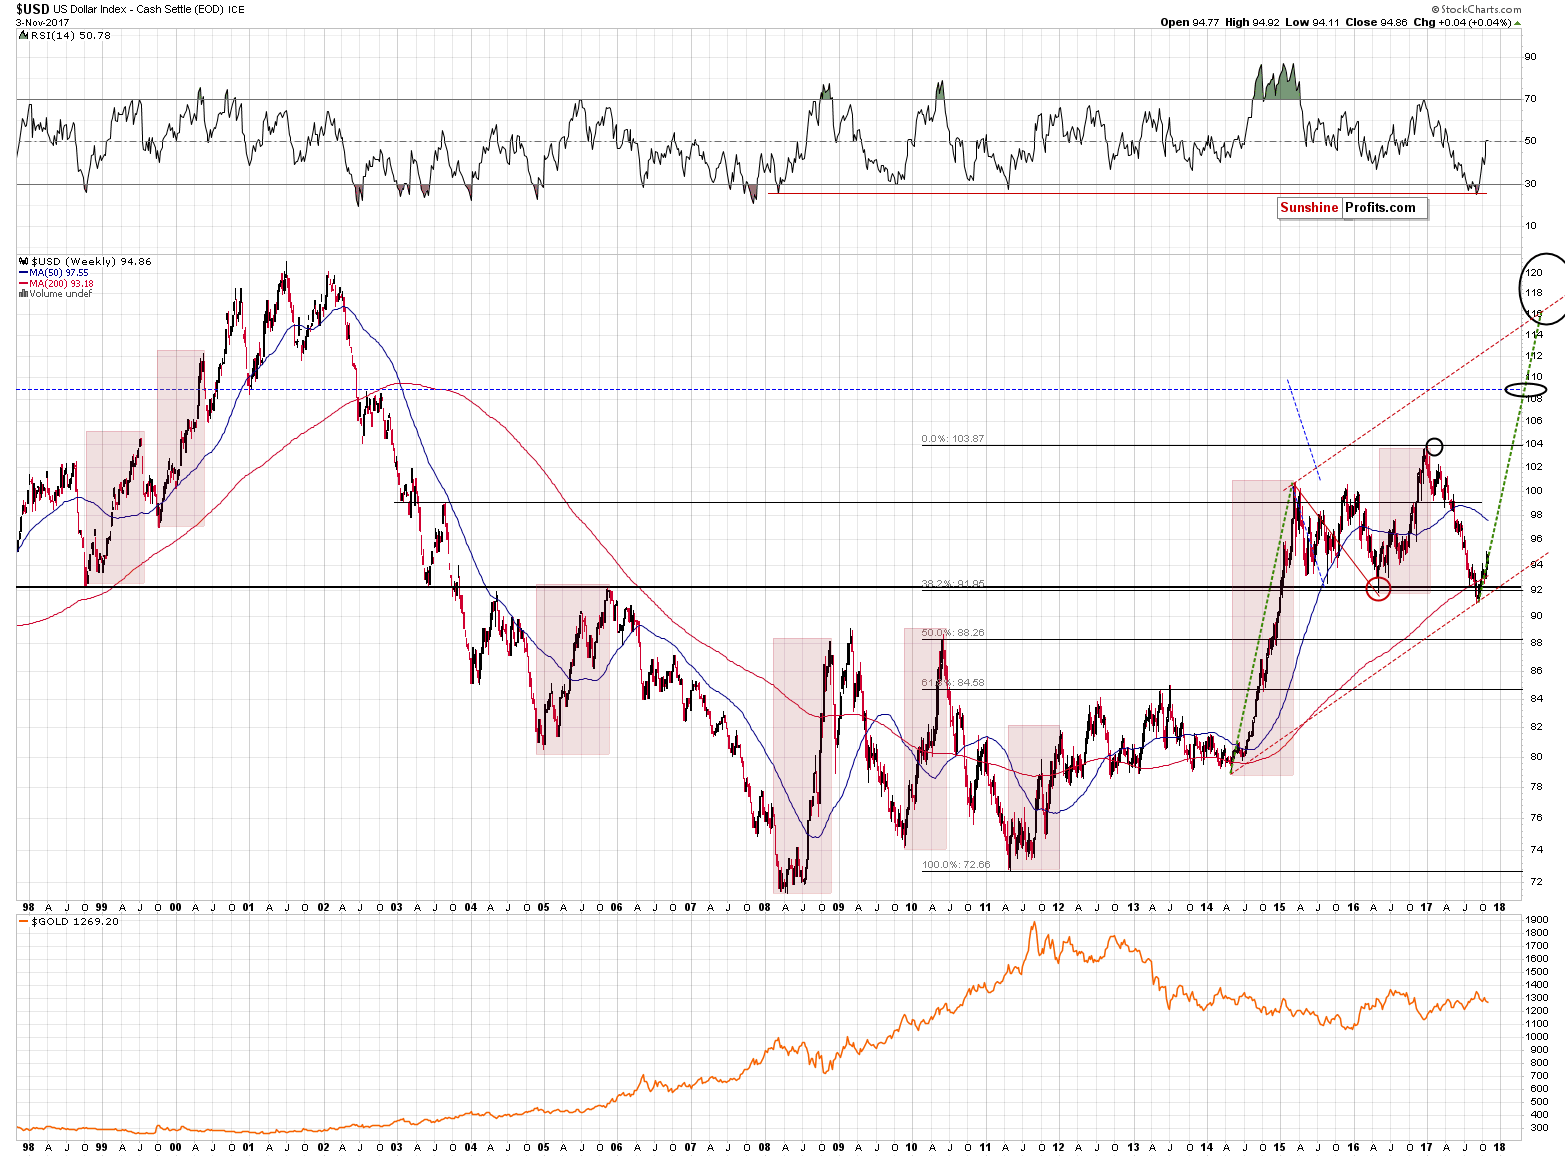
If the USD Index is starting a huge rally, just like it’s likely to based on where we are in the series of interest rate hikes, then it’s a good idea to check how the previous big USD rallies looked like and look for similarities. In this way we could spot trading opportunities (and look for confirmations at particularly important moments / price levels) and even if we don’t, the above should still prepare one for what’s to come and one would not panic in light of an event that would appear a game-changer on a day-to-day basis, but would be normal when looked at from the long-term perspective.
We marked 8 big rallies on the above 20-year chart. They vary in terms of length, size and sharpness, but there are a few similarities between them. The rallies took between (approximately) 30 and 45 weeks, so the current possible rally could end between April and July 2018, but that’s not something that has implications for the nearby days and weeks. However, analyzing the beginnings of the big rallies has such implications.
The first part of 6 out of 8 big rallies was characterized by a rather large pullback. In 1998, 2005, 2008, 2011, 2014 and 2016 the biggest, most stable and bullish part of the rally took place only after an initial correction that erased more than half of the very initial rally.
In the remaining two cases, the correction was still present, but it was not that significant.
So, should we expect the current rally to continue much higher without a bigger correction? No, such a correction would be something rather likely and normal. If the 50% correction is to be the minimum range for the pullback and the USD tops at about 96, then we can expect it to decline to about 93 – 93.5.
That would not be a small move, so adjusting one’s trading positions might be a good idea should it become very likely. The same is the case for the positions in the precious metals market as a bigger correction in the USD would likely translate into a visible correction in metals and miners.
Summing up, even though there are multiple signals pointing to lower precious metals prices in the coming months, it seems likely that after an additional decline from here, the precious metals sector is going to correct to the upside. While we keep the detailed target prices for precious metals and miners for our subscribers, we can say that one of the bigger factors that we will be monitoring for confirmations is the value of the USD Index and it appears likely that the mentioned reversal will take place when the USDX moves close to the 96 level.
We hope you enjoyed today’s analysis, even though it might appear controversial. If you’d like to receive follow-ups, we invite you to subscribe to our Gold & Silver Trading Alerts.
Thank you.
Sincerely,
Przemyslaw Radomski, CFA
Founder, Editor-in-chief, Gold & Silver Fund Manager
Gold & Silver Trading Alerts
Forex Trading Alerts
Oil Investment Updates
Oil Trading Alerts
