
Based on the March 18th, 2011 Premium Update. Visit our archives for more gold & silver articles.
Japan is definitely the talk of interest in capital markets. The economic fallout in the recent days did not lag much behind natures destructive forces. The financial aftershocks gathered force as investors fled from assets deemed risky such as stocks, oil and gold (the latter is quite surprising). Amid worries that the crisis could slow down a global economy, investors were also spooked by a 16 percent drop in Japanese shares early during the week. Stock markets slumped around the world as investors sought what they believe to be safe havens, like United States dollars and Treasury Bonds. (We are constantly amazed that people deem these assets to be safe havens.) It is inevitable that most investors will feel the ripple effects of Japans disaster in their portfolio one way or another.
Will treasury bonds benefit in the long run from the Japanese fiasco? There are some good reasons to think that they will not. In fact, it seems very probable that Japan will be a net seller off U.S. debt and equities as the Japanese government and the countrys companies and citizens raise cash to fund the extensive rebuilding that will be needed. Keep in mind that Japan is the worlds second largest holder of U.S. debt. It is estimated that Japan owns about $3 trillion of U.S. stocks and bonds. Japan owns more than $1 trillion in U.S. stocks which is equal to about 6% of the total value of the New York Stock Exchange. Selling off any sizeable portion of that will undoubtedly put downward pressure on American equities. Japan has been buying on average about $10 billion worth of treasuries per month. The reconstruction effort in Japan will also test its government's ability to borrow. Japan is already one of the most indebted countries in the world.
It appears that if Japan begins dumping its U.S. bonds, the U.S. will have no choice but to raise interest rates in order to attract buyers for its treasury bills. And it needs to sell treasury bills in order to pay the interest on its bloated debt and its overstuffed spending programs.
With so much happening in the world, lets have a look into precious metals market and its performance in recent days. Lets turn to this week's technical part with gold market analysis. We begin this weeks gold section with the Gold:JPY ratio chart (charts courtesy by http://stockcharts.com.)
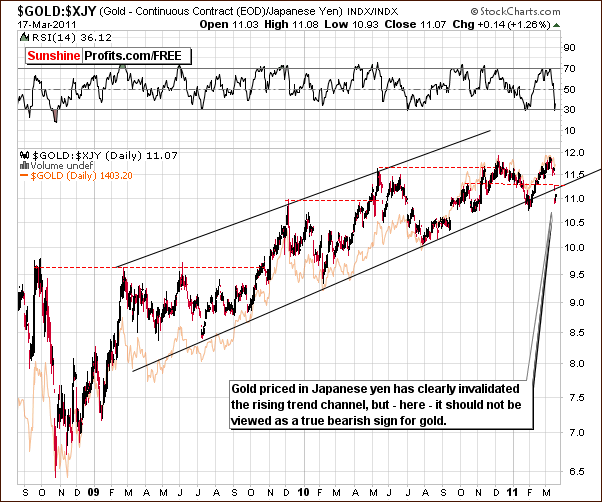
In terms of the Japanese yen, gold has moved sharply lower and is visibly below the rising trend channel. Should this be a cause for concern? Well, remember that technical analysis leads Investors to bet on the emotional patterns of the traders on the whole, buying when they sell and selling when they buy.
Patterns, trends and so are particularly useful when markets move due to emotional factors. Remember markets are logical in the long run but emotional in the short run. Thats why we use fundamental analysis to establish long-term trend (secular bull market in commodities and precious metals) and then use technical analysis and many other tools for the short- and medium-term price swings. We are using technical analysis because we find it profitable to do so, but we are not technical analysis fanatics, and we realize that it has some limits, just like any other type of analysis for instance fundamentals wont tell you anything about the short-term price swings.
The current situation in Japan was not something that people could have expect to happen at this time, and what they could have discounted in the price. It was not a small event either, so it could not be viewed a price noise. The price of gold from the yen perspective declined, but it is clear at this time that it did not happen because gold became less attractive to investors.
It took place, because value of the yen has risen of late and this is in tune with what has been seen in previous periods of calamity in Japan. Such was the case in 1995 and since the yen has withstood great turmoil before, it appears that the long-term perspective for gold is not of great concern at this time.
Now lets turn towards gold:bonds ratio chart.
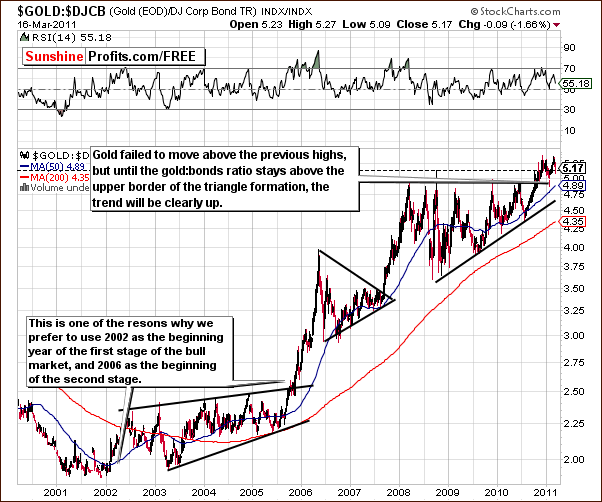
It appears that we may have seen a double top formed above the rising triangle pattern but unless gold declines below the upper border of this pattern, the long-term trend will remain up. Even if it moves slightly below, the uptrend will not be invalidated as long as it remains above the lower part of the triangle pattern. We are presently a long ways away from the lower level of the triangle pattern and for this reason; it appears that the long-term outlook remains bullish.
Overall,the situation is once again mixed this week for the yellow metal as far as the following weeks are concerned. However, the short term sentiment at this point appears positive.
Moving on, lets have an overview on performance of silver in the recent past.
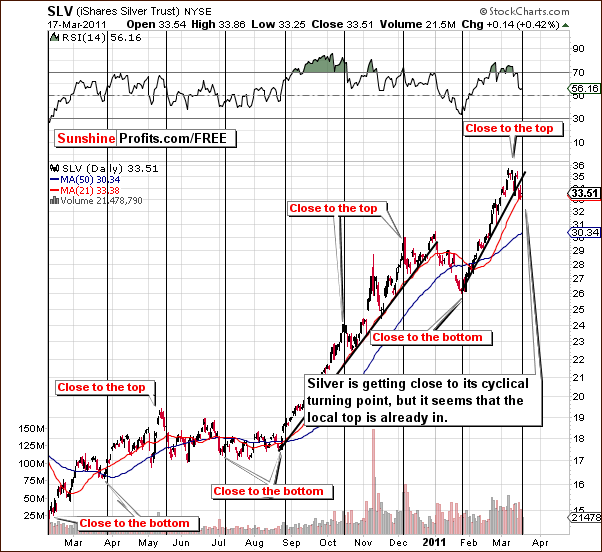
We see that silver appears to be right at one of its cyclical turning points. It appears that the local top is already in and the normal precision of the cyclical turning points supports this assumption. In other words, cyclical turning points are meant to work on a close-to-something basis, even though there were many times when they were right on spot.
Price levels have moved below the rising short-term support level and this has been confirmed. The trend appears bearish at this time, although a quick rally and a retest of the previous support line may be seen in the short term.
In our previous essay entitled Gold, Silver and Mining Stocks Decline as Stocks Lead the Way we explained that a decline in stocks is likely to lead to an analogous move in metals. Stocks have indeed declined, but the short-term bottom may be in. This means that at least a quick bounce would be likely also in the precious metals sector.
Platinum chart confirms the short-term bullish theory, as it features a Reverse Bullish Hammer candlestick pattern.
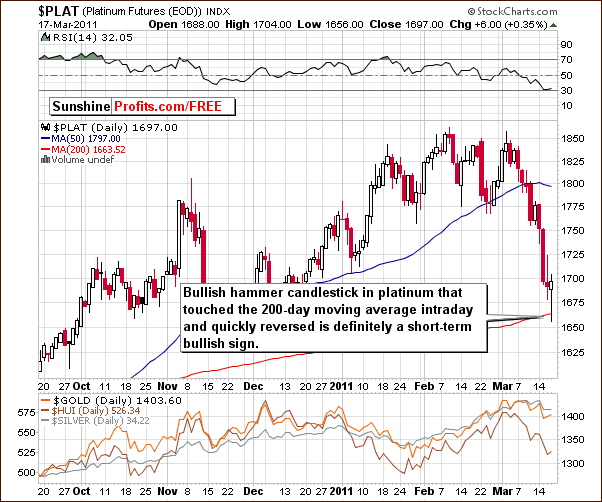
The 200-day moving average has been touched and closing prices moved above this level to nearly 1700. This is a short-term bullish development. This is important because the other precious metals may very well follow suit and show some strength from here. The same holds true for stocks since platinum is primarily used in industrial applications.
Summing up,once again we have some mixed signals for gold and silver with the immediate-term being bullish but the short-term (several weeks) being mixed. Platinum moves show that there still appears to be some positive news in at least one of the precious metals and this may very well carry over to the others.
To make sure that you are notified once the new features are implemented, and get immediate access to my free thoughts on the market, including information not available publicly, we urge you to sign up for our free e-mail list. Sign up for our gold & silver mailing list today and you'll also get free, 7-day access to the Premium Sections on my website, including valuable tools and charts dedicated to serious PM Investors and Speculators. It's free and you may unsubscribe at any time.
Thank you for reading. Have a great weekend and profitable week!
P. Radomski
--
This week we analyze the economic fallout of the tragedy unfolding in Japan. Most probably you have already felt the ripple effects of Japans disaster in your portfolio. Will Treasuries stumble as Japan repatriates money to rebuild its economy? Will the disaster be a catalyst for a stronger Japan?
Meanwhile gold, silver and mining stocks are moving higher after a sharp plunge. What does this - and other factors - tell us about the immediate-term, short-term and long-term gold movements? What's profitable to bet on, and what's not? This week's update includes discussion over the major technical development such as the HUI Index moving to its 2008 and 2009 lows and recent bullish intraday action in stocks.
Moreover, we have just seen a signal from one of our indicators that proved to be 100% correct for more than 2 years - naturally, today's update includes our comments on this development.
We encourage you to Subscribe to the Premium Service today and read the full version of this week's analysis right away.
