

Briefly:
Intraday trade: Our yesterday's neutral intraday outlook has proved accurate. The S&P 500 index gained 0.1%, as it extended its consolidation along 2,500 mark. The market may continue to fluctuate today. On the other hand, support level is relatively close, at last week's Tuesday's daily gap up of 2,488.95-2,490.37. Therefore, we still prefer to be out of the market, avoiding low risk/reward ratio trades.
Our intraday outlook remains neutral, and our short-term outlook is bearish, as we expect downward correction. Our medium-term outlook remains bearish:
Intraday outlook (next 24 hours): neutral
Short-term outlook (next 1-2 weeks): bearish
Medium-term outlook (next 1-3 months): bearish
The U.S. stock market indexes were mixed between -0.1% and +0.2% on Wednesday, following volatile trading session, as investors reacted to the FOMC Statement release. The S&P 500 index has reached yet another new all-time high at the level of 2,508.85, before retracing some of its recent advance. It continues to trade within a short-term consolidation along the level of 2,500. The Dow Jones Industrial Average has reached new record high at the level of 22,413.26 yesterday. The technology Nasdaq Composite continued to fluctuate below Monday's new all-time high of 6,477.77. The nearest important level of resistance of the S&P 500 index is at around 2,510-2,520. On the other hand, support level is at 2,490-2,500, marked by last week's Tuesday's daily gap up of 2,488.95-2,490.37, among others. The next support level remains at 2,465-2,475, marked by last Monday's daily gap up of 2,467.11-2,474.52. The level of support is also at 2,460, marked by previous short-term consolidation. The S&P 500 index continues its long-term uptrend, as it reaches new record highs above the level of 2,500. The uptrend continues despite some short-term technical overbought conditions. However, we still can see medium-term negative technical divergences:
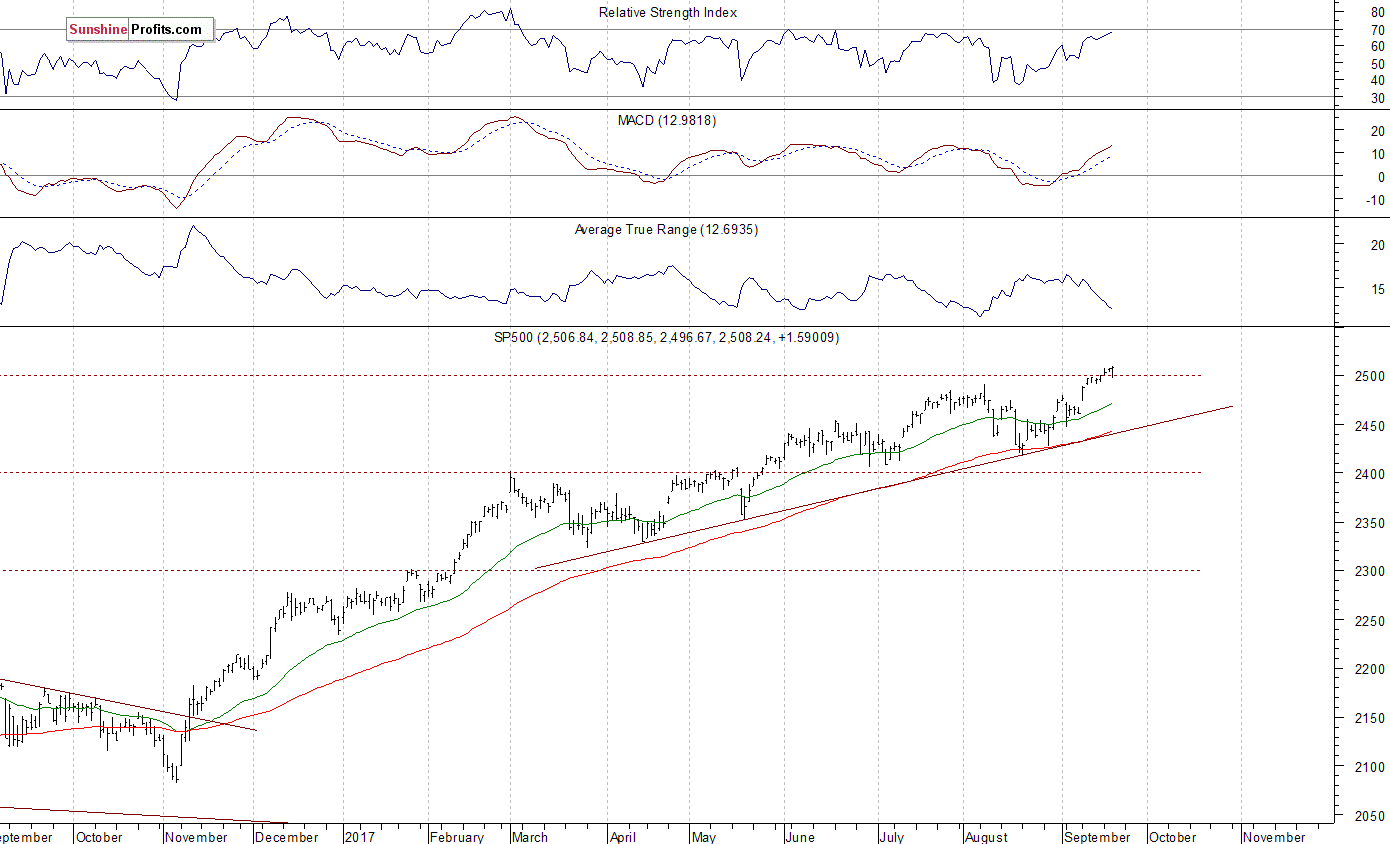
Will Uptrend Continue?
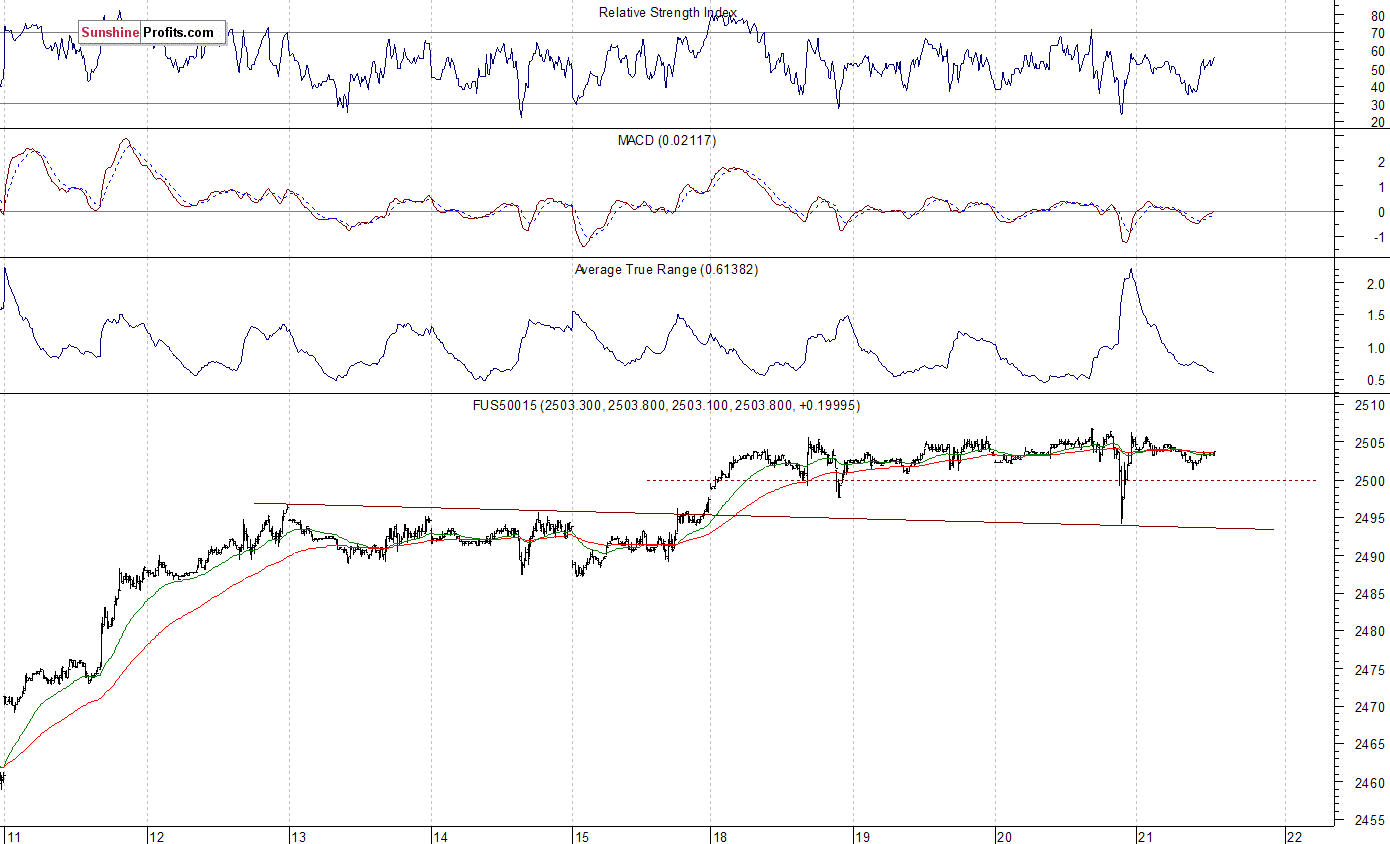
Expectations before the opening of today's trading session are slightly negative, with index futures currently down between -0.05% and -0.1% vs. their Wednesday's closing prices. The European stock market indexes have been mixed so far. Investors will now wait for some economic data announcements: Initial Claims, Philadelphia Fed Index at 8:30 a.m., Leading Indicators at 10:00 a.m. The market expects that Initial Claims were at 302,000 last week, and Philadelphia Fed Index was at 17.3 in September. The S&P 500 futures contract trades within an intraday consolidation, as it retraces some of its yesterday's rebound off support level at around 2,490-2,495. It continues to trade close to record high above the level of 2,505. The nearest important level of resistance is at around 2,505-2,510. On the other hand, support level remains at 2,490-2,500, marked by previous level of resistance. The next support level is at 2,480-2,485, marked by short-term consolidation. The support level is also at 2,465-2,470, among others. The futures contract extends its short-term fluctuations along the level of 2,500, as we can see on the 15-minute chart:
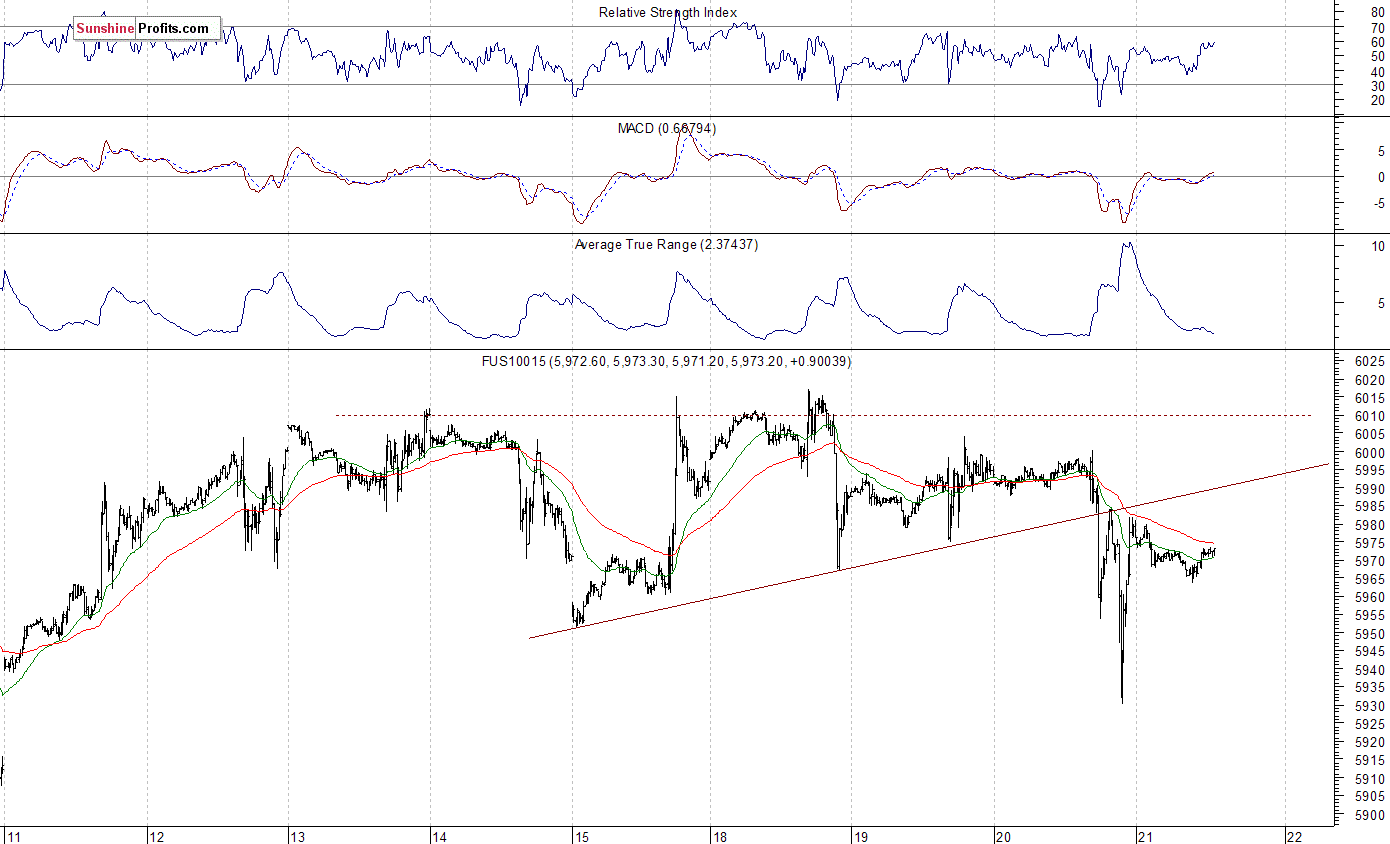
Nasdaq Relatively Weaker
The technology Nasdaq 100 futures contract follows a similar path, as it retraces some of its yesterday's fluctuations. The nearest important level of resistance is at around 5,980-5,990, marked by previous support level. The next resistance level is at 6,000-6,020, marked by record highs. On the other hand, level of support is at 5,930-5,950, marked by yesterday's daily low, among others. The Nasdaq futures contract broke below its week-long upward trend line as the 15-minute chart shows:
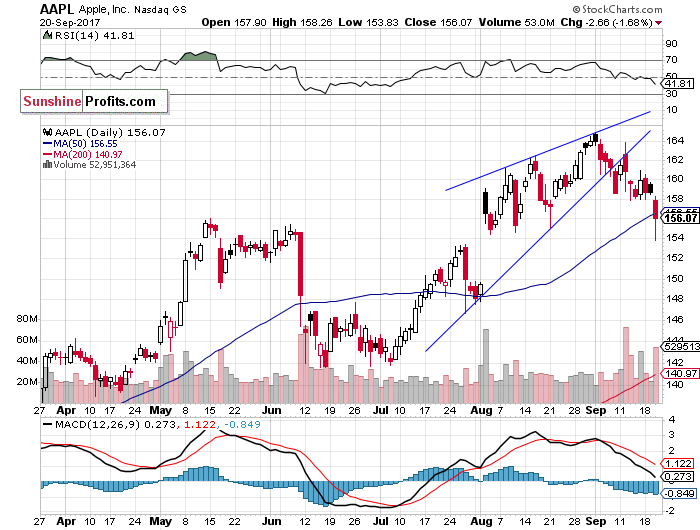
Let's take a look at Apple, Inc. stock (AAPL) daily chart (chart courtesy of http://stockcharts.com). It extended its short-term downtrend yesterday, as it broke below recent consolidation. The stock continues to trade below previously broken upward trend line and below its over-month-long rising wedge pattern. We still can see some relative weakness vs. the broad stock market index. However, it bounced off support level marked by the early August daily gap up yesterday:
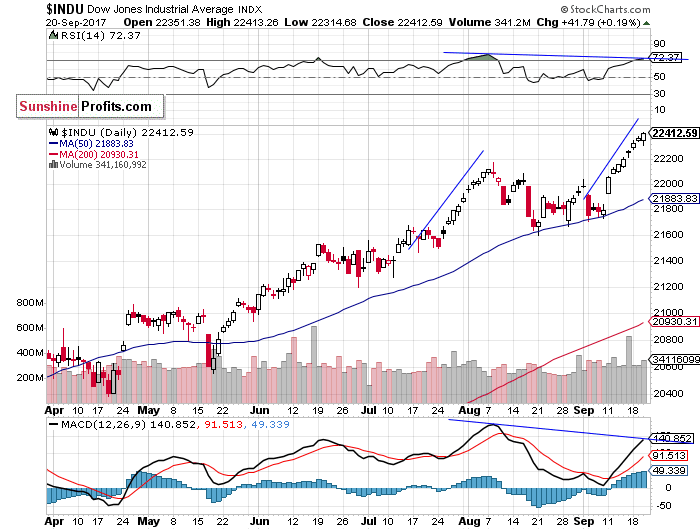
Now, let's take a look at the Dow Jones Industrial Average daily chart (chart courtesy of http://stockcharts.com). The blue-chip index remains relatively stronger than the broad stock market, as it continues its uptrend. Will it extend this move up despite overbought conditions and negative technical divergences? So far, it looks similar to July - August advance:
Concluding, the S&P 500 index reached new record high on Wednesday, as it got slightly above its Monday's daily high. Then it fell quickly below 2,500 mark, before bouncing off support level and closing virtually flat. Will the bull market extend even further? Will it accelerate? There have been no confirmed short-term negative signals so far. However, we still can see some medium-term overbought conditions along with negative technical divergences.
If you enjoyed the above analysis and would like to receive free follow-ups, we encourage you to sign up for our daily newsletter – it’s free and if you don’t like it, you can unsubscribe with just 2 clicks. If you sign up today, you’ll also get 7 days of free access to our premium daily Gold & Silver Trading Alerts. Sign up today!.
Thank you.
Paul Rejczak
Stock Trading Strategist
Stock Trading Alerts
