
This essay is based on the Premium Update posted on June 14th, 2009. Visit our archives for more gold & silver articles.
In my previous essay (and in my previous Premium Update) I wrote the following:
(...) once you consider details, the outlook becomes rather bearish in the short term. The point here is that volume has been declining while gold has been rising and it rose along with declining gold price. Volume usually confirms the direction in which the market is headed, and this time it points to lower prices in coming days. Naturally, a day or two of pause are possible (and also quite likely), as gold is currently just at its support level, but still - it is likely that gold will move lower in the short term.
This is exactly what took place during the rest of the week - we had slightly higher prices of gold, silver and mining stocks in the middle of the week, but they closed lower on Friday. Of course the key question here are: "Is the bottom already in?" and "Is it safe to get back on the long side of the market?" In short, it seems that we are going a little lower before we will reach a local bottom.
Gold
Moving on to the current situation, let's begin with a gold chart. Charts are courtesy of stockcharts.com.
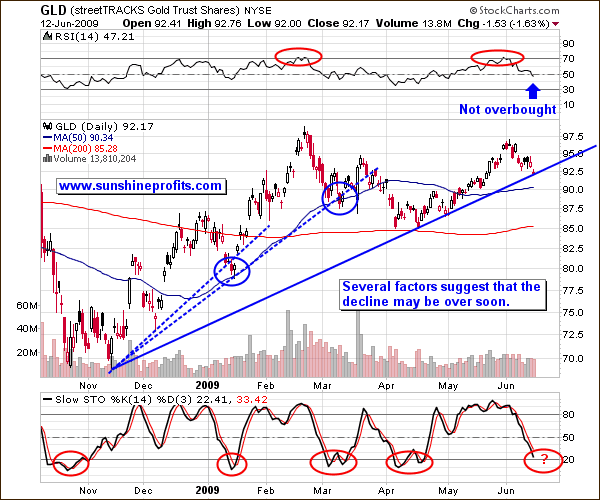
At the first glance, the situation on the gold market looks quite bullish. Gold has advanced substantially from April to June, and has been correcting since the beginning of this month. Corrections are to be expected on any market, and gold is no exception here, so until we see evidence that this correction is anything more than just that, we remain bullish in the long run. Right now the price of gold (and also the value of the GLD ETF) has closed at its long term support level (solid blue line), which generally indicates that a rebound is likely.
Generally doesn't mean always, and it is usually useful (and profitable) to put "general rules" into proper context before making any investment decisions. As mentioned above, the price of gold stopped at the rising support line. However, did gold rebound in the past when the situation was similar? I have marked two situations with dashed lines on the above chart.
Please note that each time price got to the analogical support line it has briefly broken it before rising again, so this may be the case also now.
Additionally, previous bottoms were accompanied by particular signals from the stochastic indicator (as seen on the bottom of the gold chart). Several weeks ago I wrote about the RSI indicator as particularly useful in timing top on the precious metals market. Naturally - there is no perfect tool. RSI is not that useful in determining bottoms on the PM market, as it is the case with tops. Still, there are many more indicators than just the Relative Strength Index, and one of them proved to be particularly useful in estimating bottoms in the recent past. During the past several days most meaningful bottoms took place when stochastic indicator was below the 20 level and it started to rise (thus crossing its moving average) - I have marked these situations with red ellipses.
Currently, the stochastic indicator has moved lower, but it is not yet below the 20 level. Therefore, there is another significant confirmation of the previous conclusion - the bottom is near, but it is yet to materialize. How low can it go temporarily? We will leave this part of our analysis to the Members of our Premium Service.
Silver
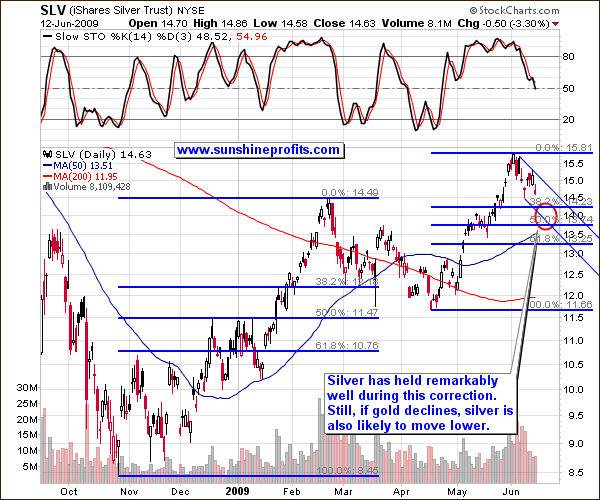
The first thing that comes into mind after taking a glimpse at the above chart is that silver has held very well during the current decline. The strength in the silver market should not surprise you, if you've been following my analysis for some time now - I've written about the particularly favorable situation on the silver market on 20th of April.
As far as the target for this decline is concerned, the situation is similar to the one in the gold market. The area in which the bottom is likely to take place is marked with a red ellipse and it contains levels corresponding to two important Fibonacci retracement levels: 38.2% and 50%. Prices of many assets often correct these parts of their previous move before resuming their main trend (for example the 38.2% level stopped the decline at the beginning of March 2009). Another important level that this ellipse contains is the lower border of the short term trend channel - if we get the C decline of the ABC (zigzag) correction it may go exactly to this support level. I currently view such a decline as likely.
Summary
After having rallied in May, the whole precious metals sector entered a corrective phase, which began two weeks ago. Currently many factors suggest that the end of this correction is near. The coming bottom is likely to provide a favorable buying opportunity for long-term investors with the "buy more on the dips" approach. Short-term traders are advised to consider preparing themselves for opening long positions and closing remaining short ones in the coming days.
To make sure that you get immediate access to my thoughts on the market, including information not available publicly, I urge you to sign up for my free e-mail list. Sign up today and you'll also get free, 7-day access to the Premium Sections on my website, including valuable tools and charts dedicated to serious PM Investors and Speculators. It's free and you may unsubscribe at any time.
P. Radomski
--
After having witnessed two-week corrective phase in the precious metals sector many Investors and Speculators are wondering whether or not the bottom is already in. In this week's commentary I provide my thoughts on that matter.
In other news, I have just updated the sample version of the Premium Update by using last week's report. Therefore, if you were wondering what is this part of the Premium Service like, or if you want to read my previous Premium Update free of charge, please follow this link.
This week's Premium Update includes the ranking of top gold and silver juniors. The company that topped our silver ranking last month (Silverstone Resources Corp. - SST.V) has been recently acquired by Silver Wheaton Corp (SLW) at the share exchange ratio of 0.185. The rate of return that one would achieve by investing in this company when we have previously published our junior ranking (May 1st) and exiting this Friday amounts to approximately 24%. Naturally, at the beginning of June the price was even higher. During the same time frame the TSX Venture Index (often used as a proxy for the junior sector) gained approximately 14%, so it outperformed the sector 1.7 times.
