
This essay is based on the Premium Update posted on September 3rd, 2010. Visit our archives for more gold articles.
Like the song says - See you in September - the ninth month has notoriously been the strongest calendar month for gold. Rather than accept this blindly as Gospel Truth, we have decided to delve into this in detail to see what factors could be used to explain this phenomenon. After all, statistics can sometimes be misleading, for instance if someone owns a dog that does not mean that they both on average have three legs.
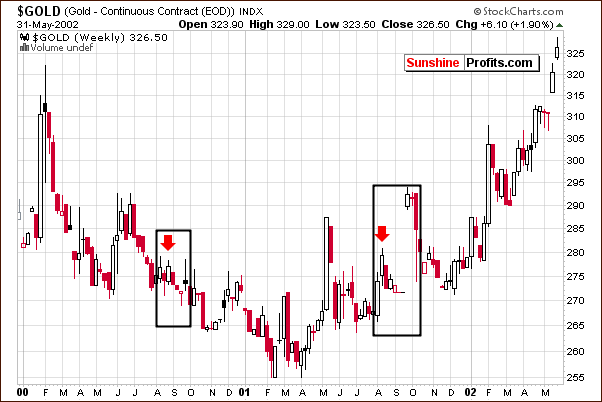
We studied the charts for a ten-year history of gold prices. The most obvious pattern through the decade is the presence of an August corrections in nearly every one of the ten years. So is the September rally nothing more than a reversal of the August downturn? Not necessarily, as there are also fundamental patterns involved, but the move is generally amplified by the fact that gold was correcting in August, and that it is ready to rally. If so, then the September effect could not play out in the way many investors expect it to (immediate surge in prices).
The months of August and September have been outlined as the focal points. Please take a look at the Gold chart for 2002, for example (charts courtesy by http://stockcharts.com.)
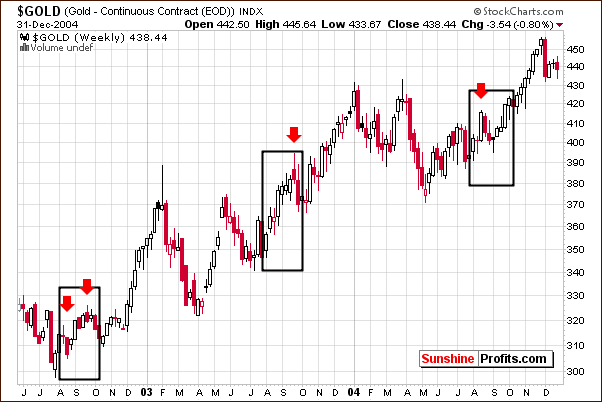
Now let's take a look at 2003 below. There was clearly no August correction in that year, and there was no clear rally in September. In fact, the August rally resulted in a September correction. Does this seem at all similar to 2010? Have we not seen gold rally for the entire month of August?
Now, let's examine another possibility. Perhaps investors have been waiting to see a September rally based on historical trends. The thinking might go something like this: if there is going to be a huge September rally then why would I sell just before it? It is quite possible that if higher prices are not seen very soon, these investors will reluctantly liquidate their positions and this could be the impetus for a bigger correction in gold's price. The outlook for gold appears to be more bearish than bullish - taking the next 1-3 weeks into account - when all these factors are considered.
There is another fact that simply cannot be omitted. On average, the rally starts in the middle of the month, as you can see this clearly on the chart below.
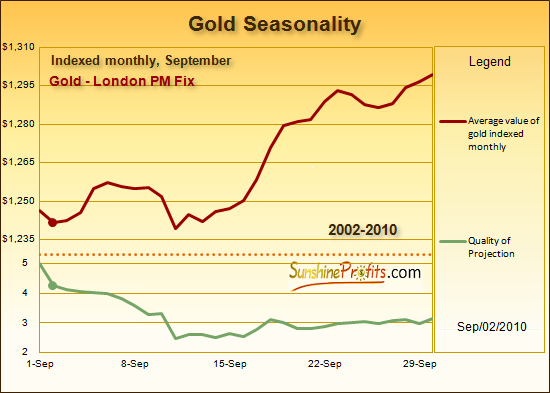
Please note that even if we agree that gold is to rally in September and the rally will be strong - the odds still favor that taking place in the second half of the month.
Having briefly commented on the situation in the yellow metal itself, let's move to the mining stocks. Last week we've seen that gold stocks again failed to move above the rising resistance line. This is quite similar to the scenario for gold itself in recent days. No decisive - although impressive on a day-to-day basis - move higher has been accomplished either. The prices of precious metals stocks did move higher in the past days, but they did not break above significant resistance levels yet. We will look at the short-term chart for more details.
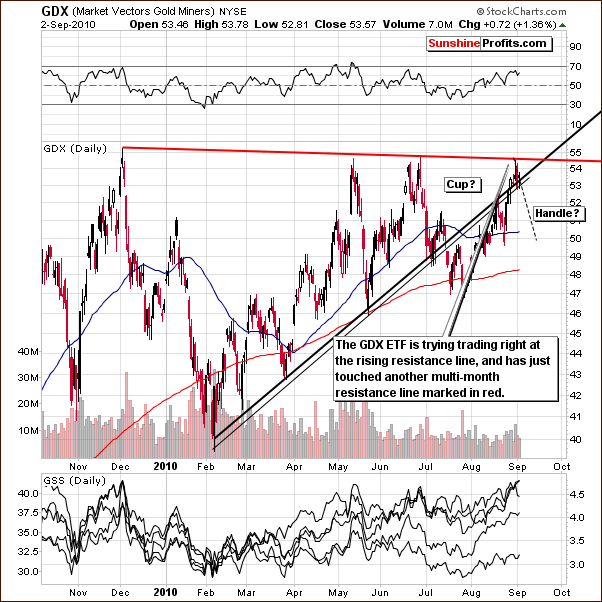
In this week's short-term GDX chart we see that mining stocks are right at the multi-month resistance level, which is indicated by a red line on this week's chart. In addition, the rising resistance line was also not broken. The indication here, therefore, is that lower prices are likely before any additional rally can materialize. Furthermore, lower volume levels may be an indication that buying power is drying up which would further support a likely decline in prices.
There seems to be some indication at this time that points to the possibility of a huge rally following the likely correction which we have been discussing. One factor, which supports this hypothesis, is the possible formation of a cup-and-handle pattern in our chart. The cup portion of this pattern would actually be where we are today and the handle would be formed by a correction, which we see as a real possibility very soon. The likely bottom would then follow in mid-September with a subsequent rally in the weeks to follow.
Although this is quite speculative as of now, we are looking at all possibilities and feel that this is worth mentioning due to the positive risk-reward ratio, which it would present.
This week we showed Subscribers to our Premium Service the Gold Miners Bullish Percent Index, which we find to be a reliable way to analyze current trends. The Williams' %R and RSI showed us that we are in the overbought territory. The indicators gave our Subscribers the timing for what we believe will likely be the local top.
Signals coming from the mining stocks indicate that a correction is very possible and may be seen very soon. This will quite possibly provide excellent opportunities for investors to enter the market with favorable risk-reward ratios and tremendous profit potential. We will continue to watch for these developments daily and inform our Subscribers accordingly when the situation warrants.
This week we received an interesting question from one of our Subscribers. He wanted to know if technical analysis is still reliable when global fundamentals are changing, things like quantitative easing, Europe's problems, China's rapid growth, etc.
The most important fundamental that does not change over time is human psychology and emotional behavior of individual investors. This is something by far more stable than even several bouts of quantitative easings. China's growth will not cause people to stop being greedy when they see higher prices and fearful when they see them decline. Europe's problems will not cause people to act by means of cold logic alone. Technical Analysis's foundations are based on real mechanisms, which are inherent part of human nature, and that is not something that is going to change anytime soon.
To make sure that you are notified once the new features are implemented, and get immediate access to my free thoughts on the market, including information not available publicly, I urge you to sign up for my free e-mail list. Sign up today and you'll also get free, 7-day access to the Premium Sections on my website, including valuable tools and charts dedicated to serious PM Investors and Speculators. It's free and you may unsubscribe at any time.
Thank you for reading. Have a great weekend and profitable week!
P. Radomski
--
In this week's Premium Update we've answered many questions from our Subscribers. Most of them relate directly to latest market developments, but several concerned also the fundamental forces that have been driving markets for many decades. We've answered these questions and supported our replies with the in-depth analysis of PMs' performance. We've put a special emphasis on gold's performace in every August and September during the last decade in a separate section entitled September Rally.
This week's Correlation Matrix provides us with details about nature of linkage between general stock market and gold. Moreover, Williams %R and RSI applied to the Gold Miners Bullish Percent Index provide additional insight to the soon-to-be-seen market developments price swings.
Additionally, this week's Premium Update features our unique SP Long-Term Junior Indicator dedicate exclusively to the junior sector. Speaking of the latter, this week's Premium Update includes our rankings of top gold and silver juniors.
We encourage you to Subscribe to the Premium Service today and read the full version of this week's analysis right away.
Back