
This essay is based on the Premium Update posted on May 7th, 2010. Visit our archives for more gold articles.
During the previous weeks much has been said about the declining Euro and what effect it may have on the price of gold - we argued that declining Euro doesn't mean that gold has to decline. We don't want to get into details once again in this essay, but instead we would like to remind you about several facts that we feel have been forgotten during the past several weeks.
It is often said, that the U.S. Dollar provides a safe haven status, but it that really the case? Did everyone forget about the gargantuan twin deficit that rises each day? Did the massive amounts of U.S. debt in the hands of foreign investors suddenly stop being a problem? Did really so much change yesterday as far as the global economic situation is concerned that the stock indices plunged so heavily? Not really. The thing that changed was market's perception toward the abovementioned USD fundamental factors determining the currency exchange rates.
Therefore, fundamentals are one thing - but market's participant's emotions are quite another thing, and we still need to take charts into account before making any timing calls. So, let's begin this week's technical part with the analysis of the U.S. Dollar. Let's start with the long-term USD Index chart (charts courtesy by http://stockcharts.com.)

In one of our previous Premium Updates we wrote the following:
We expect the USD local top to be reached in the next week or two. With the RSI still below 70 and past tops occurring at 70 or higher, we expect some sideways movement or slight uptrend as the RSI moves closer to 70.
With what we have seen last week, many signs point to this rally being over or very close to a local top today. The USD moved about 5 points higher since the April 2010 bottom, which marked the beginning of the rally. Regardless, we are now bearish for the short-term. We base this on a number of signals which are visible in today's long term chart. First, we see that the USD is trading along the upper border of its trading channel, which serves as a resistance level. Secondly, the RSI has risen above the 70 level.
Please take a look at the previous rallies - we've marked them with different colors on the above chart. If the very recent rally is going to be similar to what we've seen in the past - and it is highly probable that it will - the rally is likely to be over or it's very close to being over. We have extrapolated the previous rallies to the current situation (taking the April bottom as the beginning of this rally) and it turns out that we are now in the area that is very likely to mark the end of this upswing. Nearly all indications are that the USD top will be reached in the 84 to 85 level, and we have just seen the USD Index move slightly above the 85 level and retrace below it.
Let's move on to the short-term chart for more details.
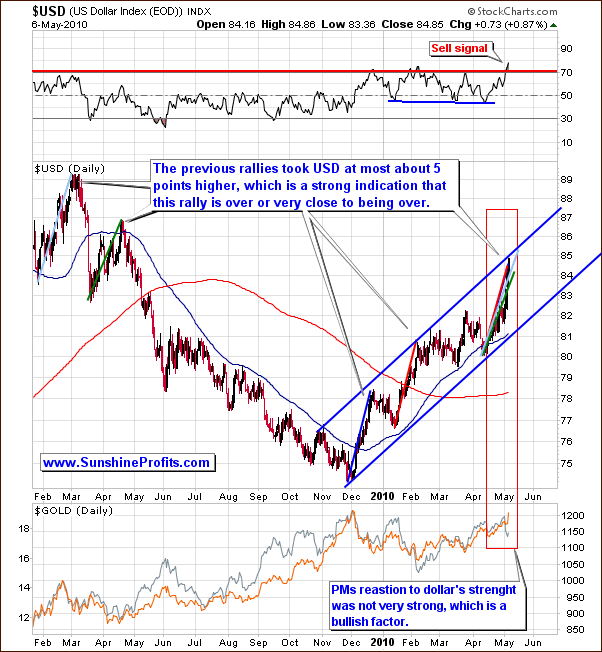
The above chart clearly shows another factor, which supports our belief that the current USD rally is in fact over or very close to its end. Last week we mentioned that the vertical red lines in the short-term chart frequently correspond to local tops and bottoms. We further stated that it was unclear, which would occur in early May. Now - taking into account the recent strong upswing - it seems very likely that it's going to be a local top. The final confirmation comes from the analysis of volume.
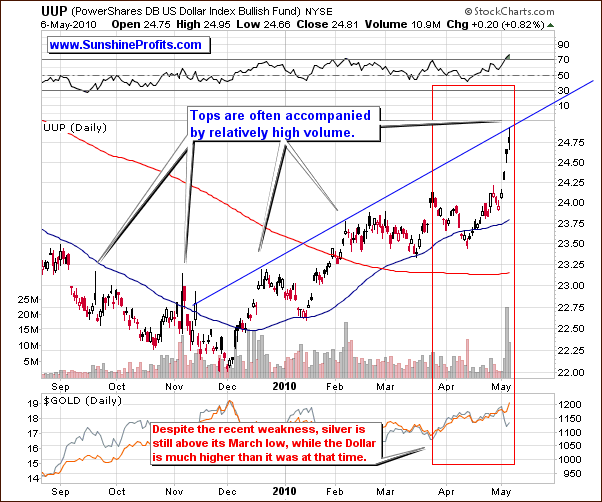
Looking at the UUP ETF, ETF being a proxy for the USD, we see the RSI around the 70 level. This is a sell signal for USD. We also can see that previous tops have been accompanied by high daily volume. The daily volumes this week have dwarfed what we saw last week. This huge spike in trading volume is yet another factor which supports our belief that we have reached a local top or we will see one soon. Still, this is not the most bullish aspect of the above chart.
The most bullish part of the above chart is the relative performance of gold - and yes, also - silver. Although the white metal has recently moved much lower, silver managed not to slide below its late March low. With the USD showing significant strength of late, the white metal overall has actually held up fairly well. With the outlook bearish for the USD, we remain bullish on all precious metals in the coming months even if we see a correction in the short run.
Summing up, indications are that the USD has reached a local top, which - along with the fact that gold was able to rise even along with higher USD values - is a positive factor for the precious metals market. We may see a short-term correction sooner or later (details and targets available to Subscribers), but once that decline is over, the rally is likely to resume, which could easily mean PMs much above today's levels.
To make sure that you are notified once the new features are implemented, and get immediate access to my free thoughts on the market, including information not available publicly, I urge you to sign up for my free e-mail list. Sign up today and you'll also get free, 7-day access to the Premium Sections on my website, including valuable tools and charts dedicated to serious PM Investors and Speculators. It's free and you may unsubscribe at any time.
Thank you for reading. Have a great weekend and profitable week!
P. Radomski
--
Following our Subscribers' request, today we have send out / posted a Market Alert, in which we have provided our thoughts regarding the current rally - with exact targets for gold, silver, and mining stocks, and suggested action for Investors/Traders holding any of the abovementioned assets.
We encourage you to Subscribe to the Premium Service today and read this important Alert right away.
