

On Thursday, the price of black gold moved higher after the EIA weekly report showed an unexpected decline in crude oil inventories. Is this one bullish factor strong enough to push light crude higher in the following days? What did the buyers miss?
Yesterday, the Energy Information Administration reported that crude oil inventories declined by 1.6 million barrels in the week ended Feb. 16, beating expectations for a gain of around 1.8 million barrels. This first in four weeks decline in crude oil stocks in combination with a smaller than expected increase in gasoline inventories and drop in distillates supplies encouraged oil bulls to act. As a result, the price of black gold climbed to an intraday high slightly above $63, but did this increase change the short-term outlook for crude oil?
Crude Oil’s Technical Picture
Let's take a look at the chart below (charts courtesy of http://stockcharts.com).
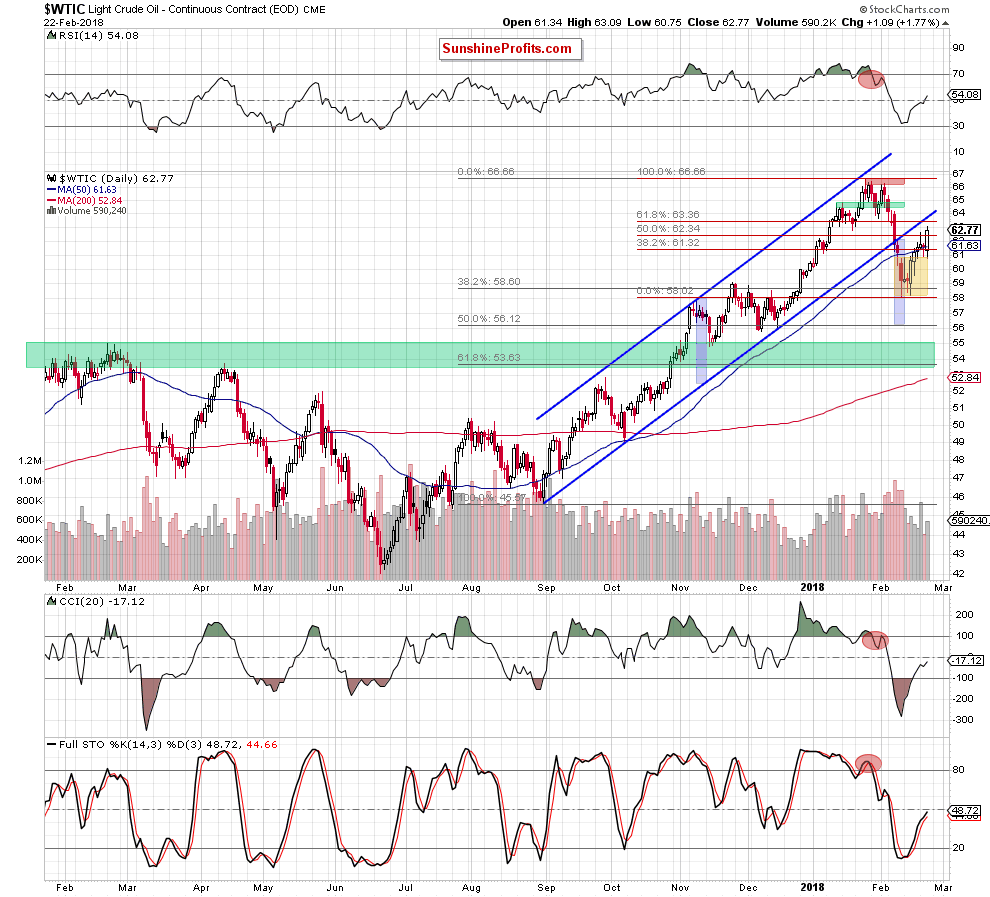
From today’s point of view, we see that the previously-broken upper border of the yellow consolidation withstood the selling pressure once again, which encouraged oil bulls to act. Thanks to their charge, the price of crude oil broke above the Tuesday's peak and closed the day above the 50% Fibonacci retracement, which is a positive development.
What does it mean for oil bears? In our opinion, nothing more than information that we can see one more upswing and a test of the 61.8% Fibonacci retracement and the previously-broken lower border of the blue rising trend channel, which is slightly above it. Such price action would be even in line with the commentary from our Tuesday's alert:
(…) please keep in mind that black gold remains below the previously-broken lower border of the black rising trend channel, which means that as long as there is no invalidation of the breakdown under this line all upswings will be nothing more than verifications of the earlier breakdown.
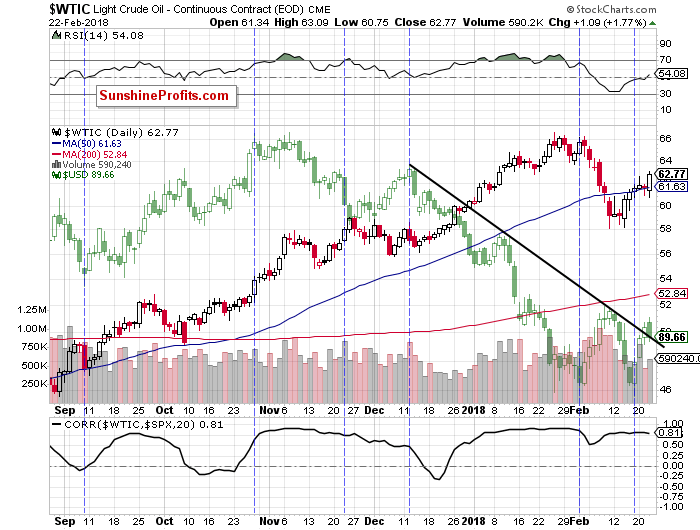
Additionally, when we look at the very short-term chart, the volume accompanying recent increases still raises some doubts about the strength of the demand side and increases the probability that reversal may be just around the corner.
Fundamental Factors and Black Gold
In our opinion, the pro-bearish scenario is also reinforced by the fundamental factors. Yesterday’s EIA data showed that the U.S. output remains above 10 million barrels per day, which keeps domestic production on track to meet the earlier estimate for an increase to 11 million barrels per day in late 2018. If American drillers will not let down, the U.S. will overtake Russia in crude oil production and become the largest global supplier. Such development will likely not please Saudi Arabia and may thwart OPEC efforts to reduce black gold’s stockpiles, increasing worries over another crude oil glut. In such an environment oil bulls could have problems keeping the price not only above $60, but also above the psychological barrier of $50.
Analyzing the current situation in the markets, we also came to the conclusion that the bulls will likely gain an additional enemy in the near future - the strengthening dollar.
As you know from our previous alerts higher values of the U.S. currency often weigh on prices of dollar-denominated commodities. For example, fuel imports for countries using other currencies become more expensive and could even limit demand.
Taking the above ino account, we decided o take a closer look at the correlation between the black gold and the greenback.
Relationship Between Crude Oil and U.S. Dollar
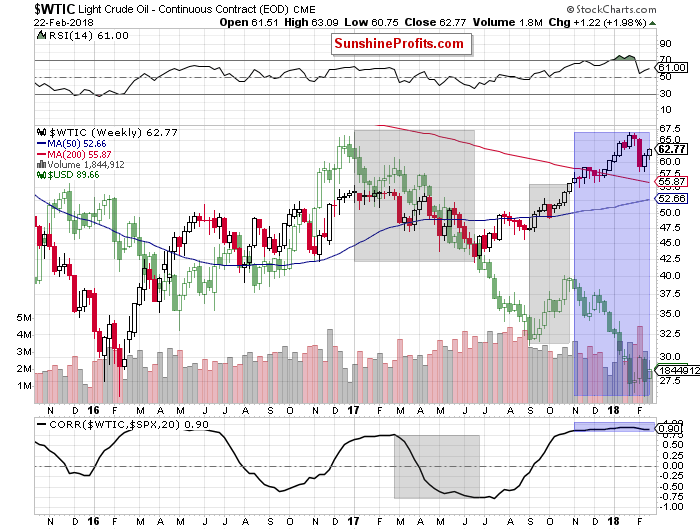
Looking at the above chart, we see that higher values of the U.S. dollar do not always translate into lower prices of light crude. Such tendency we could see in the first half of 2017 and also between September and November (we marked them with grey). In the first of the above-mentioned periods the level of correlation dropped significantly, but it started to grow steadily in the second period, which resulted in a strong negative correlation in the following months.
As you see on the chart, since November the U.S. dollar was systematically falling, which translated into higher prices of crude oil. Additionally, the recent rebound in the U.S. currency pushed black gold lower, confirming a strong dependence.
You can see this relationship more clearly on the chart below.
With the above in mind, you can ask the question: what is the future of the U.S. dollar?
Technical Picture of the USD Index
Let’s take a look at the current situation in the USD Index.
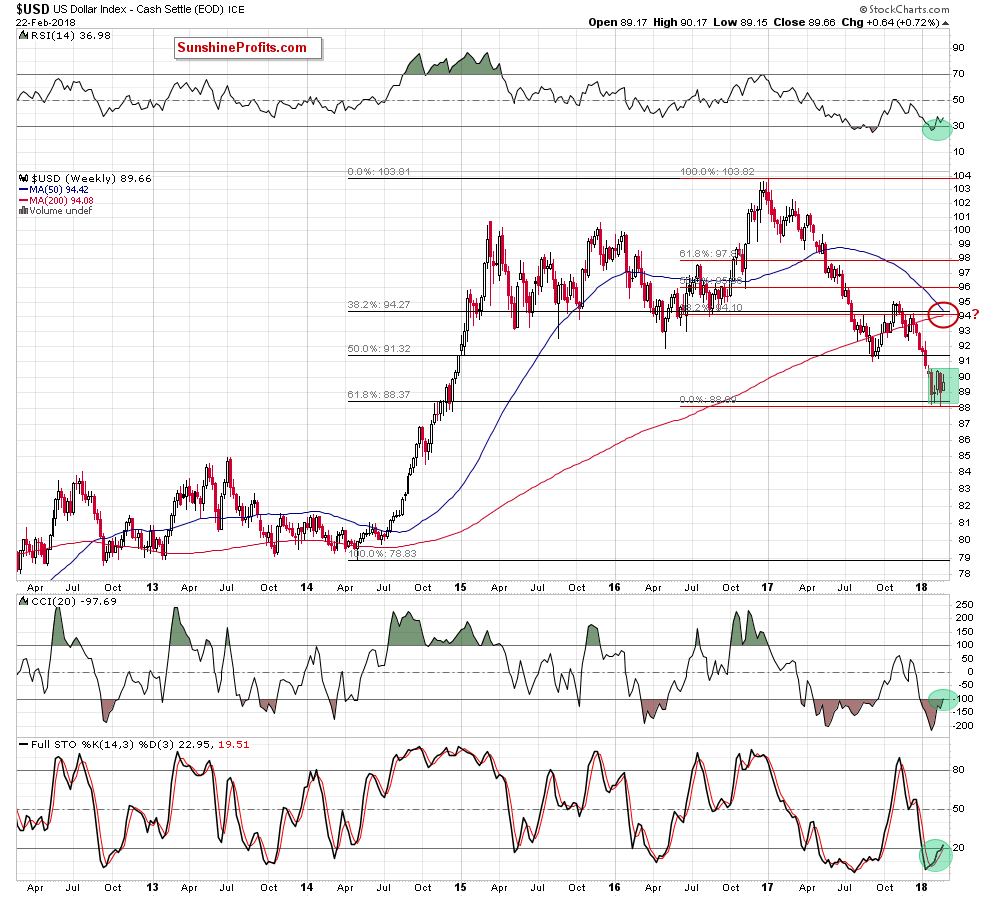
Looking at the medium-term chart, we see that the USD Index dropped to the 61.8% Fibonacci retracement (around 88.44) based on the entire 2014-2017 upward move in the previous month. Although currency bulls triggered a rebound in the following weeks, the combination of resistances encouraged their opponents to fight once again, which resulted in a re-test of this key support.
Why this retracement is so important for the greenback? Let’s take a look at the long-term chart below to find out.
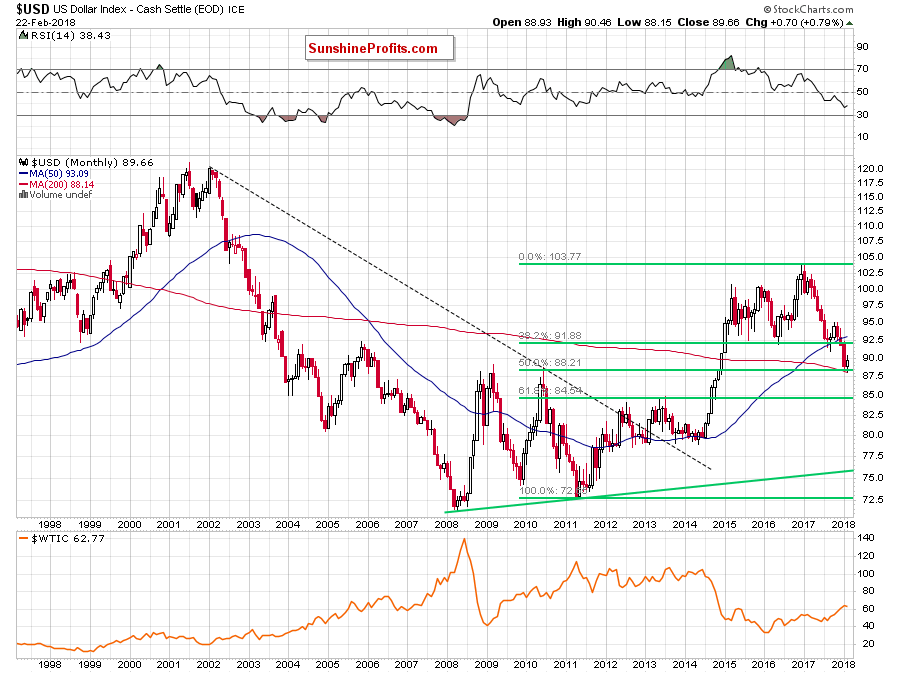
From this perspective, we see that this level/area is also reinforced by the 50% Fibonacci retracement based on the entire 2011-2017 upward move and the 200-month moving average.
This means that currency bears reached the most important fortress of the bulls and both opponents realize that if it is torn down, the road to the 2013 peaks and the next retracement will be open. With this in mind, it is not difficult to understand the increased involvement of the bulls in recent days.
Where did the last increases took the USD Index? Let’s examine the daily chart below.
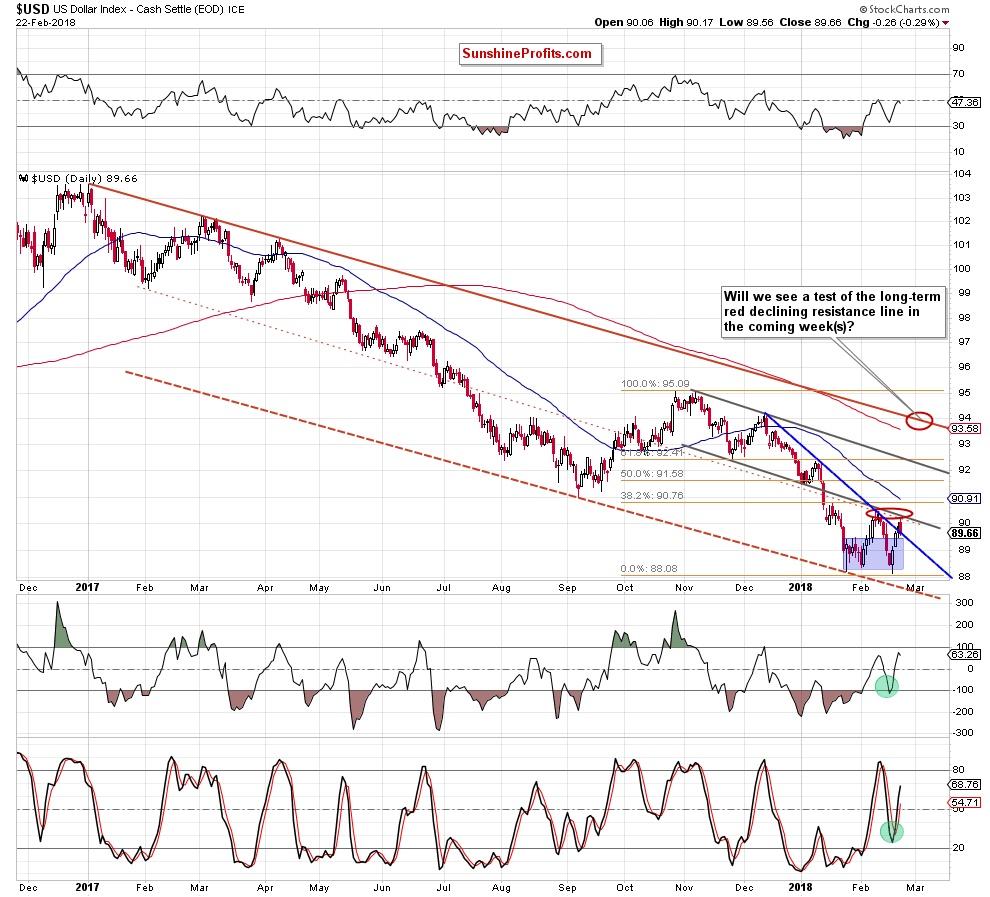
Looking at the above chart, we see that the highlight of Wednesday’s session (in terms of technical analysis) was the breakout above the short-term blue declining resistance line based on the mid-December 2017 and January 2018 peaks. It was quite bullish development – especially when we factor in the fact that this resistance line stopped the bulls at the beginning of the month, triggering a reversal and declines to a fresh 2018 low.
Yesterday, the buy signals generated by the daily indicators encouraged currency bulls to push the index higher, but the lower line of the grey declining trend channel stopped them once again, triggering a pullback. Thanks to this drop, the greenback moved to the previously-broken blue line, which looks like a verification of the earlier breakout.
If this is the case, and the index rebounds from here (which is quite likely as the buy signals remain in the cards), we’ll likely see not only a re-test of the lower grey line, but also a climb to the 38.2% Fibonacci retracement, which intersects the upper line of the green consolidation marked on the weekly chart. If the bulls manage to break above this first important resistance area, they will confirm that the worst is behind them and higher values of the greenback are just around the corner.
What could happen if the situation develop in line with this assumption? In our opinion, the USD Index will extend gains and test at least the 61.8% Fibonacci retracement and the upper border of the grey declining trend channel. Nevertheless, taking into account the buy signals generated by the medium-term indicators, it seems to us that the greenback can move even higher and test the long-term red declining resistance line seen on the daily chart (currently around 94).
What does it mean for black gold? If the recent negative correlation between crude oil and the U.S. currency remains in the cards, we should see a sizable decline in light crude in the coming weeks (or even months) – even if we see a short-lived improvement first.
If you enjoyed the above analysis and would like to receive daily premium follow-ups, we encourage you to sign up for our Oil Trading Alerts. Sign up now!.
Thank you.
Nadia Simmons
Forex & Oil Trading Strategist
Przemyslaw Radomski, CFA
Founder, Editor-in-chief, Gold & Silver Fund Manager
Gold & Silver Trading Alerts
Forex Trading Alerts
Oil Investment Updates
Oil Trading Alerts
