
Visit our archives for more gold & silver articles.
In its latest Gold Demand Trends report, the World Gold Council reports that gold buying by the world's Central Banks hit a new record of 157.5 tons, more than double the level of Q2 2011 and accounting for 16% of overall global demand. Among them are the National Bank of Kazakhstan, and the central banks of the Philippines, Russia and Ukraine. If the Central Bank buying continues at the current pace this could be a record year for Central Bank buying.
That's the good news. The bad news is the WGC estimates that global gold demand in Q2 2012 was 990.0 tons, down 7% from the demand for the yellow metal in Q2 2011.The demand in Q2 last year was exceptionally high, they point out. The main reasons for the fall are the reductions in demand for gold in both India and China over the period. In India, investment and jewelry demand has fallen mostly due to the high gold price in rupees as well as worries over a weak start to the monsoon season.
Having discussed gold briefly, let's now turn to the technical part of our update with the analysis of silver. We will start with the long-term chart (charts courtesy by http://stockcharts.com.)
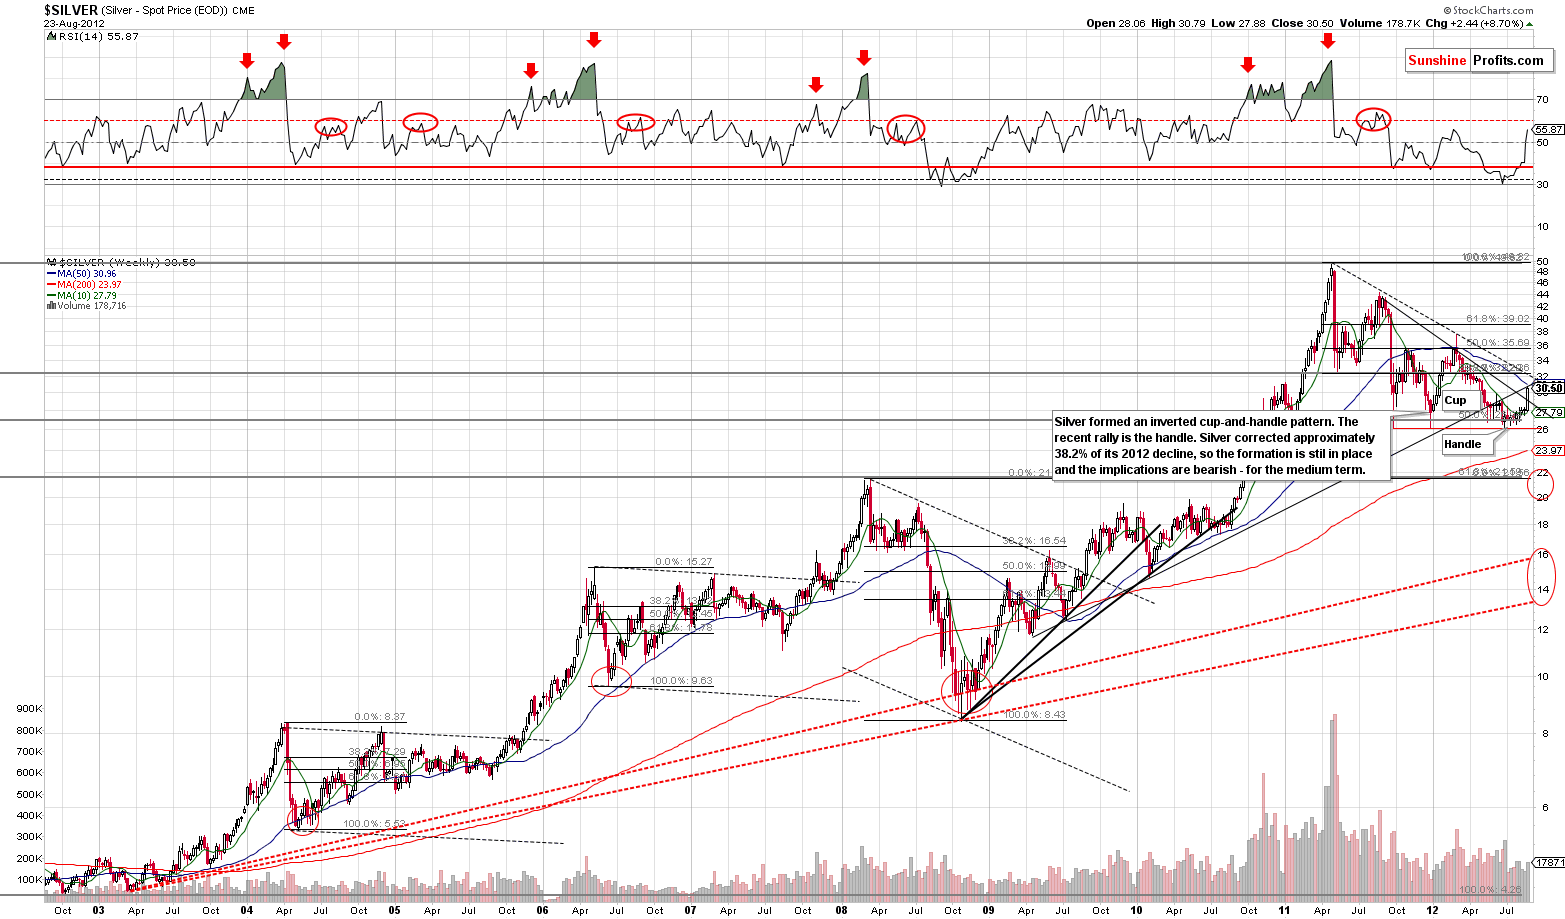
In the above chart a significant rally is seen, but it has been stopped by the medium-term resistance line and the 50-week moving average. Silver actually corrected about 38.2% of its 2012 decline (the cup portion of the inverted cup-and-handle pattern). This pattern is still in place.
Silver has shown to often be volatile and a sharp, quick move to the upside can be quickly followed by a period of disappointment. Such was the case nearly a year ago in the final months of 2011 and at the end of February 2012. Silver's price also moved very close to the 50-week moving average back then as well.
The point is that despite silver's recent strength and multiple reasons due to which it's likely to soar in the following years, it remains in a medium-term downtrend. It will remain the case until a breakout is seen.
Let's now switch perspective to the non-USD one, to further investigate the current situation in the white metal in a different way.
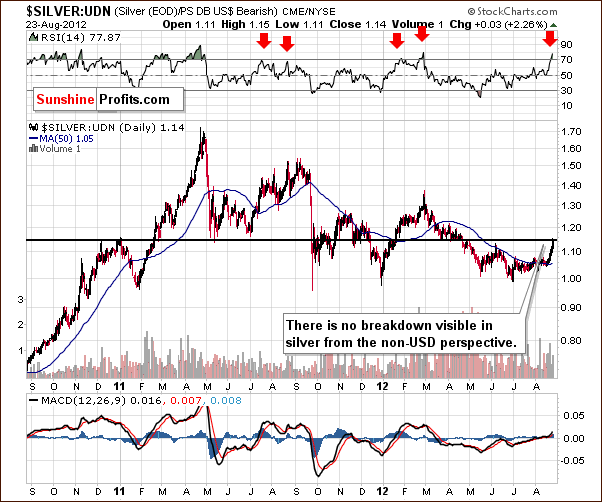
In the chart of silver from the non-USD perspective, prices are right at a resistance line and the RSI level suggests a medium-term overbought situation. The implications are therefore similar to what we discussed above – the medium-term case for silver may become bullish, but so far it hasn't.
Summing up, a lot has happened in the past several days in the white metal market but not very much has really changed from the medium-term perspective. So silver's show of strength seen in the above charts is not really a very bullish phenomenon. This is especially true when the overbought RSI levels are considered.
To make sure that you are notified once the new features are implemented, and get immediate access to my free thoughts on the market, including information not available publicly, we urge you to sign up for our free e-mail list. Sign up for our gold & silver mailing list today and you'll also get free, 7-day access to the Premium Sections on my website, including valuable tools and charts dedicated to serious PM Investors and Speculators. It's free and you may unsubscribe at any time.
Thank you for reading. Have a great weekend and profitable week!
P. Radomski
--
Let's face it - precious metals market is at a critical juncture right now. Earlier today have sent out a Market Alert in which we commented on the current situation in gold and USD Index. We invite you to join our subscribers and read the alert today .
