
This essay is based on the Premium Update posted on January 7th, 2011. Visit our archives for more gold & silver articles.
2011 is sure to be a critical year for gold with several analysts predicting an end of the bull market. It may sound very strange, but it appears that the USD Index has been leading the way for precious metals and suggests higher prices are likely to be seen soon. The general stock market may enter a consolidation phase in the near-term but has had little influence on gold, silver and mining stocks recently.
Recent declines in precious metals prices have been clearly seen from a short-term point of view. This may appear scary to some. Note, however, that if price declines are short lived, this means little to speculative long positions. Also, please keep in mind that in the past none of the major upswings ended in a consolidation pattern, which makes it less likely that the rally is completely over now.
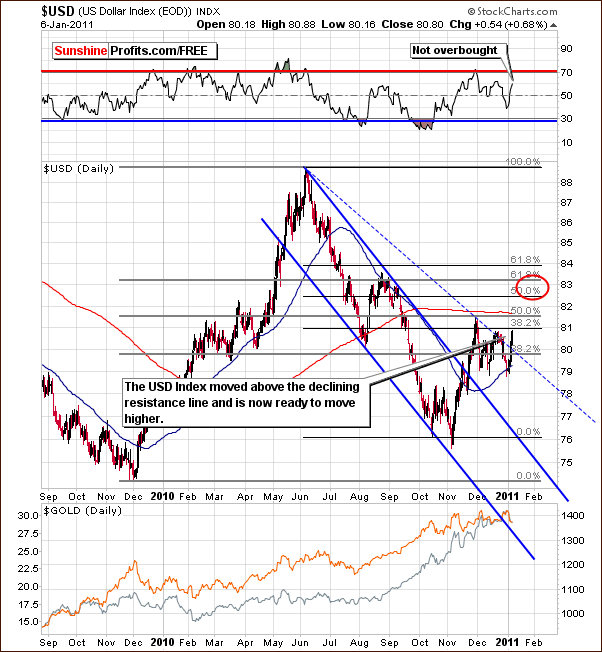
The long-term USD Index chart (charts courtesy of http://stockcharts.com) shows that the index level is currently above the declining resistance line. The consolidation has already taken place - in the 79 - 81 range, it is likely that index levels will continue to move up from where they are today - most likely to the area marked with red ellipse on the above chart.
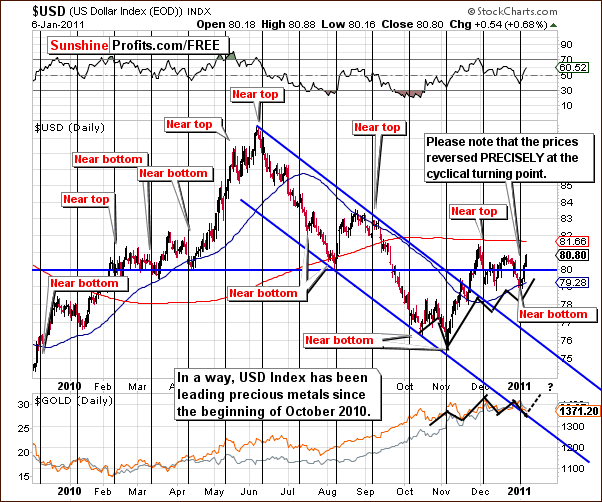
The short-term USD Index chart is perhaps the most important chart in this essay. Before moving on to the most important observation above, let's take a moment to study the cyclical turning points as they have worked almost perfectly. The recent local bottom is seen to be precisely aligned with the vertical black cyclical turning point line above.
The main point here is the USD influence on precious metals. While it is not visible in the direct way (consequently the Correlation Matrix does not reflect that), the USD Index appears to be leading precious metals. The markets are moving in the same direction although the turnaround is slightly sooner in the USD Index.
In early October, a bottom was seen and gold and silver bottomed as well. The dollar and precious metals declined in late October into early November and then rallied. Tops were reached a bit later followed by a quick decline in the USD Index and subsequent slower declines in the metals sector. Next the dollar rallied and reached a local top and precious metals soon followed.
We now have seen the dollar recover from its December decline and with precious metals having declined also, the suggestion is that they will likely recover as well. This indirect influence from the USD Index is the only real influence seen upon metals from the currency markets at this time.
Consequently, the dollar is likely to strengthen, which would coincide with a decline in euro. The 83 target level for the USD Index still appears valid and recent trends indicate that gold, silver and mining stocks are also likely to trend in the same direction as the dollar - however with a slight delay.
Correlations between gold and other key indicators show that no direct implications from the dollar or from stocks are seen upon precious metals. There is however, an indirect influence from the USD Index, which was discussed in detail in an earlier section of this essay. This provides bullish implications for gold, silver and mining stocks.
Speaking of silver, it has just been stopped by a long-term support level. Please take a look below for details.
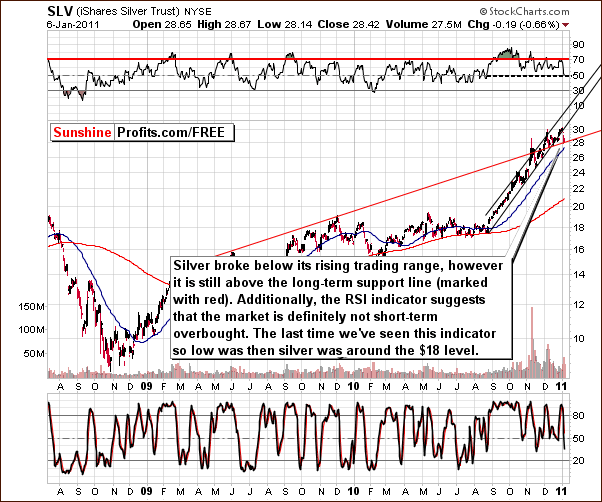 p>The first thing that comes to mind after briefly analyzing the above picture is that silvers price broke below the rising trend channel. This breakout is not seen as very significant, because the trading channel was broken to the upside several times in the past without profound implications. The price increase was stopped at a rising resistance level, noted in red in the above chart. This line is based on previous tops and is quite important since they are spread out over a long period.
The RSI is presently close to the 50 level, which is worth noting. This was last seen when silvers price was in the $18 range and a huge rally followed. If a bigger move is still to be seen in silver, then we would want to see RSI close to this level. Consequently, it seems quite likely that bigger moves to the upside will be seen for silver, much as is possible for gold and its $1,600 target. The RSI level certainly makes this option quite feasible.
Summing up, several mixed signals were seen last week but recent price declines do not appear to have bearish implications at least not yet. Other factors point to higher prices for silver and the likely influence from gold will be a bullish factor as well. Although there may seem to be increased risk with volume levels increasing and golds price declining, other signals from a technical analysis standpoint appear bullish. The target level of $1,600 still holds and the upside potential is actually even greater than what has been seen in the previous weeks. It's associated with bigger risk, so the risk to reward ratio did not change much, so Traders dont need to make significant adjustments in their positions at least not yet.
To make sure that you are notified once the new features are implemented, and get immediate access to my free thoughts on the market, including information not available publicly, I urge you to sign up for my free e-mail list. Sign up today and you'll also get free, 7-day access to the Premium Sections on my website, including valuable tools and charts dedicated to serious PM Investors and Speculators. It's free and you may unsubscribe at any time.
Thank you for reading. Have a great weekend and profitable week!
P. Radomski
--
In a week that saw gold have its biggest two day drop since February we are more cognizant than ever of a term gaining currency: Risk On Risk Off. Is hyperinflation one of the risks facing us? Are interest rates about to rise, and if so, how will that effect the price of gold?
Gold, silver, and mining stocks have declined sharply recently. Consequently, we have dedicated most of the current Premium Update (22 charts/tables) to explain what really happened - and what did not happen. The USD Index is breaking out of a declining resistance line, which does not have a significant direct influence on metals. However, there appears to be a strong indirect relationship between precious metals and the dollar, which one should take into account.
This week's Premium Update includes also our up-to-date rankings of top gold and silver juniors and the SP Long-term Junior Indicator. Additionally, we feature platinum and palladium markets. We encourage you to Subscribe to the Premium Service today and read the full version of this week's analysis right away.
