
Before I proceed with presenting you my current views on the market, I have an announcement - the Premium Service that I wrote about many times before is ready and you can test it for free. More details at the end of this essay.
As you probably already noticed, I usually prefer to take a long-term view on various key markets and see what are the general tendencies are, so that I have better idea what might influence the precious metals sector and commodities in general. Although I analyze many markets, in my essays I focus mostly on these markets that are relevant to the precious metals investors at the moment of posting that particular essay. This essay will not be an exception from that rule. Once again, I will focus on markets that influence your and my portfolio (which is generally precious-metals-oriented).
The first market that I will focus on today is the USD Index.
From the long-term point of view the U.S. Dollar has just completed or is in the process of completing the counter-trend bounce. It seems that more and more millions are printed each day to keep the system from falling apart. The powerful rallies that we have just witnessed are in my view caused by the irrational flight to safety. U.S. Dollar has long been considered "the safe currency" and many central banks, financial institutions and individual investors still perceive it as such, regardless of the true fundamental situation. At some point these entities will become aware of the fact that the assets that should be purchased with safety in mind are the precious metals, not paper dollars. However, at the time being, they either don't realize how bad the dollar's fundamentals are, or they act emotionally. Most likely both reasons are true, as there are many entities on the market. Either way, the reasons for a rising USD are temporary, just as the rebound is. I'm not saying here that we will not go higher temporarily - we may, although that seems unlikely - all I'm suggesting is that this is not the change in the main trend.
As far as the short-term is concerned, please take a look at the below chart (charts are courtesy of stockcharts.com).
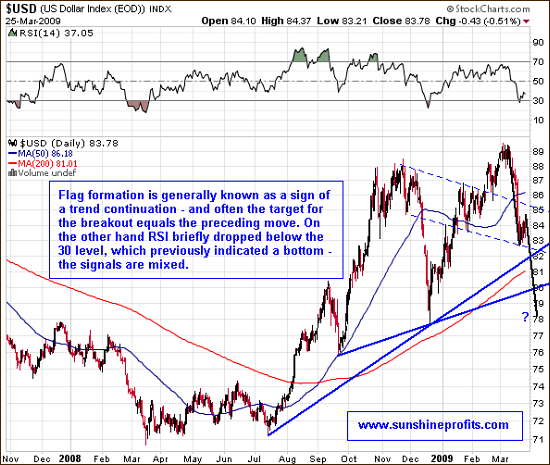
We have now a rather unclear situation on the dollar market. There are several support levels below the price (two support lines and the 200-day moving average) and it's difficult to tell which of these levels is most likely to stop the decline. We have now entered the flag formation which suggests that the drop will continue, however a brief rise would not surprise me either - especially given the signal from the RSI indicator. In sum - I believe that the breakout to the downside from the flag pattern is more probable.
The second market that one needs to keep in mind while making virtually any investment decision (especially in the short term) is the general stock market.
From the long-term point of view, the general stock market has put an important bottom already; however it is not certain that this is the final bottom. With so much overall bearishness in the media it is probable that the worst (in terms of the DJIA) is behind us, however... That does not matter much from my point of view, as I don't have any long-term positions among the "general stocks". If we get higher, PM stocks are likely to multiply DJIA's gains, because of the favorable fundamentals
On the other hand, if DJIA goes below the latest bottom and "all hell breaks loose", the precious metals stocks will still be among the strongest sectors. Please note what happened recently - PM stocks were hit hard along with other sectors, however their rebound is very sizable, especially if one compares it with the performance of the DJIA itself. Besides, precious metals market and the general stock market are often correlated in the short-run (sometimes positively, sometimes negatively), but in the long-term they move rather independently.
Moving on to the short term situation - the first thought that comes into mind after briefly looking at the below chart is that the decline has indeed been epic and that current bounce make the long-term picture bullish. However, the second look reveals that we have just broken out of the first important resistance line.
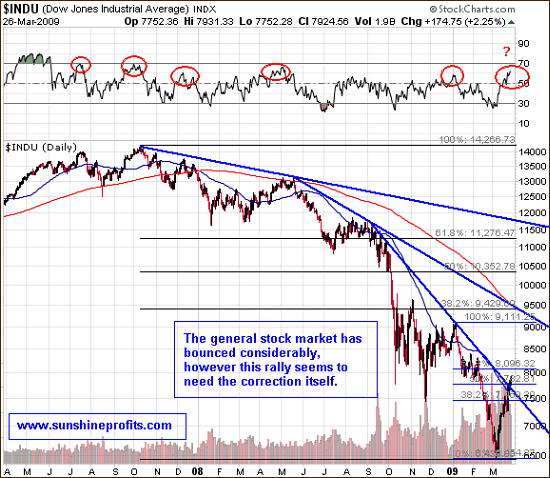
The almost 1500 point advance that took place in just three weeks is really something worth analyzing. There were a couple of times when Dow's performance has been similarly good, but it mostly resulted in another sharp decline - will this take place right now? It seems to be probable, given several signals that we currently see.
First of all we have just broken through the first of the multi-month resistance levels, and a test of this level is likely. The size/time of the rally itself is a warning sign. No market goes straight up or down (still, the final, parabolic stage of the current PM bull market will make this statement hard to believe), and since we have had an extraordinary upswing then at least a pause is to be expected. Finally, DJIA is getting close to the 61.8% Fibonacci retracement level of the previous decline. These levels often prove as a support/resistance, so it may be the case also this time. The RSI indicator has proven a fairly good indication of the local tops in the past, and it now suggests caution. We can't rule out the possibility that "this time it's different", but my own experience tells me that these are usually costly words.
The declining volume along with rising prices is not a positive sign. It means that the buying power is drying up. This is definitely bearish information, because without fresh capital entering the market, prices cannot rise. When prices cannot rise, they will either trade sideways or slide. Since the size of the rally was impressive, the latter is more probable, as momentum traders realize their gains and make the price more vulnerable to a short-term sell-off. After such an impressive rally many investors wait for any signs of weakness to take profits off the table. If price gets to these important resistance levels and bounces just a little, it may cause these investors to get out of the market, thus intensifying the decline
So, what are the implications of the above analysis for investors and speculators interested in gold- and silver stocks?
The interesting thing about the PM stocks today is that they have a mix of resistance lines a few dollars above yesterday's closing price (taking GDX ETF as a proxy for the sector). Please take a look at the chart below:
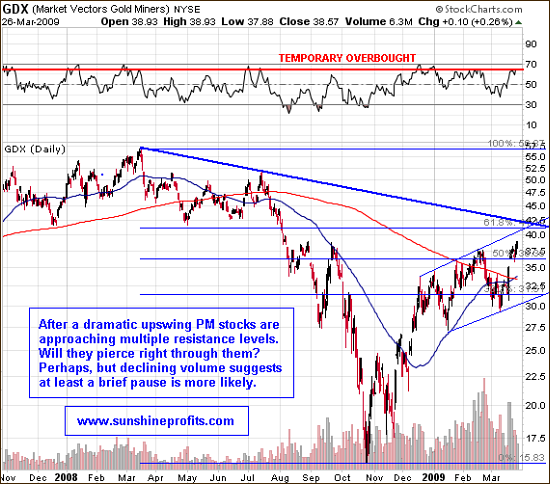
Although mining companies have particularly favorable fundamentals, there are many similarities between price patterns in GDX and in the DJIA. This time the 61.8% Fibonacci retracement level is calculated based on the whole 2008 decline, not only on the recent downswing, as it is the case with DIA. Still, implications are similar. The next resistance level that needs to be taken into account is the long-term resistance (thick) line and the short-term (thin) one. All of these levels point to the same area, which makes it even more likely to stop this upswing - at least for a while.
Summing up, it is not out of the question that PM stocks will correct sharply only to soar in the following weeks, just as it took place in December 2008. However, for now it seems that we are approaching a local top.
As mentioned earlier, this is the basic version of our Premium Update. Register today to read the full (about 3x longer, including much more details) version without making any payment. You will additionally gain one day of access to our Charts, Tools, and much more. This is a risk-free, full-access trial of our Premium Service and you may unregister anytime. When the trial is over, you will still receive occasional, brief alerts regarding current market events - it's a win-win situation!
P. Radomski
Back