

“Some things never change. Some things do.” You might be wondering why we are quoting one of the lines from the Matrix movie. The reason is because that’s exactly what we can say about the gold market and the price patterns in it. The thing that never changes is the fact that gold will always somehow react to the fundamental news, but the way it reacts will vary over time. Moreover, this quote could describe the situation with the current analogies and price patterns in gold, silver and mining stocks. Because of the trade-war-based rally, they changed, but something didn’t. The outlook that they imply.
Let’s take a closer look at the patterns, starting with gold (chart courtesy of http://stockcharts.com).
Gold’s Upcoming Reversal
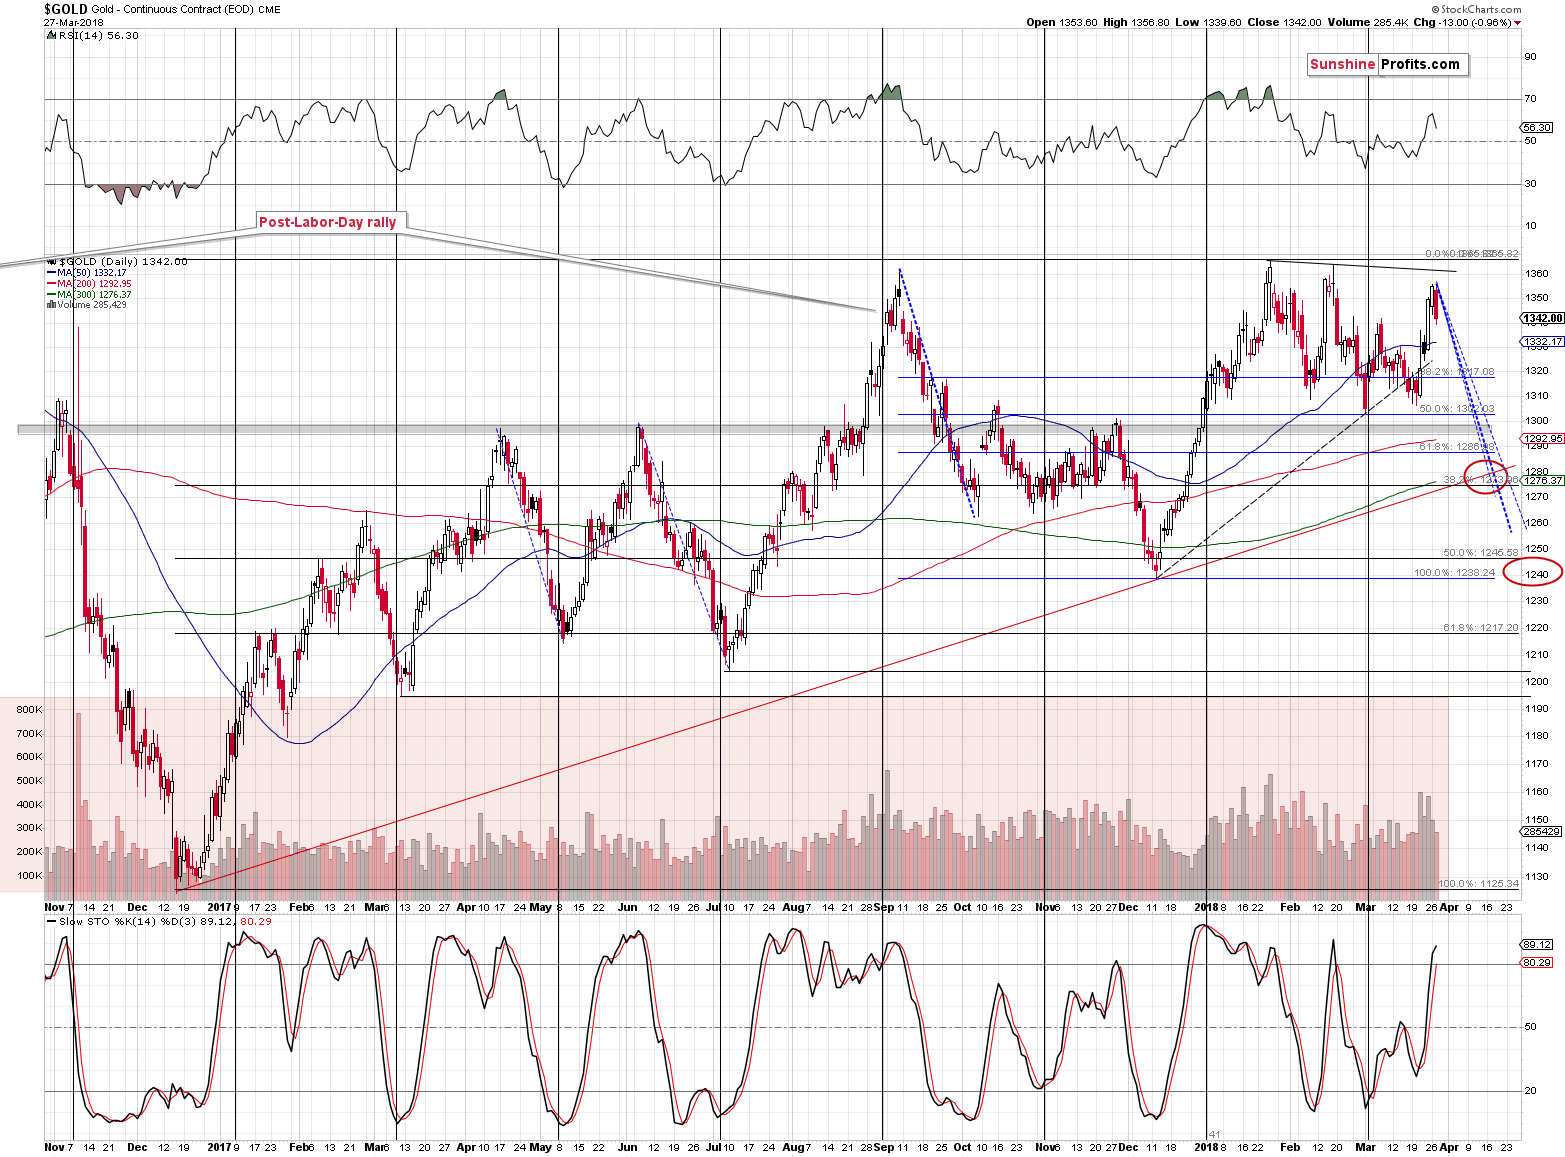
The final implication based on the above chart didn’t change. Gold is still likely to decline from the current price levels and it’s likely to form a bottom close to the April 9th, as that’s where we have a triple reversal date confirmed by apex reversal triangles.
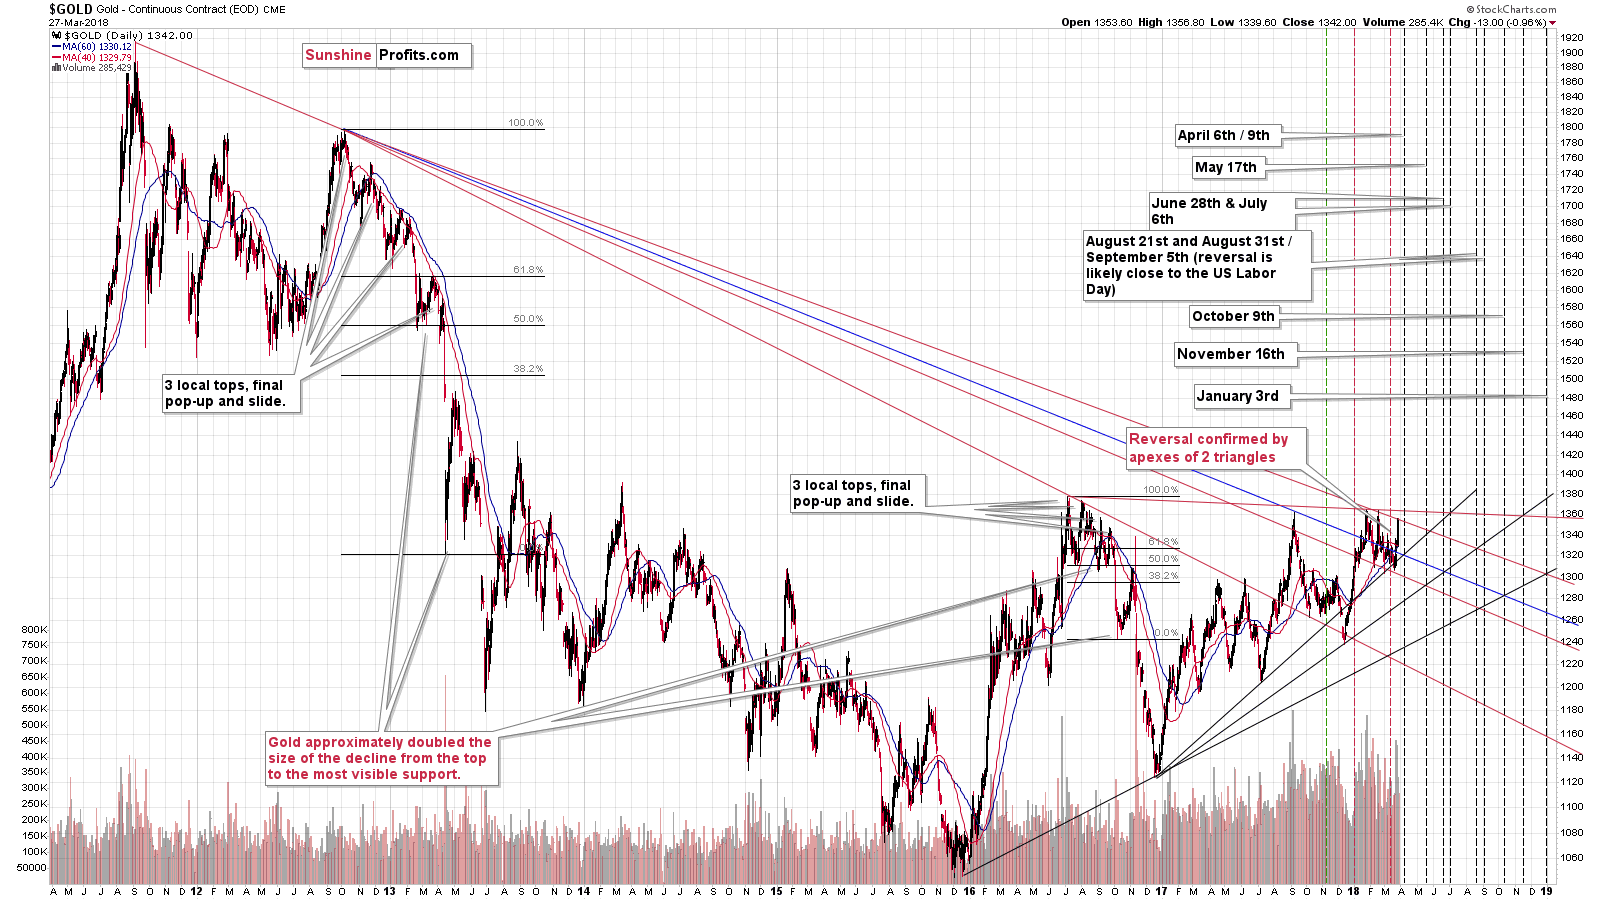
The triple top analogy seems to remain intact and the implications are bearish. Just like the third major top in early September 2017 ended the consolidation and started the decline, it seems that we saw an important high this week.
Each high is lower than the preceding one, which is in tune with what we saw in mid-2017 and during the 2012-2013 time frame. Indeed, the similarity to the previous patterns remains in place and the implications are bearish.
All in all, not much changed in the case of the above gold charts. The two remaining charts that feature silver and mining stocks will be more interesting, though.
Silver Changes and Lack Thereof
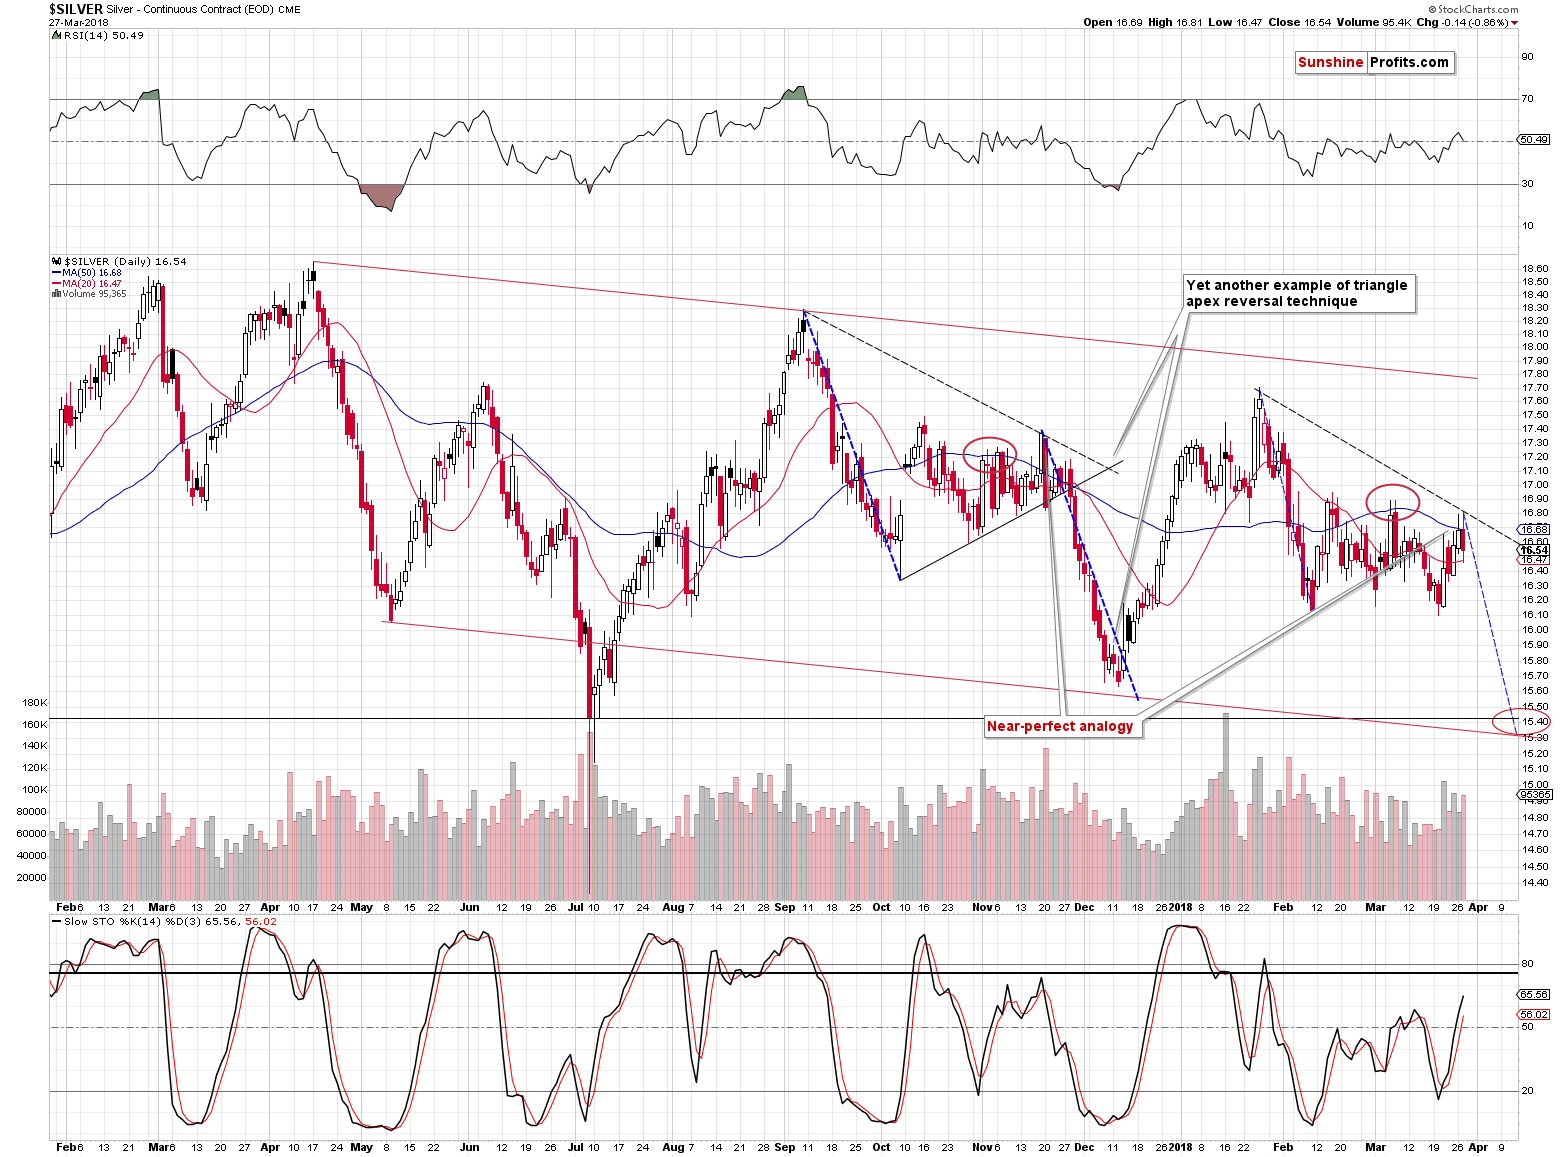
The particularly noteworthy thing on the white metal’s chart is the way in which we can view the self-similar pattern between now and back in November 2017. After the early-March volatile daily upswing, we thought that it was a direct analogy to the mid-November upswing that had been the final rally before the decline. And this might have been the case but based on the fundamental news (Powell-related uncertainty and trade conflict) gold rallied and thus silver more or less had to rally as well. Consequently, the pattern changed, but not completely. The pattern still seems to be intact, but in a slightly different way.
You see, there were actually three smaller tops in October and November 2017 before silver started to slide – if we count the early-November high as well. The early-March high was the second top and we’re seeing the third – and most likely final – top right now. In fact, it seems that we already saw it this week. Silver moved above the 50-day moving average and once again invalidated this move almost instantly. It’s moving lower also during today’s pre-market trading.
Consequently, even though silver’s self-similar pattern is slightly different, it still has the same bearish implications.
Self-similarity in Gold Stocks
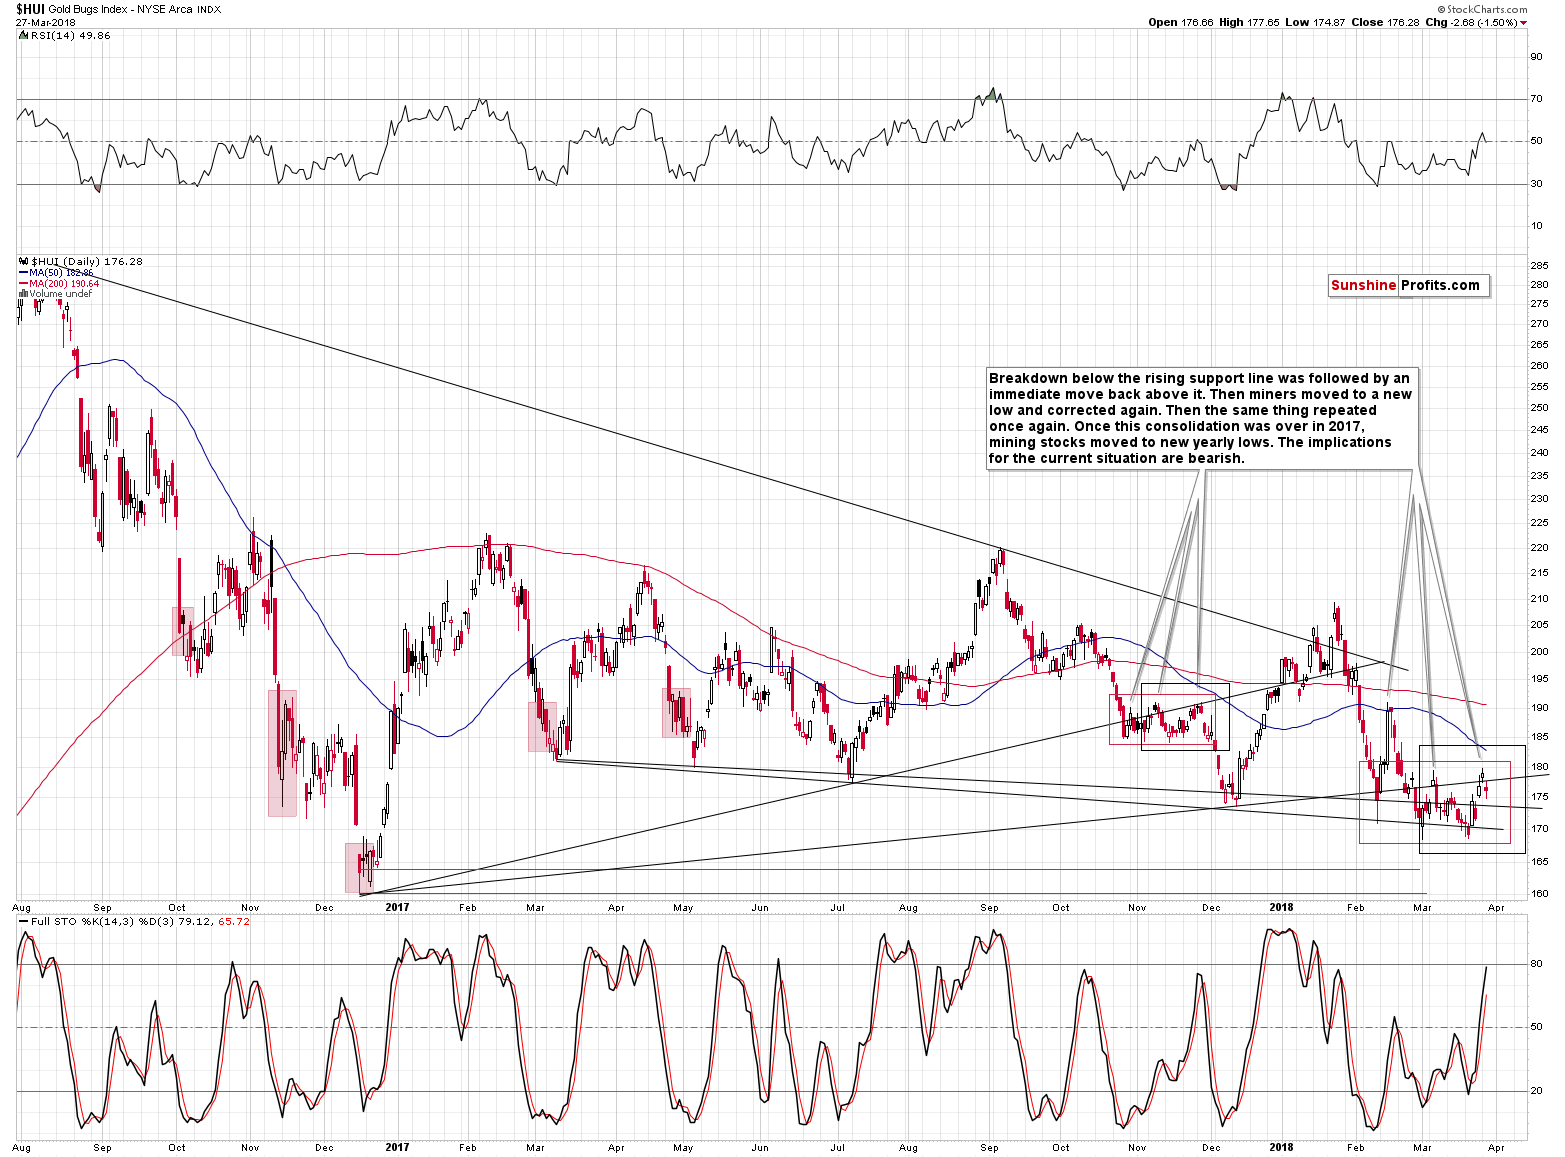
Interestingly, gold stocks seem to be forming a self-similar pattern of their own. In the case of the HUI Index, the thing that we see is a similarity between the current consolidation and the consolidation that we saw in November 2017, which confirms the analogy in the silver market.
Back in late October 2017, gold miners broke below the rising support line that’s based on the late 2016 bottom and one of the 2017 bottoms. In February 2018, gold miners broke below the rising support line that’s based on the late 2016 bottom and another 2017 bottom.
Both breakdowns were followed by an immediate move higher. The February comeback was huge and several times bigger than the late-October rally, but that’s most likely due to the triangle-apex-based reversals that were pointing to major reversals at that time (for both the bottom and the top).
Yes, the apex-based reversals can be that efficient, which is exactly why we dedicated one of the previous weekends to estimating all the apex-based reversals for the rest of the year.
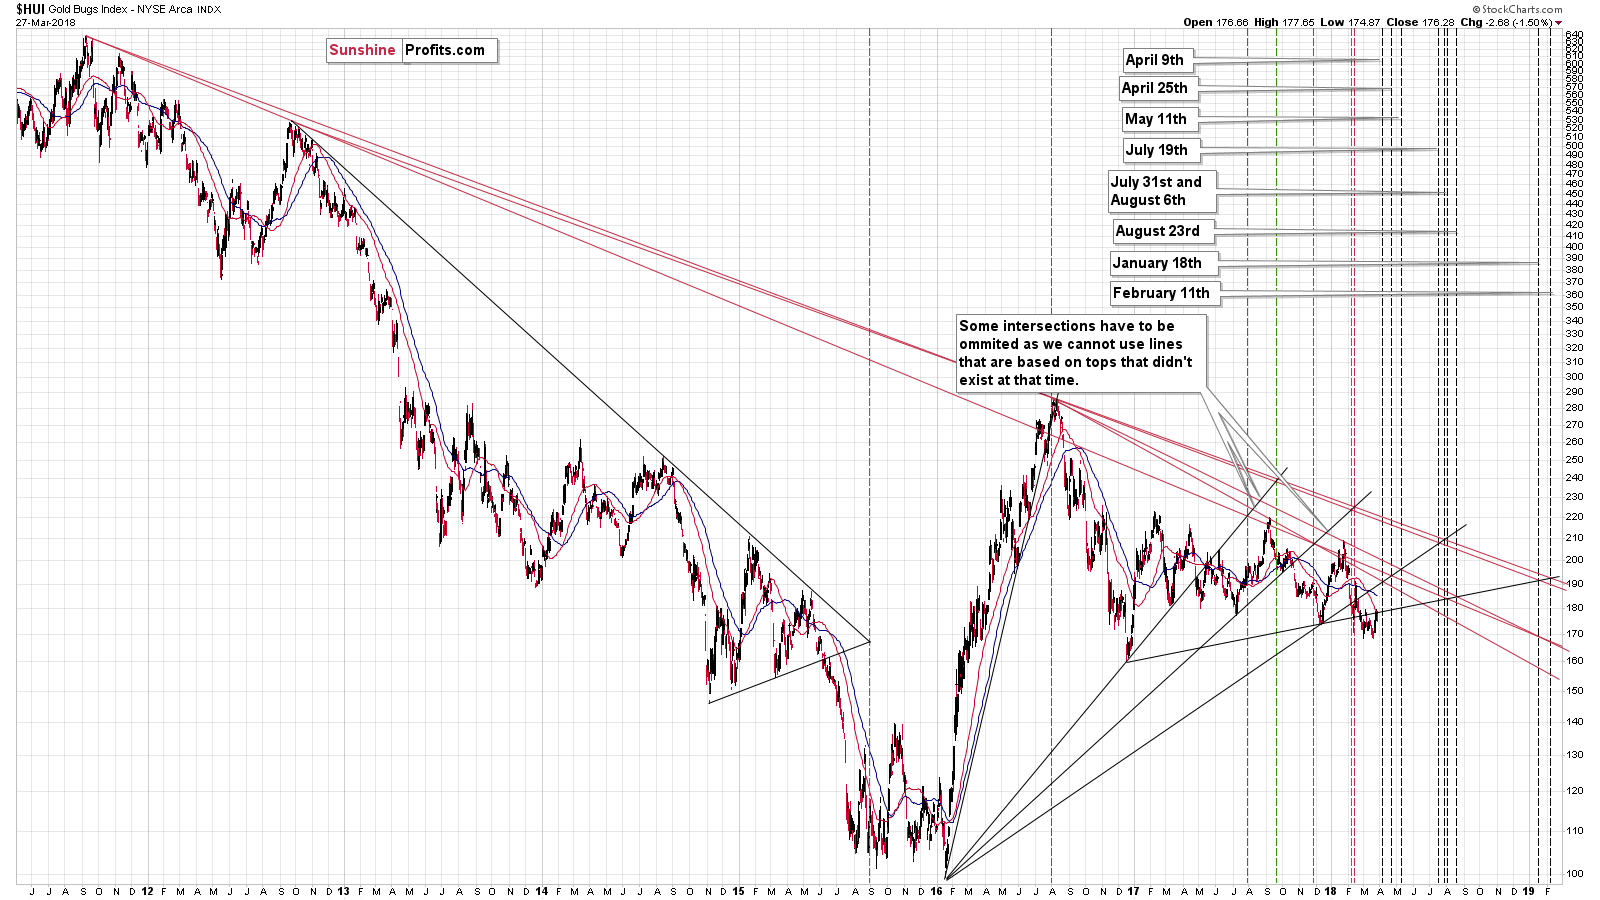
On the above chart you can see both reversals marked with green and red dashed lines.
Moving back to the current self-similar pattern in gold stocks, in both cases after the initial rally and move back above the rising support line, the HUI declined once again and formed a new short-term low. Then we saw another rally, more or less to the previous high, and a subsequent decline. That’s the action that we saw most recently and that’s exactly what preceded the bigger decline in early December 2017. Naturally, the implications of this self-similar pattern are bearish.
Summary
Summing up, based on the trade conflict between the U.S. and China, gold, silver and mining stocks moved higher recently, but it didn’t change the implications of the key short- and medium-term analogies. The long-term signals were not invalidated either and thus the overall outlook for the following weeks remains bearish.
Naturally, the above is up-to-date at the moment of publishing it and the situation may – and is likely to – change in the future. If you’d like to receive follow-ups to the above analysis (including the intraday ones, when things get hot), we invite you to subscribe to our Gold & Silver Trading Alerts.
Thank you.
Sincerely,
Przemyslaw Radomski, CFA
Founder, Editor-in-chief, Gold & Silver Fund Manager
Gold & Silver Trading Alerts
Forex Trading Alerts
Oil Investment Updates
Oil Trading Alerts
