

Oil Trading Alert originally sent to subscribers on March 21, 2016, 11:32 AM.
Trading position (short-term; our opinion): No positions are justified from the risk/reward perspective.
On Friday, crude oil lost 1.30% after unexpected increase in U.S. oil rig counts. As a result, light crude slipped under $42 and closed the day under the previously-broken 61.8% Fibonacci retracement. What’s next for the commodity?
On Friday, crude oil moved higher after the market’s open and hit a fresh 206 high of $42.49. Despite this improvement, the commodity gave up some gains after Baker Hughes' report showed that U.S. oil rigs rose by one to 387, breaking a 12-week streak of drops. Thanks to this news, light crude slipped under $42 and closed the day under the previously-broken 61.8% Fibonacci retracement. What’s next for the commodity? Let’s examine charts (charts courtesy of http://stockcharts.com).
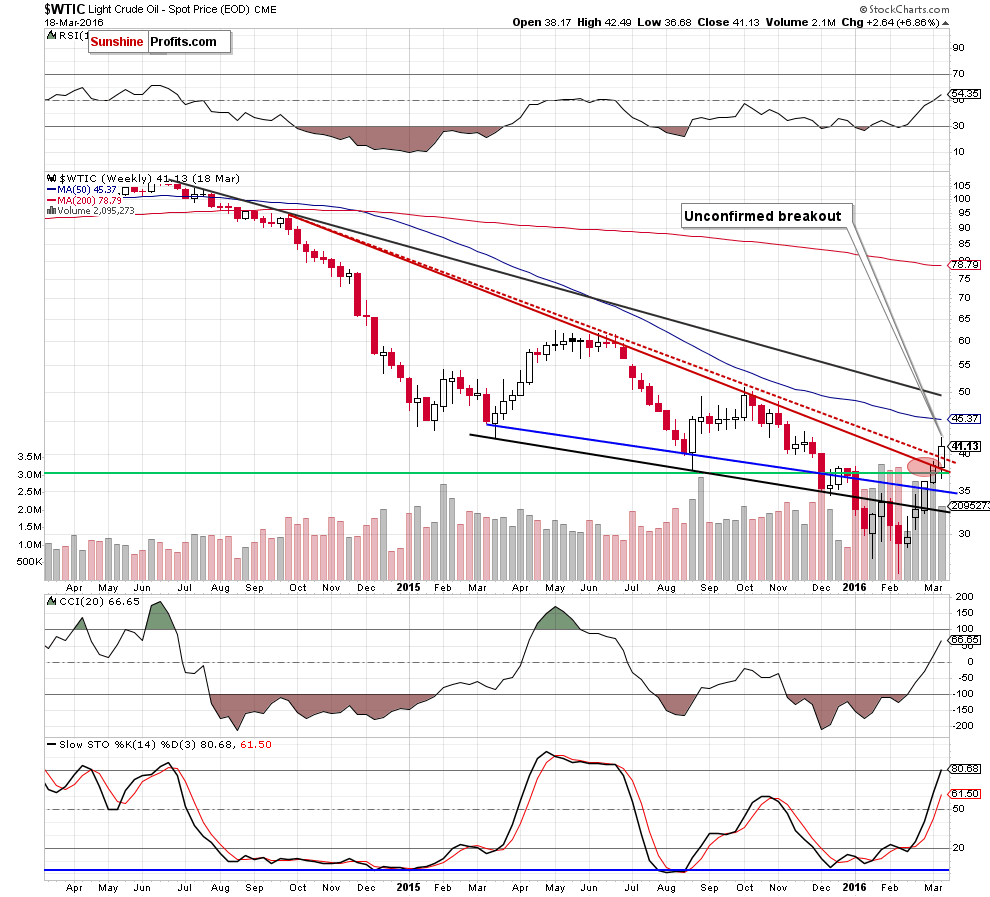
Looking at the above charts, we see that the overall situation is a bit unclear. On one hand, crude oil broke above both medium-term declining resistance lines and hit a fresh 2016 high, which is a bullish signal. On the other hand, when we take a closer look at the weekly chart, we notice that the size of volume that accompanied last week’s increase wasn’t significant and much smaller than week earlier, which suggests that oil bulls' strength may begin to wane.
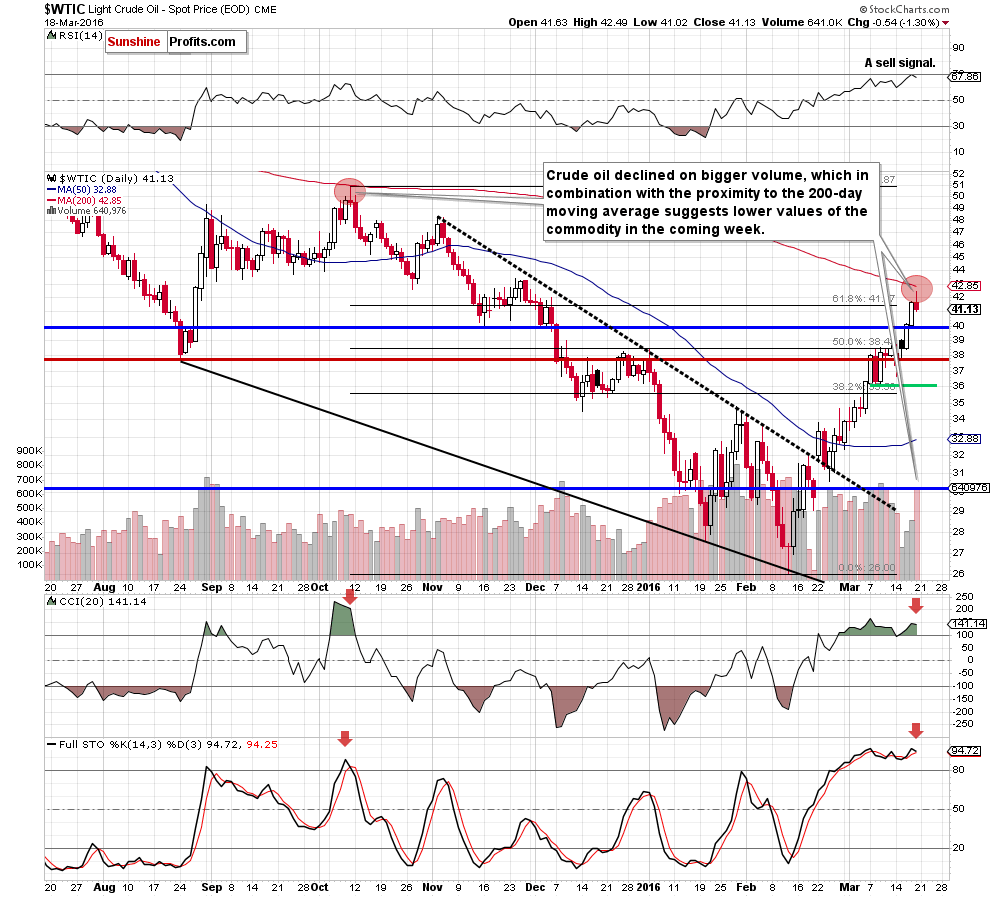
Additionally, when we focus on the daily chart, we see that Friday’s increase approached the commodity to the 200-day moving average – similarly to what we saw in Oct. Back then, this important resistance stopped further improvement and triggered a sizable downward move that took light crude under $30. On top of that, Friday’s pullback invalidated earlier breakout above the 61.8% Fibonacci retracement, which is an additional negative signal.
Are there any other bearish factors? As you see on the daily chart, the RSI generated a sell signal (for the first time in more than seven months), while the CCI and Stochastic Oscillator remain overbought. There are also negative divergences between them and the price of light crude, which suggests that the probability of a reversal increases with each passing trading day. The last, but not less important factor is the size of Friday’s volume. As you see, it was huge compared to the volume that we saw during recent increases, which suggests that oil bulls may not be as strong as it seems at the first sight.
Finishing today’s alert, we’ll take a look at the relationship between crude oil and silver.
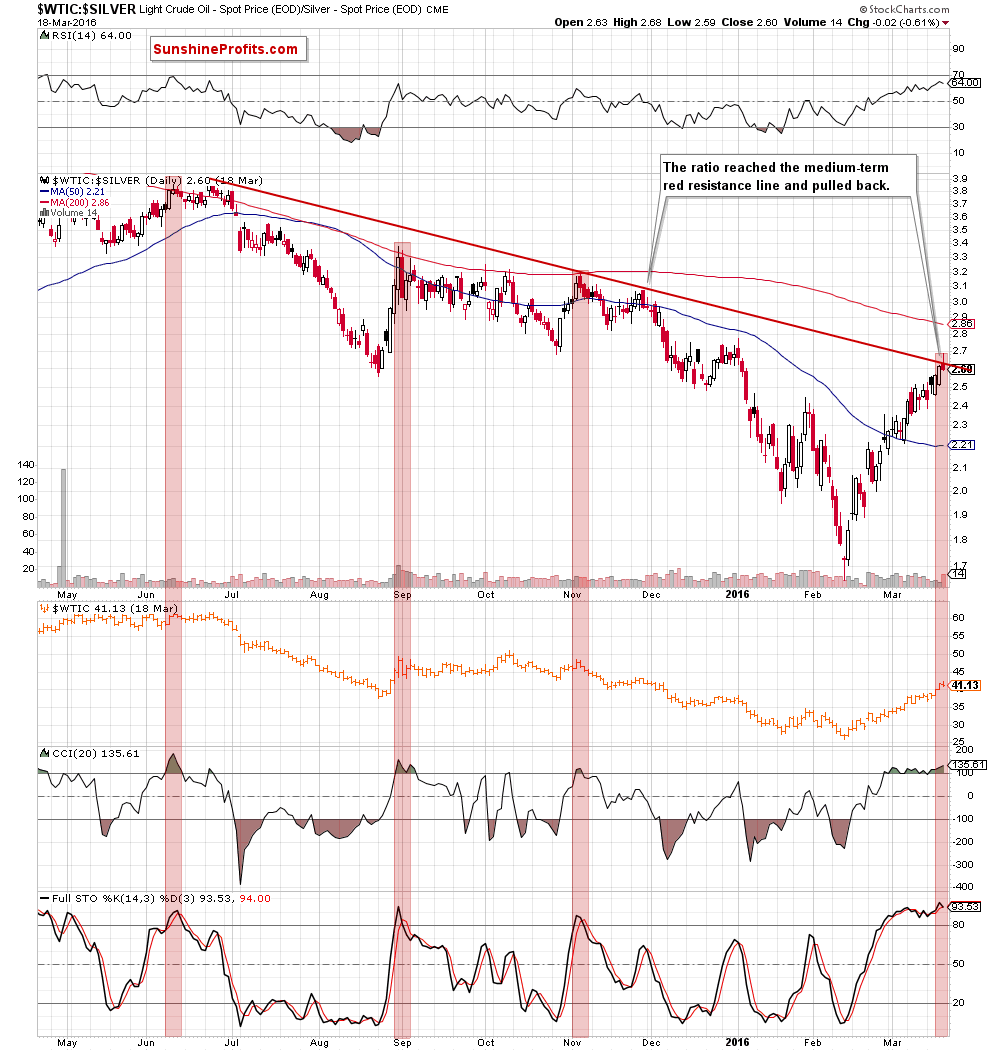
Looking at the daily chart, we see that the recent upward move took the ratio to the medium-term red declining line based on the Jun and Nov highs. As you see, this resistance was strong enough to stop further improvement in late Nov, which translated into sizable declines in the following months. On Friday, the above-mentioned line stopped the ratio once again, which resulted in a pullback and invalidation of earlier small breakout above this line, which doesn’t look bullish.
Additionally, when we focus on the current position of the CCI and Stochastic Oscillator, we see that both indicators were similarly overbought only several times since May. In all previous cases, such high readings preceded sizable downward moves, which suggests that anther bigger decline in the ratio is just around the corner. What does it mean for crude oil? As you see on the above chart, lower values of the ratio corresponded to declines in the commodity in the past (the last move to the upside in the ratio corresponded to the rally in light crude), which suggests that if this relationship remains in place, we’ll see lower prices of crude oil in the coming weeks.
What about silver? Although there was a negative correlation between the ratio and the metal in the second half of February, positive correlation returned at the beginning of this month (and continues), which suggests that reversal of the ratio will translate into lower values of the metal in the coming days. Nevertheless, if you would like to know more about silver as an investment, we encourage you to sign up for Gold & Silver Trading Alerts or the All-Inclusive Package that includes it.
Summing up, although crude oil closed the previous week above both medium-term resistance lines, the last week’s upward move materialized on tiny volume, which in combination with the proximity to the 200-day moving average, an invalidation of the breakout above the 61.8% Fibonacci retracement, the current situation in the oil-to-silver ratio and the position of daily indicators (in light crude and the ratio) could encourage oil bears to act and result in a reversal in the coming week.
Very short-term outlook: mixed with bearish bias
Short-term outlook: mixed with bearish bias
MT outlook: mixed
LT outlook: mixed
Trading position (short-term; our opinion): No positions are justified from the risk/reward perspective. We will keep you – our subscribers – informed should anything change.
As a reminder – “initial target price” means exactly that – an “initial” one, it’s not a price level at which we suggest closing positions. If this becomes the case (like it did in the previous trade) we will refer to these levels as levels of exit orders (exactly as we’ve done previously). Stop-loss levels, however, are naturally not “initial”, but something that, in our opinion, might be entered as an order.
Since it is impossible to synchronize target prices and stop-loss levels for all the ETFs and ETNs with the main market that we provide this level for (crude oil), the stop-loss level and target price for popular ETN and ETF (among other: USO, DWTI, UWTI) are provided as supplementary, and not as “final”. This means that if a stop-loss or a target level is reached for any of the “additional instruments” (DWTI for instance), but not for the “main instrument” (crude oil in this case), we will view positions in both crude oil and DWTI as still open and the stop-loss for DWTI would have to be moved lower. On the other hand, if crude oil moves to a stop-loss level but DWTI doesn’t, then we will view both positions (in crude oil and DWTI) as closed. In other words, since it’s not possible to be 100% certain that each related instrument moves to a given level when the underlying instrument does, we can’t provide levels that would be binding. The levels that we do provide are our best estimate of the levels that will correspond to the levels in the underlying assets, but it will be the underlying assets that one will need to focus on regarding the sings pointing to closing a given position or keeping it open. We might adjust the levels in the “additional instruments” without adjusting the levels in the “main instruments”, which will simply mean that we have improved our estimation of these levels, not that we changed our outlook on the markets.
Thank you.
Nadia Simmons
Forex & Oil Trading Strategist
Przemyslaw Radomski, CFA
Founder, Editor-in-chief
Gold & Silver Trading Alerts
Forex Trading Alerts
Oil Investment Updates
Oil Trading Alerts
