
Oil Trading Alert originally sent to subscribers on May 7, 2014, 11:00 AM.
Trading position (short-term; our opinion): Speculative short positions in crude oil seem to be justified from the risk/reward perspective.
On Tuesday, crude oil gained 0.48% as a weaker dollar and ongoing concerns over tensions between Russia and Ukraine weighted on the price. Thanks to these circumstances, the price of light crude climbed above $100 once again. Did this show of “strength” invalidate any of bearish technical factors that we noticed in the previous week?
Yesterday, before the market’s open, the U.S. dollar moved lower after positive euro-zone economic data. Although, the euro zone's service-sector PMI came in unchanged at 53.1 (in line with expectations), retail sales rose 0.3% in March, beating expectations for a 0.2% contraction. Additionally, later in the day, the greenback extended losses after official data showed that the U.S. trade deficit narrowed to $40.38 billion in March, from $41.87 billion in February, while analysts had expected the trade deficit to narrow to $40.30 billion in March.
As is well known, a weaker greenback makes oil an attractive commodity on dollar-denominated exchanges, which is bullish for the commodity. Therefore, a sharp decline in the U.S. currency pushed light crude above $100. Despite this improvement, another expected increase in U.S. oil supplies capped gains and sent the price lower. How low? Let's see (charts courtesy of http://stockcharts.com).
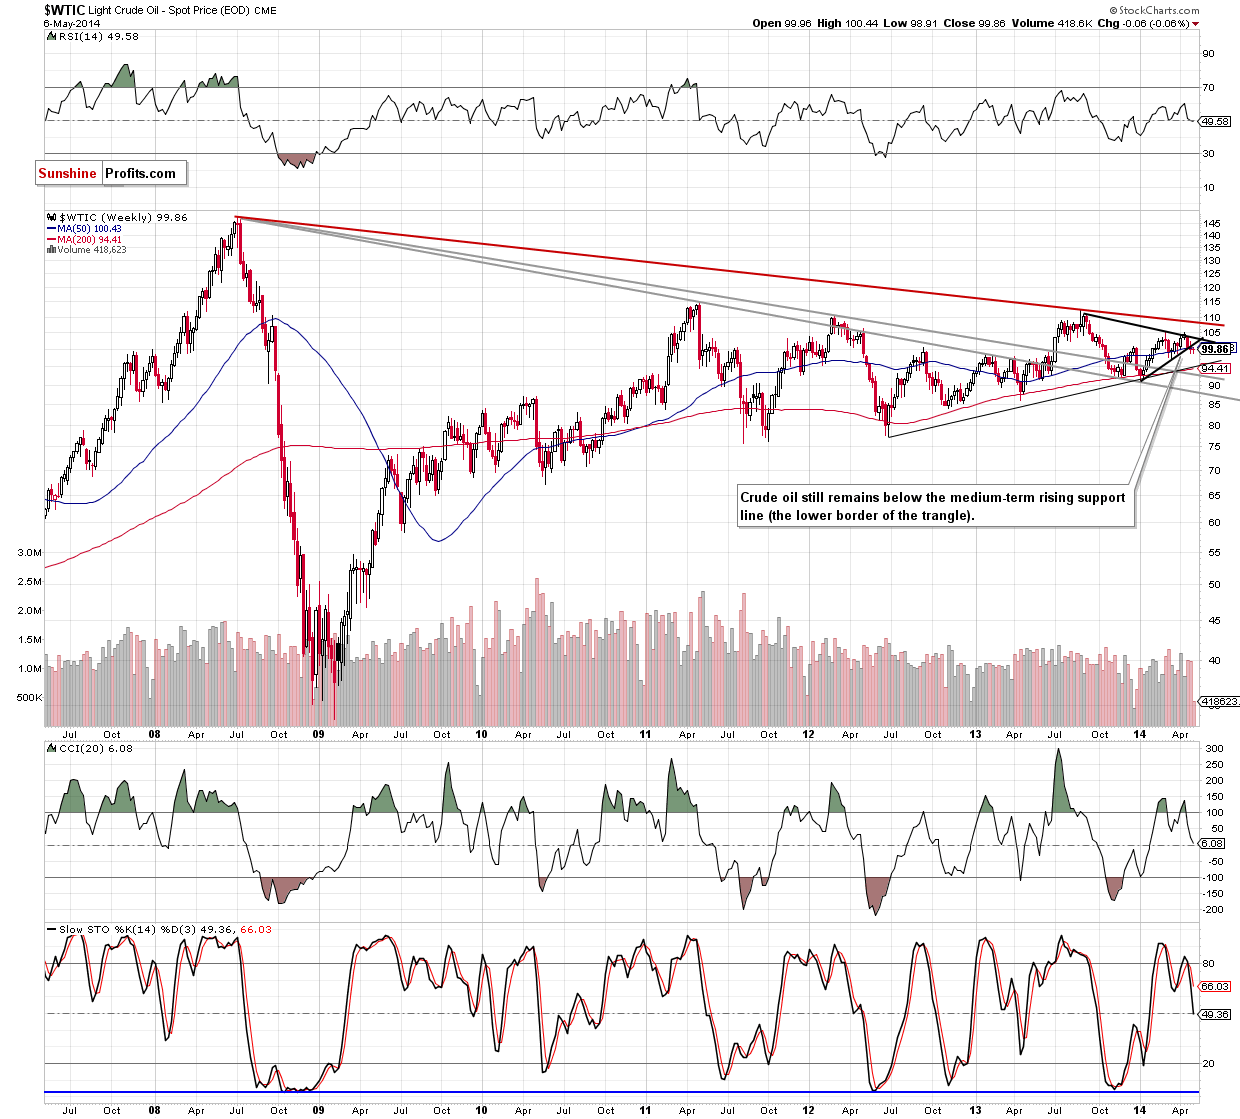
From the weekly perspective, we see that the situation remains unchanged and crude oil is still trading below the lower border of the triangle, the psychological barrier of $100 and the 50-week moving average. Therefore, the bearish scenario from our Oil Trading Alert posted on Wednesday is still up-to-date:
(…) if the commodity extends losses and drops below the psychological barrier of $100, we will likely see further deterioration and a drop even to around $95, where the medium-term support line (based on the June 2012 and January 2014 lows) is. At this point, it’s worth noting that the CCI and Stochastic Oscillator generated sell signals, which suggests that another attempt to move lower should not surprise us.
Did the situation in the short term change after yesterday’s session? Let’s zoom in on our picture and find out.
Quoting our previous Oil Trading Alert:
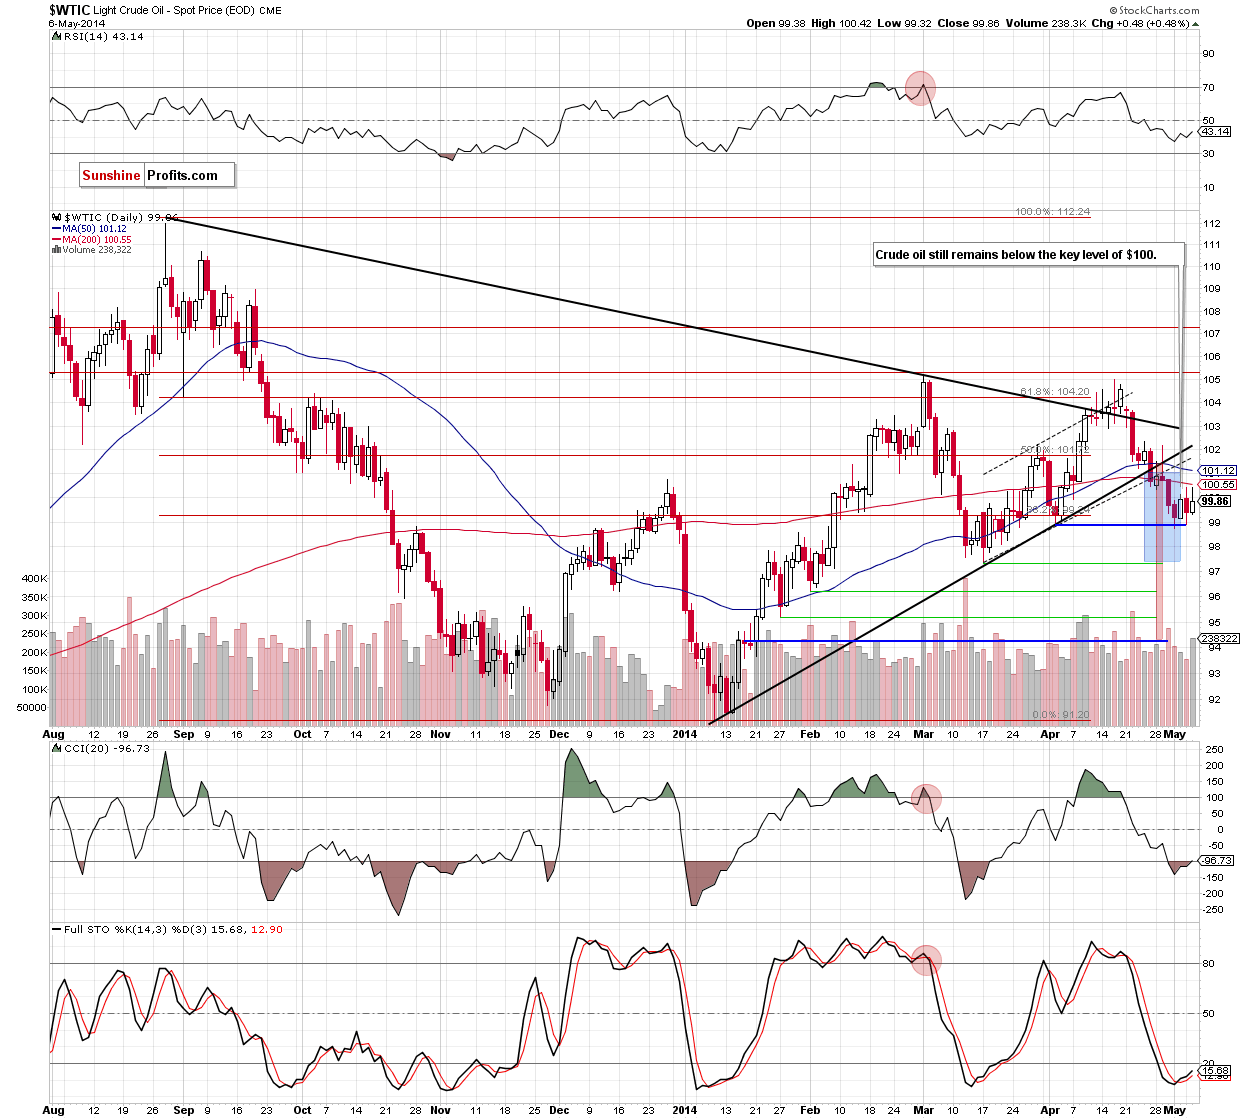
(…) light crude dropped to the bottom of the correction that we saw at the turn of March and April once again. If history repeats itself and this support level holds, we may see a corrective upswing in the coming days and the first upside target will be the (…) 200-day moving average (currently at $100.59).
As you see on the daily chart, we noticed such price action yesterday. Although crude oil moved higher, this strong resistance line successfully stopped further improvement for the second time in a row. In reaction to this show of weakness, oil investors pushed the sell button once again and light crude came back below the level of $100. Taking this fact into account, we remain bearish and see this upswing as another verification of the breakdown. If this is the case, and crude oil drops below Thursday low, we think that the price will likely drop to one of downside targets that we discussed in our previous Oil Trading Alert:
(…) In the case of the breakdown under the lower border of the trend channel, declines may push the price to around $97, where the size of the downswing will correspond to the height of the formation. Nevertheless, in our opinion, the confirmation of the breakdown below the medium-term line is more important because it suggests an even bigger move. of its implication. In this case, the correction may be deeper and take light crude to around $94.20. At this point, it’s worth noting that the first downside target is supported by the March low of $97.37 and the latter corresponds to the 78.6% Fibonacci retracement based on the entire Jan.-March rally.
Summing up, although crude oil moved higher once again, this improvement was only temporarily and didn’t change anything in the very short-term picture. As it turned out, the 200-day moving average capped the gains for the second time in a row and serves as the nearest important resistance at the moment. Consequently, in our opinion, as long as there in no invalidation of the breakdown below the previously-broken important resistance lines and the key level of $100, further deterioration in the coming days (or even weeks) is likely.
Very short-term outlook: bearish
Short-term outlook: bearish
MT outlook: mixed
LT outlook: mixed
Trading position (short-term): Short. Stop-loss order: $102.50. We will keep you informed should anything change, or should we see a confirmation/invalidation of the above.
Thank you.
Nadia Simmons
Forex & Oil Trading Strategist
Przemyslaw Radomski, CFA
Founder, Editor-in-chief
Gold & Silver Trading Alerts
Forex Trading Alerts
Oil Investment Updates
Oil Trading Alerts
