

Oil Trading Alert originally sent to subscribers on September 9, 2015, 8:40 AM.
Trading position (short-term; our opinion): Short positions with a stop-loss order at $54.12 and initial (!) target price at $35.72 are justified from the risk/reward perspective.
Yesterday we wrote about the crude oil’s inability to move higher despite a drop in the number of U.S. oil rigs (first time in six weeks) and saw another sign of weakness in the black gold – the latter didn’t manage to rally despite a visible move higher in the general stock market. Is oil really poised to plunge?
In short, that seems to be the situation. An invalidation of the previous breakout is a major bearish event and crude oil’s recent weakness seems to confirm it. Let’s take a look at the details (charts courtesy of http://stockcharts.com).
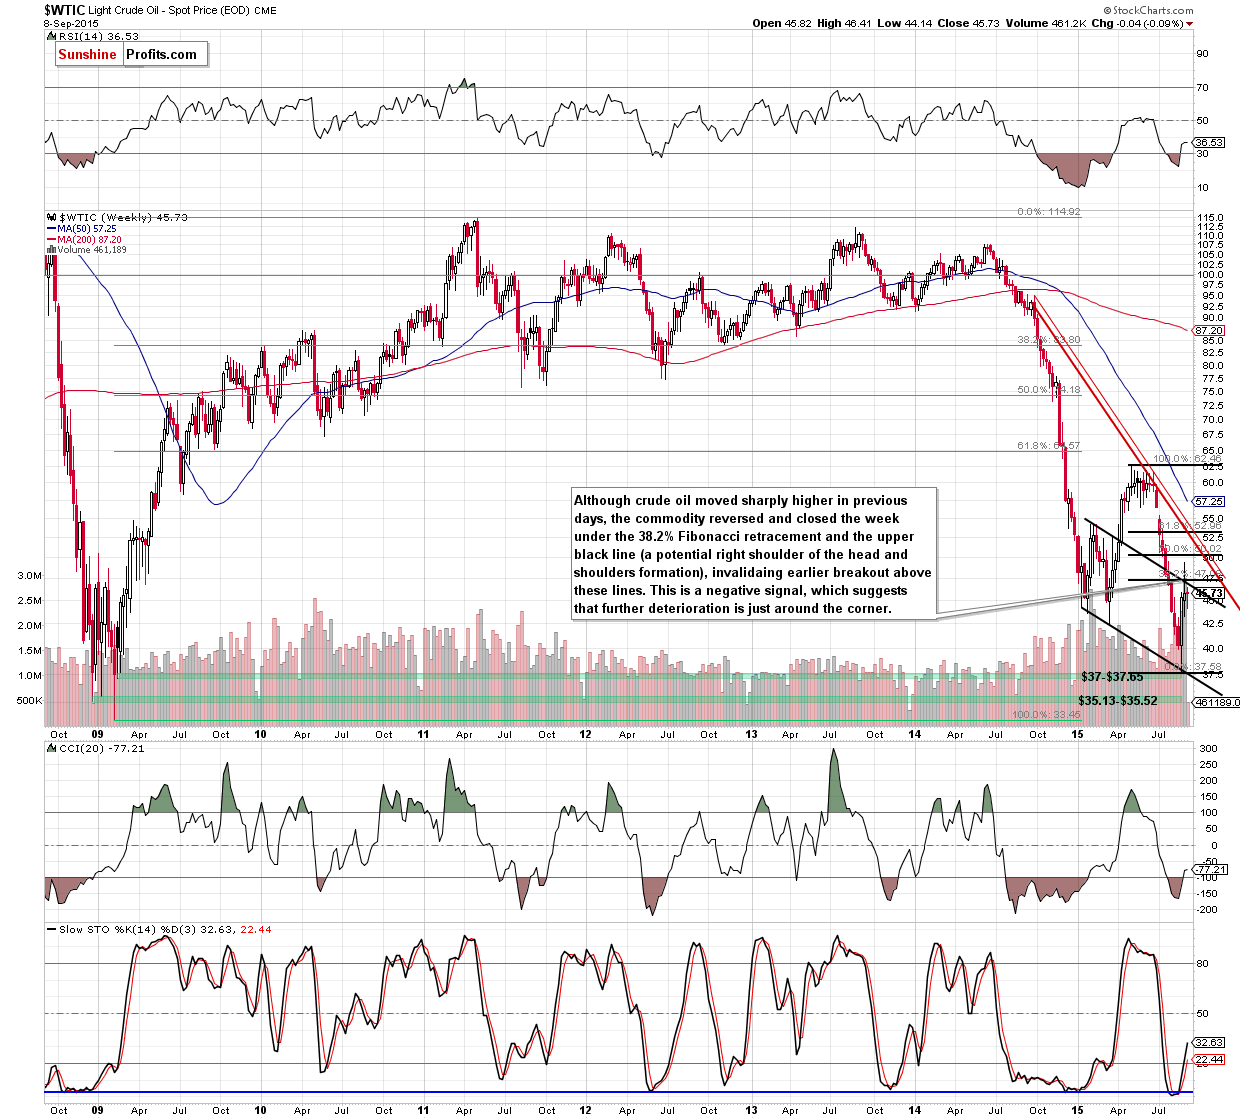
The attempt to move to the declining resistance line and the 38.2% Fibonacci retracement level failed and crude oil is now visibly below both levels. We see positive action in the Stochastic indicator, but, based on our experience, the invalidation is more important.
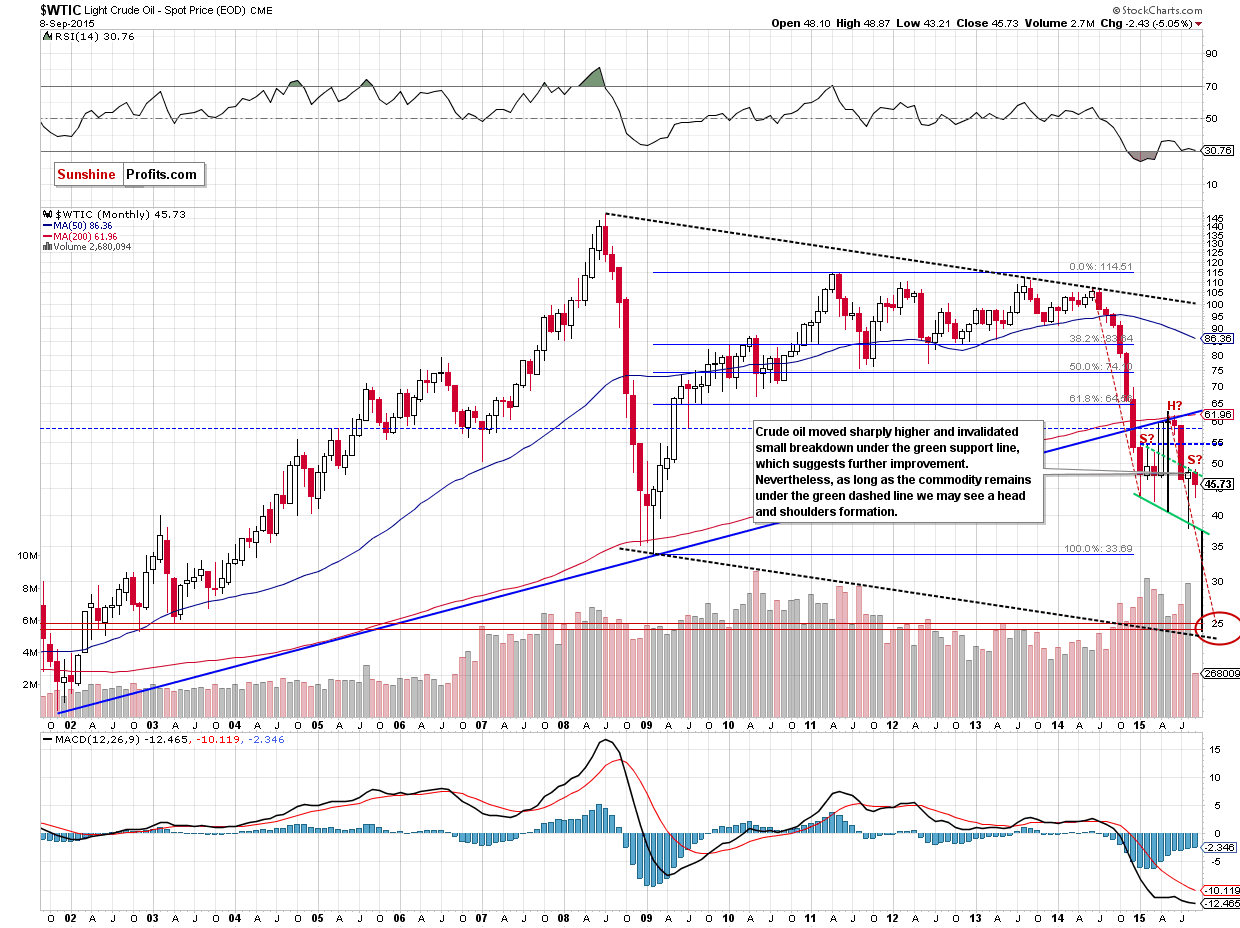
This is especially the case given the long-term picture, in which we see that the crude oil’s rally that we saw earlier was just a verification of the breakdown below the rising long-term support line (in this case, there was no invalidation).
Basically, everything that we wrote on the above chart and on crude oil’s outlook in yesterday’s alert remains up-to-date:
(...) it seems quite likely that crude oil will slide all the way down to more or less $25 dollars and there are multiple reasons for it:
- The breakdown below the key long-term rising support line (marked with blue) was confirmed and verified – this year’s rally didn’t take crude oil back above it – the line proved to be strong resistance. This by itself doesn’t imply a target level at a certain point, but it strongly suggests that crude oil has to fall much lower, before the decline is over.
- The symmetry of major declines: the 2008 slide is the only decline that is really similar to the current one, and in order for this similarity to be upheld (history repeats itself to a considerable extent), crude oil would have to move even a bit below $25. On the above chart you can see that in the form of the declining dashed black lines.
- The symmetry between the 2014 slide and the (likely) current decline. This year we have definitely seen some kind of consolidation (which might still turn out to be a bottom, but that is unlikely in our view) and the move that follows a consolidation is very often similar to the one that preceded it. If you look at the red dashed declining lines on the above chart you’ll notice that for the previous decline to repeat, crude oil would have to move to about $25.
- Speaking of the consolidation, it’s taking the form of a head-and-shoulders pattern and once / if the pattern is completed, we will have a pattern-based target at around $25. The reason is that once price breaks below the “neck level”, it’s likely to decline as much as the size of the “head” in the pattern.
- The late-2002 and 2003 bottoms create strong support at those levels.
The amount of signals that points to $25 as the most likely target is uncanny, which makes it quite reliable.
Yes, there also are the 2008 and 2009 lows, but generally not much (if anything) confirms them as a major target, so they might not be able to generate anything more than a short-lived bounce (if anything at all).
We would like to stress that the above is what we believe as most likely based on today’s prices and it can change in the following days or weeks. Of course we’ll keep you – our subscribers – updated.
Summing up, the medium-term outlook for the black gold remains bearish, and this week’s weak performance (despite a move higher in the main stock indices) seems to confirm it. We think that short positions (which are already profitable as we entered them when crude oil was at about $46.68) continue to be justified from the risk/reward point of view.
Very short-term outlook: bearish
Short-term outlook: bearish
MT outlook: bearish
LT outlook: mixed with bearish bias
Trading position (short-term; our opinion): Short positions with a stop-loss order at $54.12 (yes, that far as the medium-term outlook is unlikely to change as long as crude oil stays below the declining medium-term resistance line) and initial (!) target price at $35.72 are justified from the risk/reward perspective. We will keep you – our subscribers – informed should anything change.
Thank you.
Nadia Simmons
Forex & Oil Trading Strategist
Przemyslaw Radomski, CFA
Founder, Editor-in-chief
Gold & Silver Trading Alerts
Forex Trading Alerts
Oil Investment Updates
Oil Trading Alerts
