
Oil Trading Alert originally sent to subscribers on April 30, 2014, 8:36 AM.
Trading position (short-term; our opinion): No positions are justified from the risk/reward perspective.
On Tuesday, crude oil came back above $102 on ongoing concerns that tensions between Russia and the West could lead to stronger sanctions and disturb exports from Russia. However, the commodity erased earlier gains as disappointing data and prospects for increased exports from Libya weighted on the price. Thanks to these circumstances, light crude closed the day below important medium-term line once again. Will the consequences of this event be bearish enough to push the price below the key level of $100?
Yesterday, the violence in Ukraine escalated as pro-Russian separatists stormed government buildings in eastern city of Luhansk. The attacks on police headquarters, administration building, prosecutor's office and television broadcasting facilities came despite a new wave of sanctions on Russia by the U.S. and European Union and marked the biggest advance for the pro-Russia rebels since early April. In reaction to these circumstances, the price of crude oil moved higher and temporarily came back above $102.
Despite this increase, the commodity reversed after disappointing data. Yesterday, the Conference Board showed that its consumer confidence index dropped to 82.3 this month from a 83.9 in March (while analysts had expected a drop to 83.0 in April), fueling concerns that the largest oil consuming nation may demand less fuel and energy than once anticipated.
Having discussed the above, let’s move on to the technical changes in the crude oil market (charts courtesy of http://stockcharts.com.)
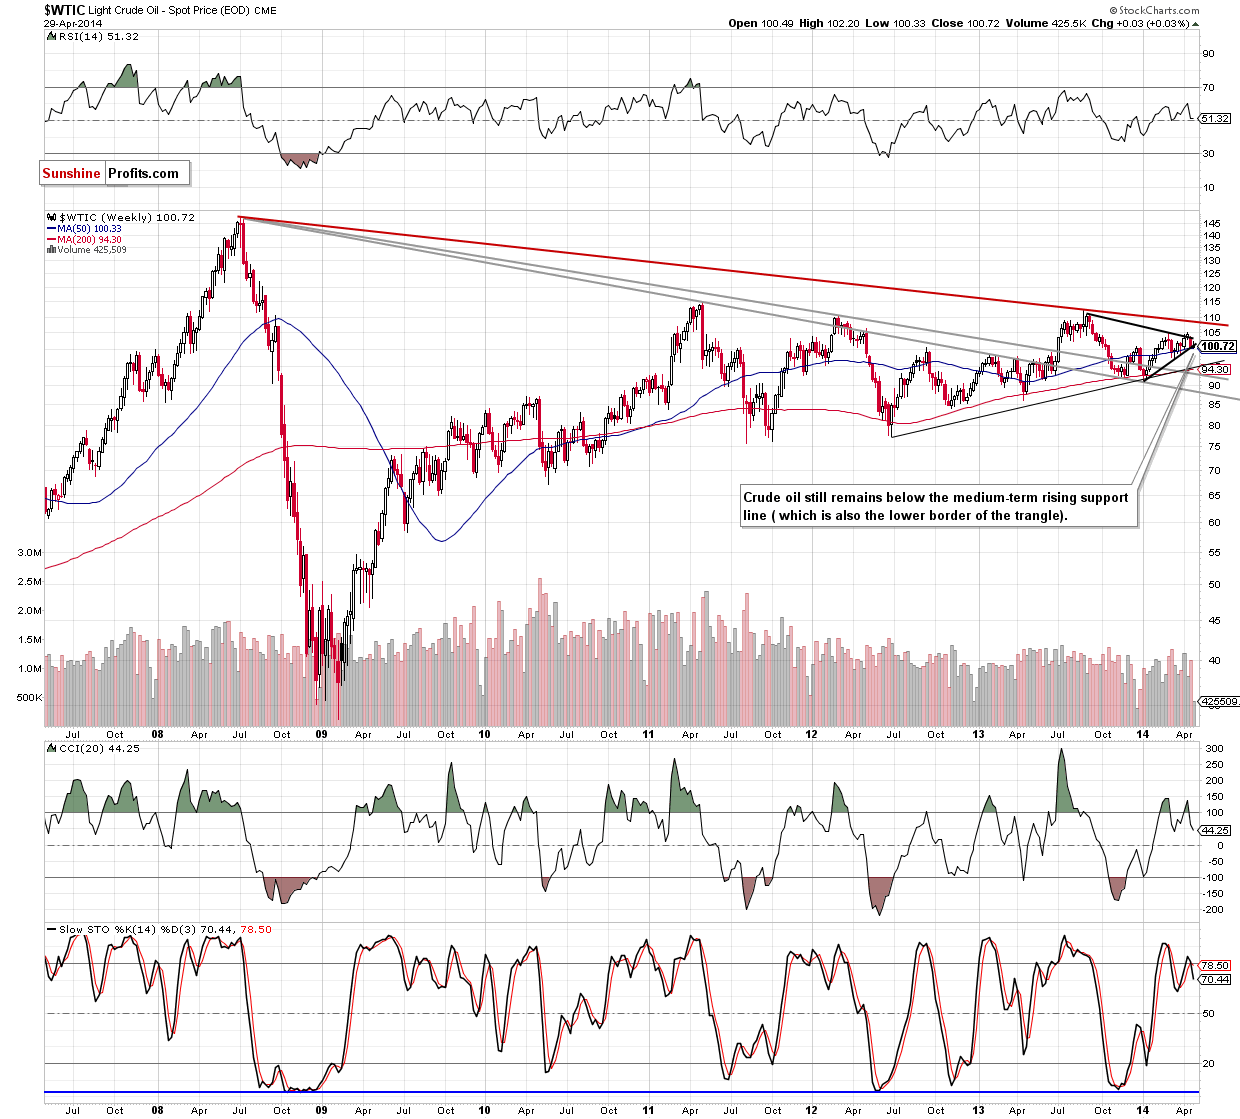
As you see on the above chart, the situation hasn’t changed much as crude oil still remains below the lower border of the triangle. From the weekly perspective, the breakdown is not confirmed. Therefore, on one hand, if light crude climbs above this support/resistance line and invalidates the breakdown, we may see a corrective upswing in the coming week (or weeks). In this case, the upside target will be the medium-term resistance line (currently around $103.50). However, if the commodity extends losses and drops below the psychological barrier of $100, we will likely see further deterioration and a drop even to around $95, where the medium-term support line (based on the June 2012 and January 2014 lows) is. At this point, it’s worth noting that the CCI and Stochastic Oscillator generated sell signals, which suggests that another attempt to move lower should not surprise us.
To see the current situation in crude oil more clearly, let’s zoom in on our picture and move on to the daily chart.
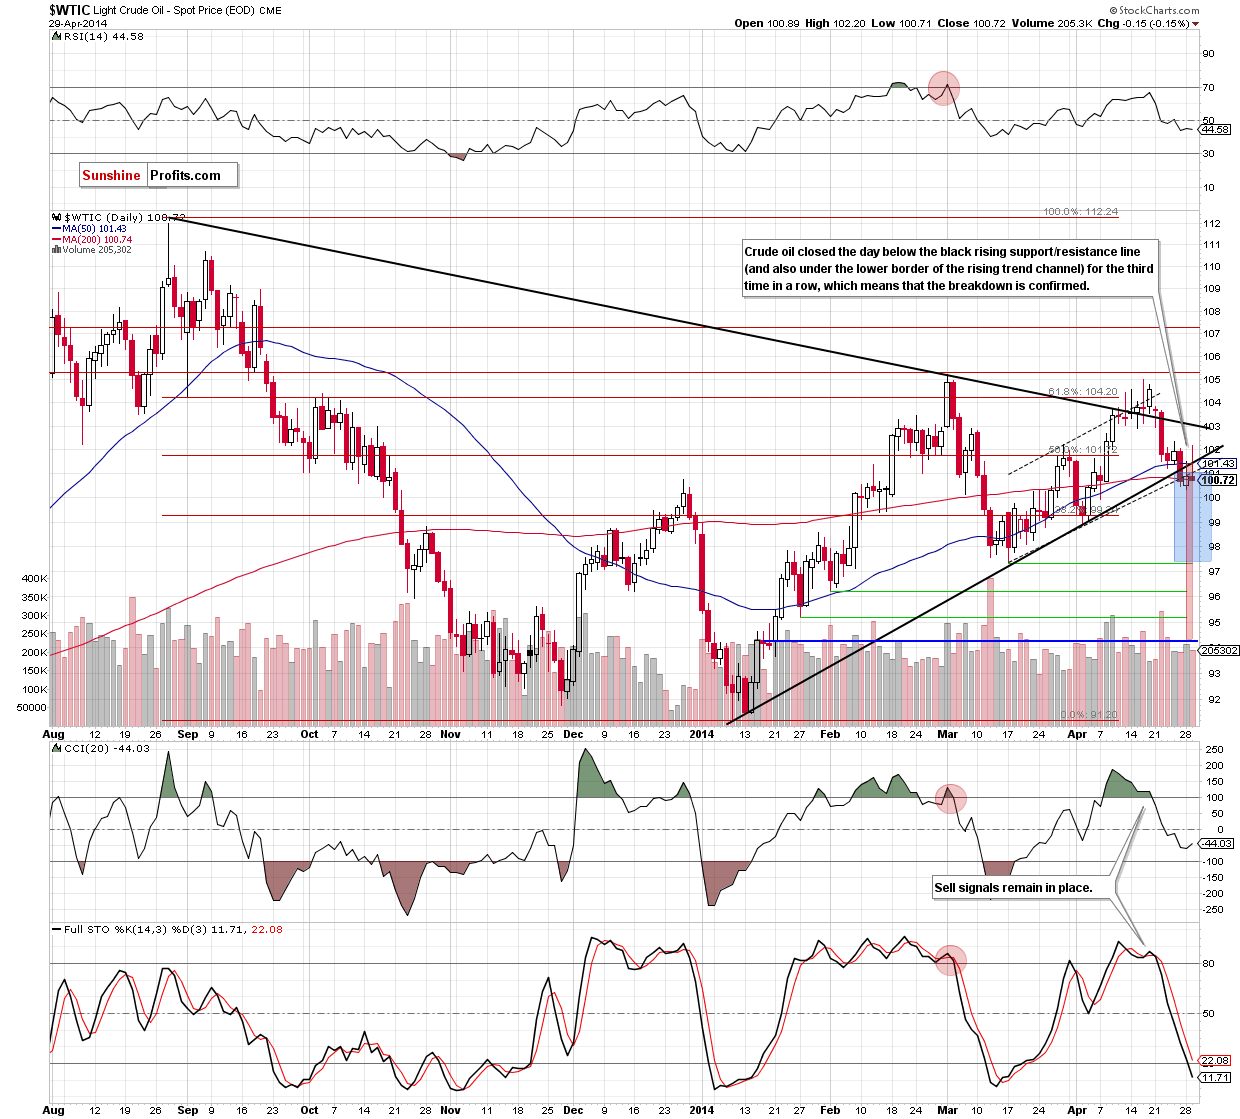
Looking at the above chart, we see that after the market's open crude oil bounced off the 200- day moving average and climbed to over $102. With this move, the price came back above the lower line of the triangle (the black rising line) and the lower border of the rising trend channel. However, as it turned out in the following hours, this improvement was only temporarily and light crude erased earlier gains, finishing the day 15 cents below Monday's closing price. In this way, the commodity closed the day under these two important lines for the third time in a row, which means that the breakout below them is confirmed. This is a bearish signal that will likely trigger further deterioration in the coming days.
In the case of the breakdown under the lower border of the trend channel, declines may push the price to around $97, where the size of the downswing will correspond to the height of the formation. Nevertheless, in our opinion, the confirmation of the breakdown below the medium-term line is more important because it suggests an even bigger move. In this case, the correction may be deeper and take light crude to around $94.20. At this point, it’s worth noting that the first downside target is supported by the March low of $97.37 and the latter corresponds to the 78.6% Fibonacci retracement based on the entire Jan.-March rally.
Before we summarize today’s Oil Trading Alert, we would like to emphasize that as long as the psychological barrier of $100 holds, another attempt to move higher can’t be ruled out.
Summing up, the most important event of yesterday's session was the confirmation of the breakdown below two major support/resistance lines, which may trigger further deterioration and take crude oil to around $97 or (if this support is broken) even to $94.20. Nevertheless, despite yesterday’s decline crude oil still remains above the key level of $100, which serves as major support at the moment. Although the breakdown is confirmed, we don't think it's enough to justify opening short positions - there's simply too much uncertainty in other parts of the market.
Very short-term outlook: bearish
Short-term outlook: bearish
MT outlook: mixed
LT outlook: mixed
Trading position (short-term): In our opinion no positions are justified from the risk/reward perspective. We will keep you informed should anything change, or should we see a confirmation/invalidation of the above.
Thank you.
Nadia Simmons
Forex & Oil Trading Strategist
Przemyslaw Radomski, CFA
Founder, Editor-in-chief
Gold & Silver Trading Alerts
Forex Trading Alerts
Oil Investment Updates
Oil Trading Alerts
