
Oil Trading Alert originally sent to subscribers on November 17, 2014, 11:05 AM.
Trading position (short-term; our opinion): Long positions with a stop-loss at $72.78 are justified from the risk/reward perspective.
Although crude oil hit a fresh four-year low on Friday, the commodity rebounded sharply as upbeat U.S. data and speculations that OPEC countries may consider cutting output supported the price. As a result, light crude closed the day above $75 and invalidated the breakdown below important support lines. Is it enough to trigger a trend reversal?
On Friday, the Census Bureau reported that U.S. retail sales rose 0.3% last month, beating expectations for a 0.2% gain, while core retail sales (without automobiles) increased by 0.3% in October. Additionally, the University of Michigan reported that its consumer sentiment index climbed to a more than seven-year high of 89.4 this month beating analysts‘expectations for a rise to 87.5. These bullish numbers supported the price fueling hopes that the world's largest economy is gaining steam and will consume more fuel and energy. Additionally, speculations that OPEC countries may consider cutting output supported the commodity as well. In this environment, light crude bounced off a four-year low and climbed above $75. Are there any other positive technical signals that could drive crude oil higher? (charts courtesy of http://stockcharts.com).
On Friday, we wrote the following:
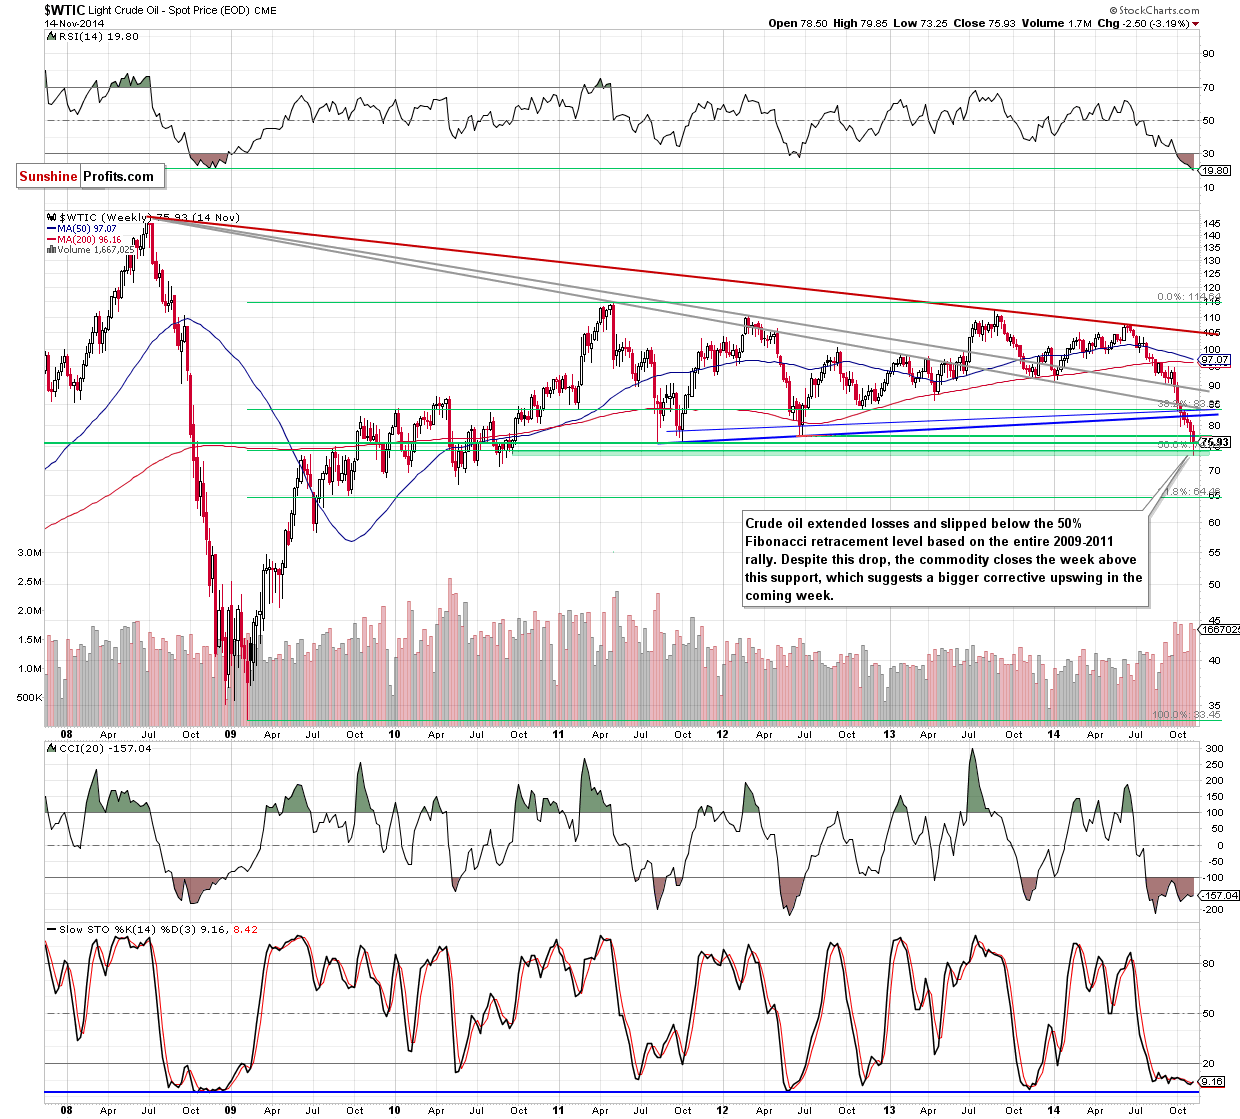
(…) even if we see another drop, the most important factor that could influence future’s moves will be the weekly closing price. The reason? If we see a breakdown under the 50% Fibonacci retracement, it would be a strong bearish sign, which could trigger further deterioration – even to around $70, where the next psychological barrier and the Aug 2010 low are. On the other hand, if the commodity invalidates the breakdown below this key support, closing above $74.20, it would be a bullish signal, which could signal a trend reversal.
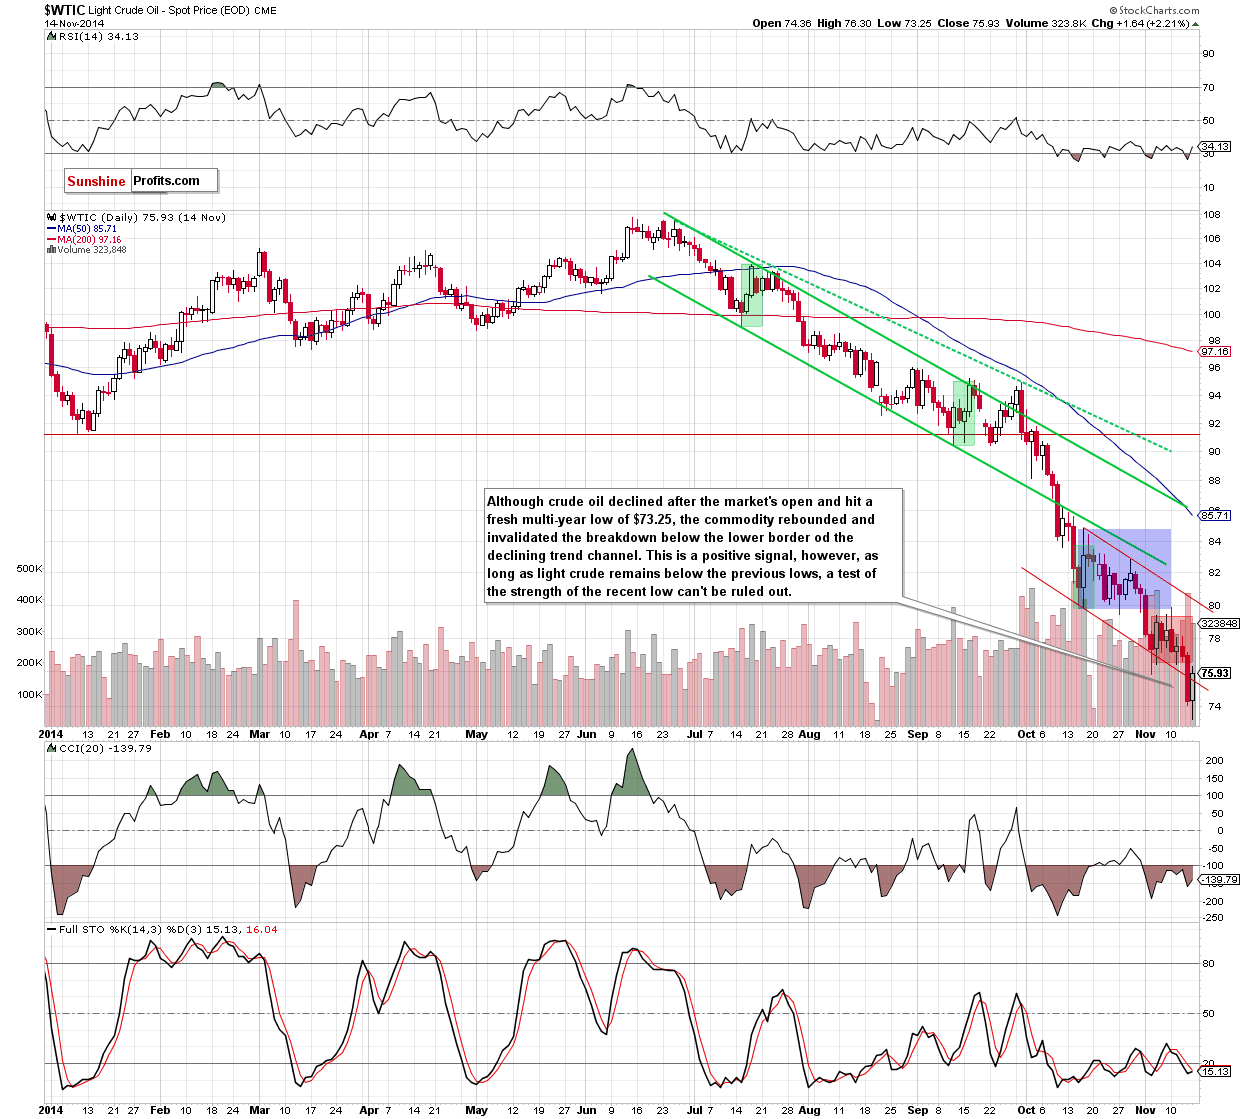
Looking at the above charts, we see that although crude oil slipped below the 50% Fibonacci retracement after the market’s open and hit a fresh four-year low of $73.25, the commodity reversed and rebounded sharply in the following hours. With this upswing, light crude came back above this key support level and invalidated a breakdown below the lower border of the declining trend channel (seen on the daily chart). These are strong bullish signals (especially when we factor in the fact that crude oil closed the previous week above $74.20), which suggests further improvement in the coming week. Nevertheless, as long as the commodity remains under the previous lows and the barrier of $80 another test of the strength of the 50% Fibonacci retracement and the recent low can’t be ruled out.
Summing up, the most important event of Friday’s trading day was another breakdown below the 50% Fibonacci retracement and its quick invalidation in the following hours. As we have pointed out before, this is a positive signal (especially when we factor in the fact that crude oil closed the previous week above it), which suggests further improvement in the coming week even if crude oil re-test the strength of this key support level.
Very short-term outlook: bullish
Short-term outlook: mixed with bullish bias
MT outlook: mixed
LT outlook: bullish
Trading position (short-term; our opinion): Long positions with a stop-loss at $72.78 are justified from the risk/reward perspective. We will keep you informed should anything change, or should we see a confirmation/invalidation of the above.
Thank you.
Nadia Simmons
Forex & Oil Trading Strategist
Przemyslaw Radomski, CFA
Founder, Editor-in-chief
Gold & Silver Trading Alerts
Forex Trading Alerts
Oil Investment Updates
Oil Trading Alerts
