

Oil Trading Alert originally sent to subscribers on June 13, 2016, 9:29 AM.
Trading position (short-term; our opinion): No positions are justified from the risk/reward perspective.
On Friday, crude oil extended losses as a stronger dollar continued to weigh on the price. Additionally, the Baker Hughes’ report showed another increase in drilling activity, which pushed the black gold lower as well. As a result, light crude lost 3.13% and slipped under the barrier of $50, invalidating earlier breakout. What does it mean for the commodity?
On Friday, the University of Michigan said in a preliminary report that its consumer sentiment index declined to 94.3 in Jun, beating expectations for a decline to 94.0. Thanks to this news, the USD Index extended gains, making crude oil less attractive for buyers holding other currencies. Additionally, later in the day, the Baker Hughes’ report showed that the number of rigs drilling for oil in the U.S. rose by 3, which raised speculations that domestic production could rebound in the coming weeks and pushed the price lower. In this way, light crude dropped under the barrier of $50 and closed the week below it, invalidating earlier breakout. What does it mean for the commodity? Let’s examine charts below and find out what can we infer from them (charts courtesy of http://stockcharts.com).
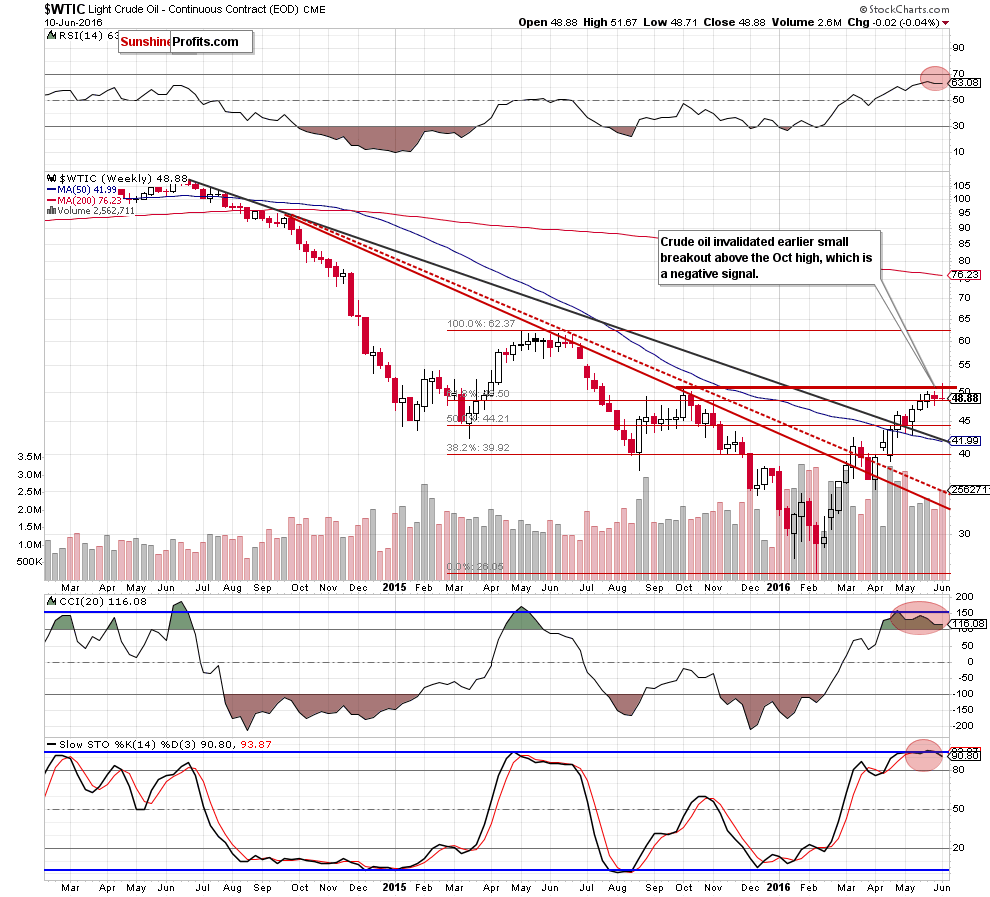
From the medium-term perspective, we see that the commodity increased slightly above the Oct high, but then moved lower and invalidated earlier breakout. This negative signal encouraged oil bears to act, which resulted in a drop under the barrier of $50. Additionally, the Stochastic Oscillator generated a sell signal, while the CCI is very close to doing the same, which suggests further deterioration in the coming week.
Will the very short-term chart confirm this bearish scenario? Let’s examine the daily chart and find out.
On Friday, we wrote the following:
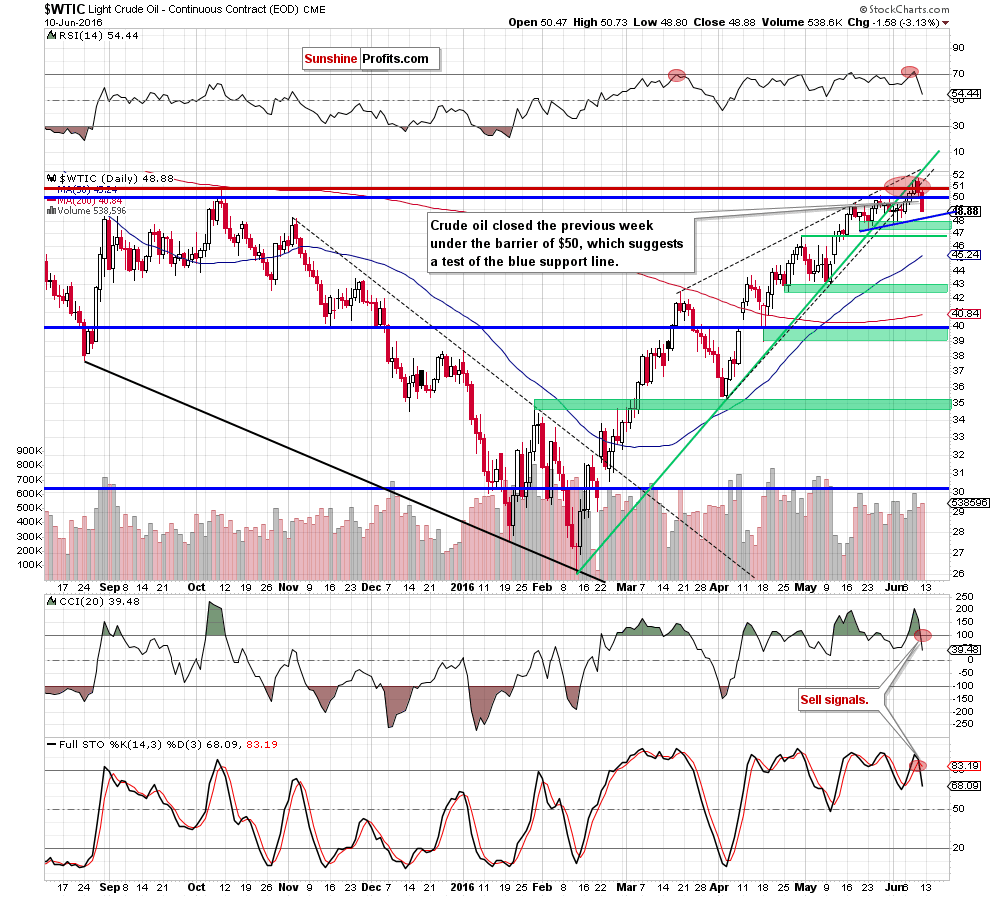
(...) the RSI generated a sell signal, while the CCI and Stochastic Oscillator are overbought and close to doing the same (particularly the latter), which suggests that further deterioration in the coming days is very likely – especially if the commodity drops under the barrier of $50 and invalidates earlier breakout above it.
Looking at the daily chart, we see that the situation developed in line with the above scenario and crude oil extended losses, closing the day under the barrier of $50 and invalidating earlier breakout above it, which is a negative signal, which suggests a drop to the blue support line based on the late May and Jun lows. If it is broken, oil bears will test the green support zone created by the late-May and Jun lows (around $47.40-$47.75) in the coming day(s). At this point, it is also worth noting that if we see such price action, we’ll consider opening short positions.
Having said the above, let’s take a closer look at our interesting ratios below. What can we know from the oil stocks-to-oil ratio? Let’s check.
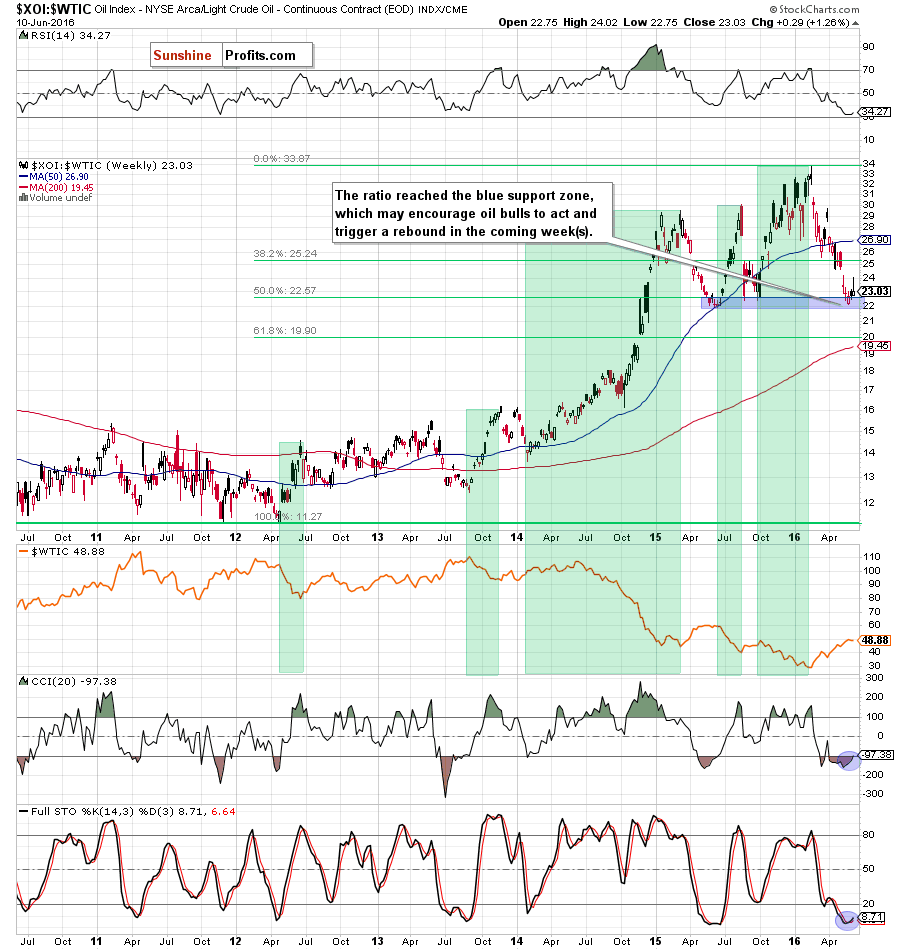
Looking at the above chart, we see that the oil stocks-to-oil ratio declined in recent weeks, reaching the blue support zone (created by the Jun, Aug and Sep 2015 lows and the 50% Fibonacci retracement). As you see on the chart, in Aug and Sep 2015 this area was strong enough to stop further declines, which resulted in a rally, which took the ratio to the 2016 highs. Taking this fact into account and combining it with the current position of the indicators (the RSI approached the barrier of 30, while the Stochastic Oscillator generated a buy signal and the CCI is very close to doing the same), we think that another upward move is just around the corner.
How such price action could affect crude oil? As you see on the above chart, there has been a strong negative correlation between the ratio and the price of the commodity in the previous years. Most of upwards moves in the ratio have corresponded to declines in light crude, which suggests that another rebound in the XOI:WTIC ratio will translate into lower values of the commodity in the coming weeks.
Will the gold-to-oil ratio confirm this scenario? Let’s check the chart below and find out.
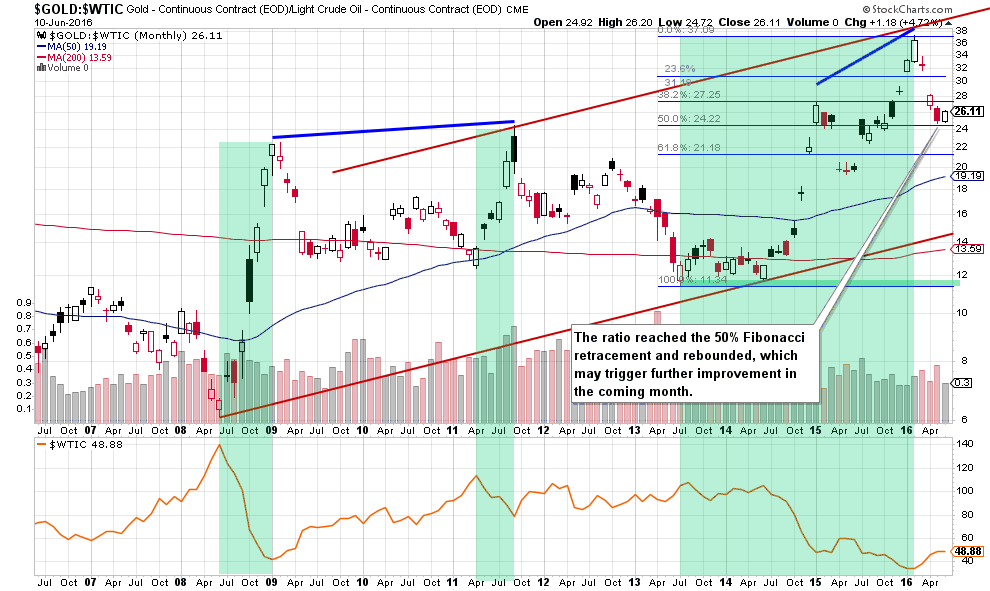
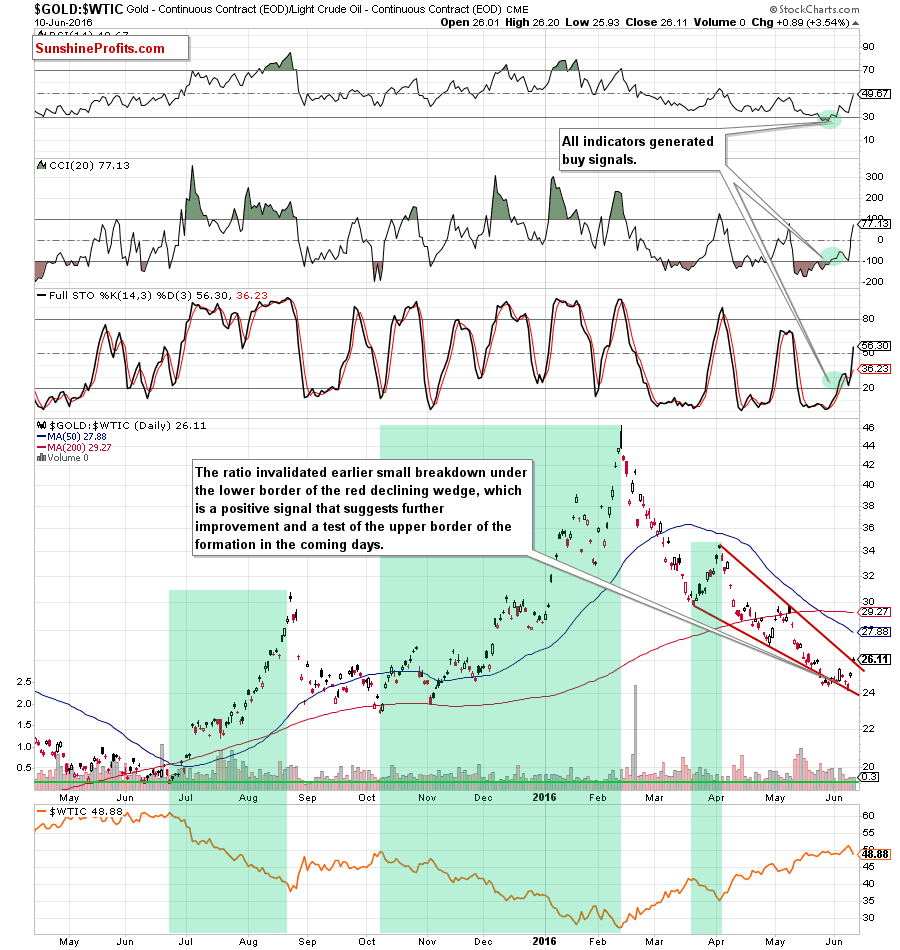
Looking at the relationship between gold and crude oil we see that the gold-to-oil ratio reached the 50% Fibonacci retracement (based on the entire Jul 2013-Feb 2016 upward move), which triggered a rebound (seen on the monthly chart). With this move, the ratio invalidated earlier small breakdown under the lower border of the red declining wedge (seen on the daily chart), which resulted in further improvement and a breakout above the upper border of the formation, which is a very positive signal – especially when we factor in buy signals generated by all daily indicators.
What does it mean for crude oil? As you see on the above charts, may times in the past higher values of the ratio have corresponded to lower prices of light crude. We have seen this strong negative correlation in the second half of Jun 2008, between Apr and Sep 2011 and also between Jul 2013 and Feb 2016 (we marked all these periods with green), which suggests that another (smaller or bigger) rebound of the ratio will translate into lower values of crude oil in the coming days or even weeks.
Before we summarize today’s alert, let’s take a closer look at the non-USD (WTIC:UDN ratio) chart of crude oil once again. As a reminder, UDN is the symbol for the PowerShares DB US Dollar Index Bearish Fund, which moves in the exact opposite direction to the USD Index. Since the USD Index is a weighted average of the dollar's exchange rates with world's most important currencies, the WTIC:UDN ratio displays the value of crude oil priced in "other currencies".
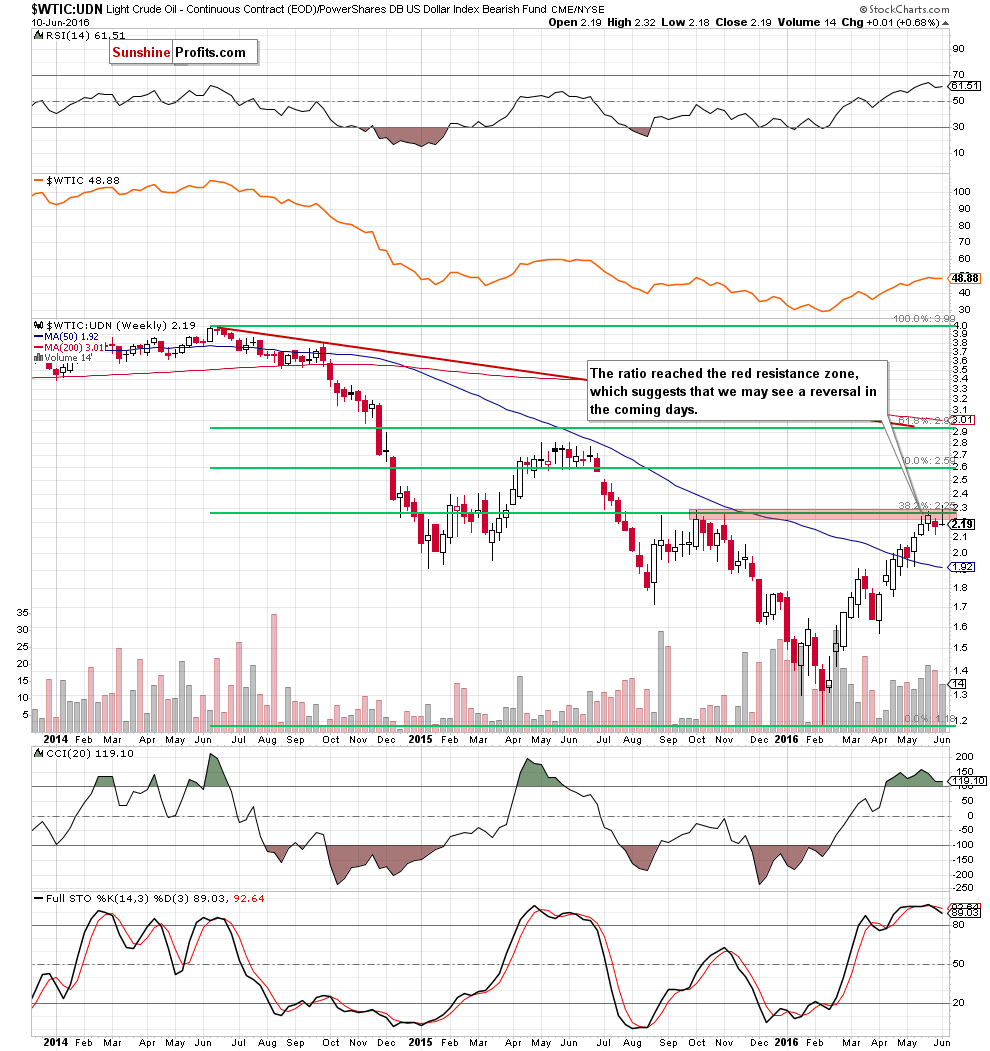
Looking at the weekly chart, we see that the ratio reached the red resistance zone (created by the Oct and Nov highs and the 38.2% Fibonacci retracement based on the entire Jun 2014-Feb 2016 downward move), which may stop oil bulls and trigger a pullback in the coming week(s). Taking this fact into account and the current position of the indicators (the Stochastic Oscillator generated a sell signal, while the CCI is close to doing the same), we think that reversal and further deterioration is just around the corner. If this is the case, and the ratio extends declines from here, well also see lower prices of crude oil in the following week(s).
Summing up, crude oil extended losses and closed the day (and the whole week) under the barrier of $50, invalidating earlier breakout, which is a bearish signal. Additionally, the daily CCI and Stochastic Oscillator generated sell signals, which in combination with the current situation in the above-mentioned ratios suggests further deterioration and a test of the support line based on the late May and Jun lows (or even the green support zone) in the coming days.
Very short-term outlook: mixed with bearish bias
Short-term outlook: mixed with bearish bias
MT outlook: mixed
LT outlook: mixed
Trading position (short-term; our opinion): No positions are justified from the risk/reward perspective. We will keep you – our subscribers – informed should anything change.
Thank you.
Nadia Simmons
Forex & Oil Trading Strategist
Przemyslaw Radomski, CFA
Founder, Editor-in-chief
Gold & Silver Trading Alerts
Forex Trading Alerts
Oil Investment Updates
Oil Trading Alerts
