

Briefly:
Intraday trade: The S&P 500 index may slightly extend its short-term advance today. However, we can see some technical overbought conditions that may lead to a downward correction. Therefore, we prefer to be out of the market again, avoiding low risk/reward ratio trades.
Our intraday outlook remains neutral, and our short-term outlook is bearish, as we expect downward correction. Our medium-term outlook remains bearish:
Intraday outlook (next 24 hours): neutral
Short-term outlook (next 1-2 weeks): bearish
Medium-term outlook (next 1-3 months): bearish
The U.S. stock market indexes gained between 0.1% and 1.1% on Wednesday, extending their short-term uptrend following better-than-expected economic data releases, among others. The S&P 500 index broke above its short-term consolidation along the level of 2,440-2,450. It is currently trading just 1.3% below the August 8 all-time high of 2,490.87. The Dow Jones Industrial Average was relatively weaker than the broad stock market, as it gained 0.1%, and technology Nasdaq Composite gained 1.1%. The nearest important level of resistance of the S&P 500 index is now at 2,465-2,475, marked by previous support level and local highs. The next resistance level is at 2,490-2,500, marked by the above-mentioned all-time high. On the other hand, support level is at 2,440-2,450, marked by previous level of resistance. The next support level is at 2.430-2,435, marked by last Tuesday's daily gap up and Wednesday's daily low. The support level is also at 2,400-2,420. The market has retraced most of its recent downtrend, as it broke above 2,450 mark. Will uptrend continue? Or is this just an upward move within a consolidation? The S&P 500 index continues to trade within a medium-term consolidation following early June breakout above 2,400 mark, as we can see on the daily chart:
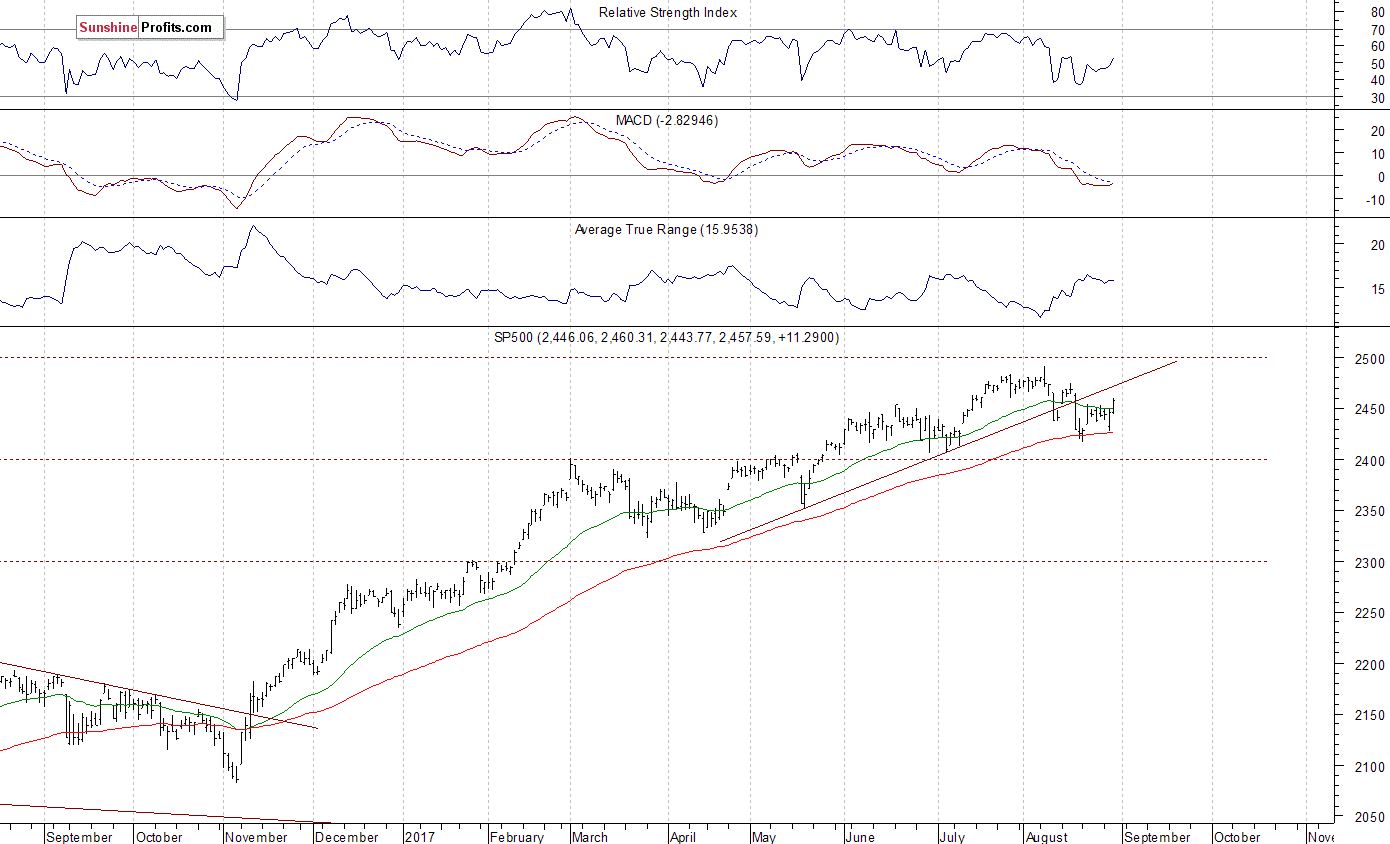
Will Uptrend Continue?
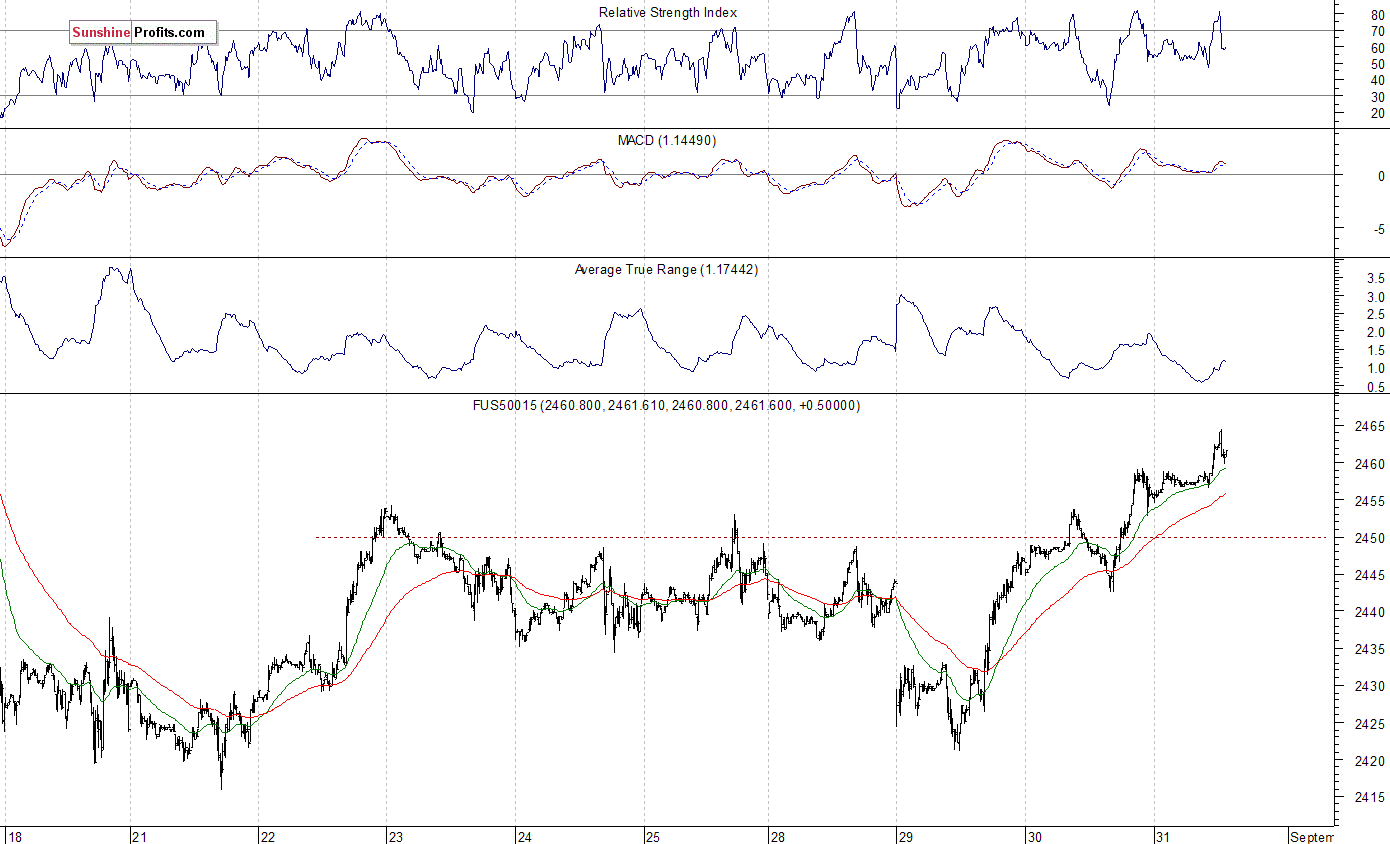
Expectations before the opening of today's trading session are positive, with index futures currently up between 0.2% and 0.3% vs. yesterday's closing prices. The European stock market indexes have gained 0.6-0.7% so far. Investors will now wait for some economic data announcements: Initial Claims, Personal Incime, Personal Spending at 8:30 a.m., Chicago PMI at 9:45 a.m., Pending Home Sales at 10:00 a.m. The market expects that the Initial Claims number was at 237,000 last week, Personal Income grew 0.3%, and Personal Spending grew 0.4% in July. The market also expects that Chicago PMI was at 58.7 in August. The S&P 500 futures contract trades within an intraday consolidation following an overnight move up. The market extends its short-term uptrend following Tuesday's intraday bounce after a lower opening. The nearest important level of resistance is at around 2,470-2,475, marked by some previous local highs. The next resistance level is at 2,480-2,490, marked by record high. On the other hand, the nearest important level of support is at around 2,450-2,455, marked by recent resistance level. The next support level is at 2,440-2,445, marked by yesterday's local low. Will uptrend continue? There have been no confirmed short-term negative signals so far. However, we can see some technical overbought conditions. The futures contract broke above its recent consolidation, as the 15-minute chart shows:
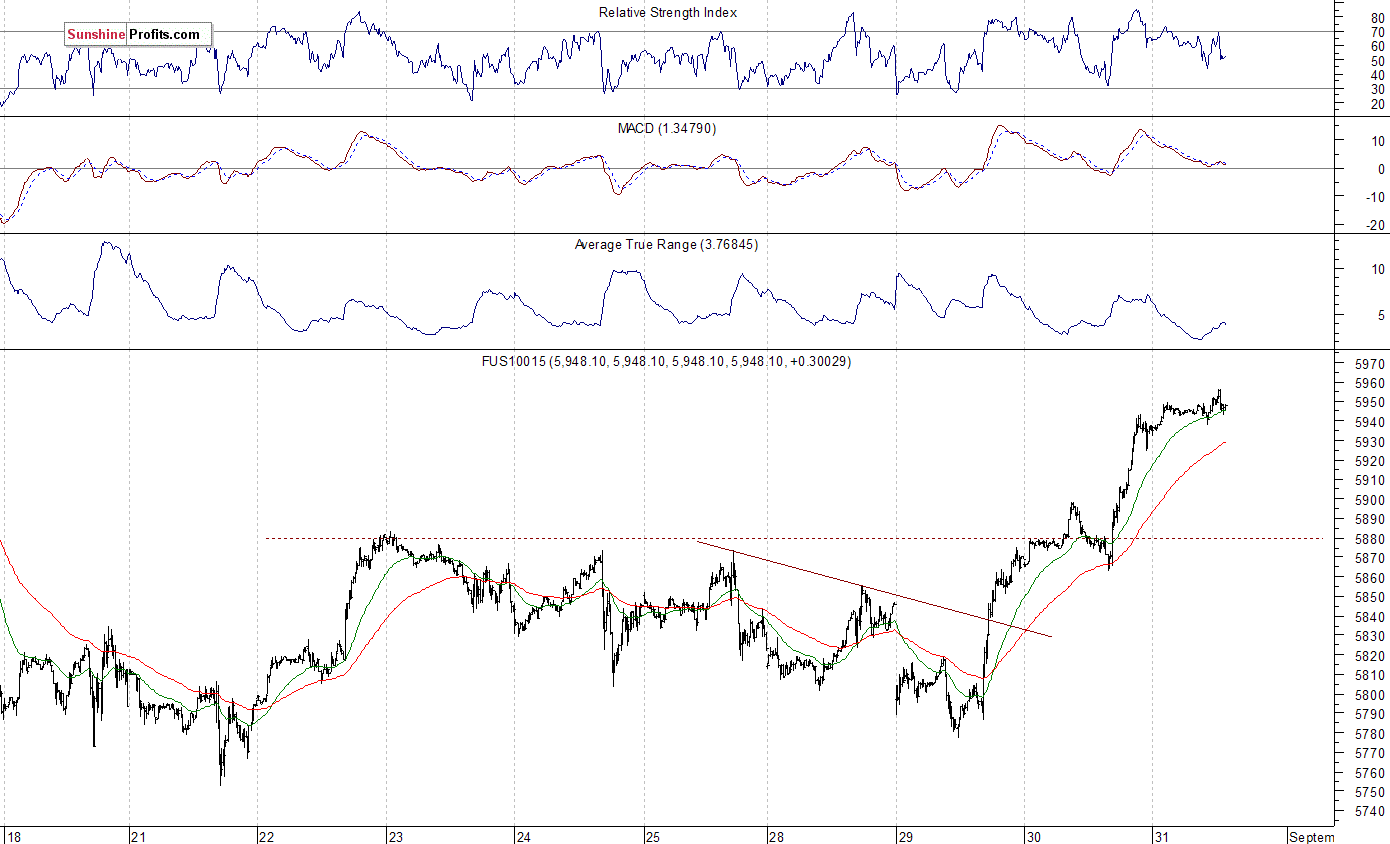
Nasdaq Remains Stronger
The technology Nasdaq 100 futures contract trades within a similar intraday consolidation following an overnight move up. It remains relatively stronger than the broad stock market, as it retraces its recent move down. The nearest important support level is at around 5,900-5,920, marked by previous resistance level. On the other hand, resistance level is at 5,970-6,000, marked by all-time high. Will technology stocks continue their rally towards new record highs?
Concluding, the S&P 500 index extended its short-term uptrend yesterday, as it broke above week-long consolidation along the level of 2,440-2,450. Will this uptrend accelerate towards new record highs? There have been no confirmed short-term negative signals so far. However, we still can see some medium-term overbought conditions along with negative technical divergences.
If you enjoyed the above analysis and would like to receive free follow-ups, we encourage you to sign up for our daily newsletter – it’s free and if you don’t like it, you can unsubscribe with just 2 clicks. If you sign up today, you’ll also get 7 days of free access to our premium daily Gold & Silver Trading Alerts. Sign up today!.
Thank you.
Paul Rejczak
Stock Trading Strategist
Stock Trading Alerts
